Market Snapshot
Key Takeaways
Market Overview & Analysis
Report Summary
The bakkie occupies a position in South Africa that no equivalent vehicle holds in most markets. At roughly 85% of light commercial vehicle sales it is the commercial vehicle market in practical terms, and because the leading models are built locally at Prospecton and Silverton it is also a manufacturing and export story rather than only a demand one. Analysis that treats pickups as a sub-segment of a broader commercial category understates both their share and their industrial weight.
The market is mature and highly penetrated, which is why the forecast is deliberately moderate. Volume gains through 2031 come from fleet replacement, small-business and construction demand, Chinese entries and premium double-cab demand rather than from first-time category adoption. A 4.40% compound rate on a 122,000-unit base is a replacement-cycle market, not an expansion one.
The analysis is written for component suppliers assessing local versus imported programmes, fleet operators comparing total cost of ownership, distributors evaluating entry, and investors screening accessories, conversions, telematics and aftermarket opportunities. It separates workhorse single-cab demand from lifestyle and premium double-cab demand throughout, because their economic drivers and margins differ materially.
South Africa Pickup Truck Market Size and Forecast
Pickup volumes are estimated at 122,000 units in 2025, rising to 134,000 in 2026 and 158,000 by 2031. The 2025 figure is a working estimate built upward from a reporting-model tally of approximately 120,545 units, allowing for brands and models that do not report into the same dataset while keeping the total below the 143,637-unit national light commercial vehicle series. Confidence is graded at the upper end of this research cluster.
Two growth rates apply and both are published. The six-year rate connecting 2025 and 2031 is 4.40%. The five-year rate connecting 2026 and 2031 is 3.35%, and it is lower because 2026 itself carries an unusually strong step: light commercial sales rose 10.1% in the first half and 13.0% in the first quarter, which supports a 134,000-unit full-year estimate rather than a flat extension of 2025.
Market value grows faster than unit volume throughout. On a weighted average transaction price rising from approximately ZAR 620,000 in 2025 toward ZAR 720,000 by 2031, and holding the conversion constant at ZAR 18.30 per USD, market value moves from roughly USD 4,133 million to USD 6,216 million at 7.04% a year. The price path is a disclosed working assumption rather than a published series, and it is supported by the premiumisation evident in the product mix.
The 2031 forecast assumes the category stays mature. Pickups are already deeply penetrated across business, agricultural and private use, so growth is a function of replacement timing, finance costs and business investment rather than of new adoption. Vehicle finance costs, fuel prices and business investment affect demand more directly than technology-specific incentives do.
Pickups Within the Light Commercial Vehicle Category
South Africa sold 143,637 light commercial vehicles in 2025, up 7.8% from 133,254 in 2024, and that national naamsa series is reported rather than modelled. Pickups at approximately 122,000 units represent roughly 85% of it, rising toward 87% by 2031 on the forecast for both series. The two markets are therefore close enough that a forecast of one implies a forecast of the other.
That containment is why this analysis covers the light commercial category as the denominator rather than as a separate subject. Light commercial sales reached 75,219 units in the first half of 2026, up 10.1% year on year, with July adding 13,710 units and August 13,727, up 11.0%, keeping the category on track for approximately 156,000 units in 2026. The pickup estimate is bounded by that series at every point.
The residual 15% is vans and compact commercial vehicles, and it behaves differently enough to warrant separate treatment rather than being inferred from pickup growth. South Africa also ranked fifteenth globally for light commercial vehicle production in 2025 with an estimated 1.2% global share, which is the clearest indication that this category is an industrial asset and not only a demand pool.
The Model League Table and Its 2026 Reordering
Toyota Hilux led 2025 with 36,525 units, comprising 35,441 internal combustion and 1,084 mild-hybrid units in model-level reporting, ahead of Ford Ranger at 25,465 and Isuzu D-Max at 21,194. Volkswagen Amarok followed at 4,290. Those four models account for the substantial majority of category volume and the competitive structure around them has been stable for years.
The first quarter of 2026 disturbed it. Isuzu D-Max reached 6,290 units on 12.6% growth and passed Ford Ranger, at 6,236 on 0.5% growth, by 54 units. Toyota Hilux grew 22.0% to 9,955 units from its Prospecton production base, extending rather than defending its lead. Mahindra Pik Up held fourth at 2,793 units, ahead of GWM P-Series at 1,805.
Half-year figures confirm the pattern rather than reversing it. Hilux reached 18,862 units in the first half of 2026, up 14.1%, Ranger 12,472, up 0.6%, and D-Max 10,068, up 2.3%, giving the three leaders 41,402 units between them. Ranger nonetheless led the double-cab subsegment with 10,075 units while Hilux led single and extended cabs, which is the clearest evidence that these are two different competitive races inside one category.
Volume is also leaving parts of the established field. Toyota Land Cruiser 79 fell 19.8% to 1,236 units in the first quarter of 2026 and Nissan Navara fell 30.9% to 1,068, while Volkswagen Amarok grew 48.9% to 1,188. A category growing at a low single-digit rate in aggregate is redistributing share at double-digit rates underneath, and a supplier planning against the aggregate will miss that entirely.
Chinese and Value Brand Entry
Chinese and value-oriented brands are the fastest-growing part of the category from a base small enough that percentage growth overstates their current weight. GWM P-Series reached 1,805 units in the first quarter of 2026 on 145.6% growth, JAC T-Series 750 units on 76.1% and Foton Tunland 629 units on 43.9%. Together those three account for roughly 3,184 units in the quarter against a top-ten bakkie tally near 31,950.
The entry pipeline is still filling. JMC re-entered the South African pickup market in April 2026 with the Vigus in 4x2 and 4x4 configurations, using a 2.5-litre turbodiesel producing 123 kW and up to 430 Nm with launch pricing from around ZAR 399,900. Chery confirmed plans in March 2026 to enter the double-cab segment, which would place another Chinese manufacturer directly into the part of the market the established locally produced models defend hardest.
Chinese growth is strongest where price-to-specification is compelling, but fleet buyers apply tests that specification sheets do not answer. Residual values, uptime, parts availability and national service coverage decide fleet tenders, and a brand without a proven parts network competes for private and small-business buyers rather than for the fleet volume that gives the category its stability.
Premiumisation and the Double Cab Divide
Volkswagen expanded the Amarok range in June 2026 with a Dark Label derivative offered with 2.0 TDI and 3.0 TDI V6 engines producing up to 184 kW and 600 Nm, priced above ZAR 1.0 million for the V6 version. Against a JMC Vigus entering at around ZAR 399,900, the category now spans a factor of roughly two and a half in price between its accessible and premium ends.
That dispersion is why market value grows at 7.04% while volume grows at 4.40%. The mix is shifting toward higher-specification derivatives faster than the aggregate unit count is expanding, which lifts the weighted average transaction price from approximately ZAR 620,000 toward ZAR 720,000 across the forecast. Premiumisation is a value story that a units-only view of this market cannot see.
Body style is the practical dividing line. Ranger led the double-cab subsegment with 10,075 units in the first half of 2026 while Hilux led single and extended cabs, and those two races have different buyers, different price points and different margin structures. Forecasting should separate workhorse single-cab demand from lifestyle and premium double-cab demand, because a single category growth rate averages two divergent economies.
Local Production, APDP2 and Export Programmes
Pickup demand is tied to the Automotive Production and Development Programme because Hilux, Ranger and D-Max are deeply linked to local assembly and export operations and to the supplier ecosystems around them. Toyota builds Hilux at Prospecton and Ford builds Ranger at Silverton, so a shift in domestic pickup share is also a shift in local content, employment and export programme volume.
South Africa produced 618,077 vehicles in 2025, up 2.9% from 600,473 in 2024, and exported a record 414,271 units. Automotive exports reached R291.0 billion, 15.6% of total South African exports. A category that is 85% of light commercial sales and built locally by the two largest players sits at the centre of that industrial position rather than alongside it.
Electrification enters through manufacturing incentives rather than through demand. Future electrified pickup production can access the Section 12V battery-electric and hydrogen production allowance where qualifying local manufacturing investment is undertaken, which means the first electrified bakkie is more likely to be an investment decision than a consumer one.
Vans and Urban Delivery Beyond the Pickup
The roughly 15% of light commercial volume that is not pickups is a genuinely different market and should not be inferred from bakkie growth. Compact and medium vans including Citroën Hola, Peugeot Partner, Renault Trafic and the locally built Volkswagen Vivo Xpress serve urban delivery, shuttle and small-business use cases that a one-tonne pickup serves poorly.
Those products compete on operating cost rather than on capability. Citroën launched the Hola compact panel van in May 2026 with fuel consumption quoted near 5.6 litres per 100 kilometres; Peugeot launched the Partner in June 2026 offering up to 4.4 cubic metres of cargo volume and 1,000 kg payload at about 5.1 litres per 100 kilometres; Renault reintroduced the Trafic Passenger in July 2026 for staff transport, tourism and shuttle operators.
Volkswagen introduced the locally built Vivo Xpress in February 2026 in the A0 city-van segment, using a 1.4-litre engine with roughly 490 kg payload, which gives the category a domestically produced compact delivery vehicle. Electrification will be use-case specific: fixed-route urban vans can electrify far faster than rural and worksite pickups with limited charging access, so the van residual is where electrified light commercial volume is most likely to appear first.
Fleet Economics and Total Cost of Ownership
For fleet buyers, purchase price alone underestimates competitive positioning, and the gap between a ZAR 399,900 entry model and a ZAR 1.0 million premium derivative narrows considerably once fuel, maintenance, finance, downtime and residual value are included. Total cost of ownership over a replacement cycle is the metric that decides tenders, and it is the metric on which established local production has its strongest advantage.
A supplier opportunity should be segmented by locally built versus imported bakkies, because original equipment content, aftermarket stocking and parts lead times differ significantly between them. A locally assembled Hilux and an imported Chinese competitor of similar specification generate different aftermarket economics for exactly the same reason they generate different residual values.
The category is large enough at 122,000 units a year to support dedicated ancillary businesses. Accessories, body conversions, fleet telematics and remanufactured or replacement parts all have addressable populations at this scale, and those businesses are less exposed to the 4.40% aggregate growth rate than to the parc of vehicles already on the road.
Market Dynamics
Key Drivers
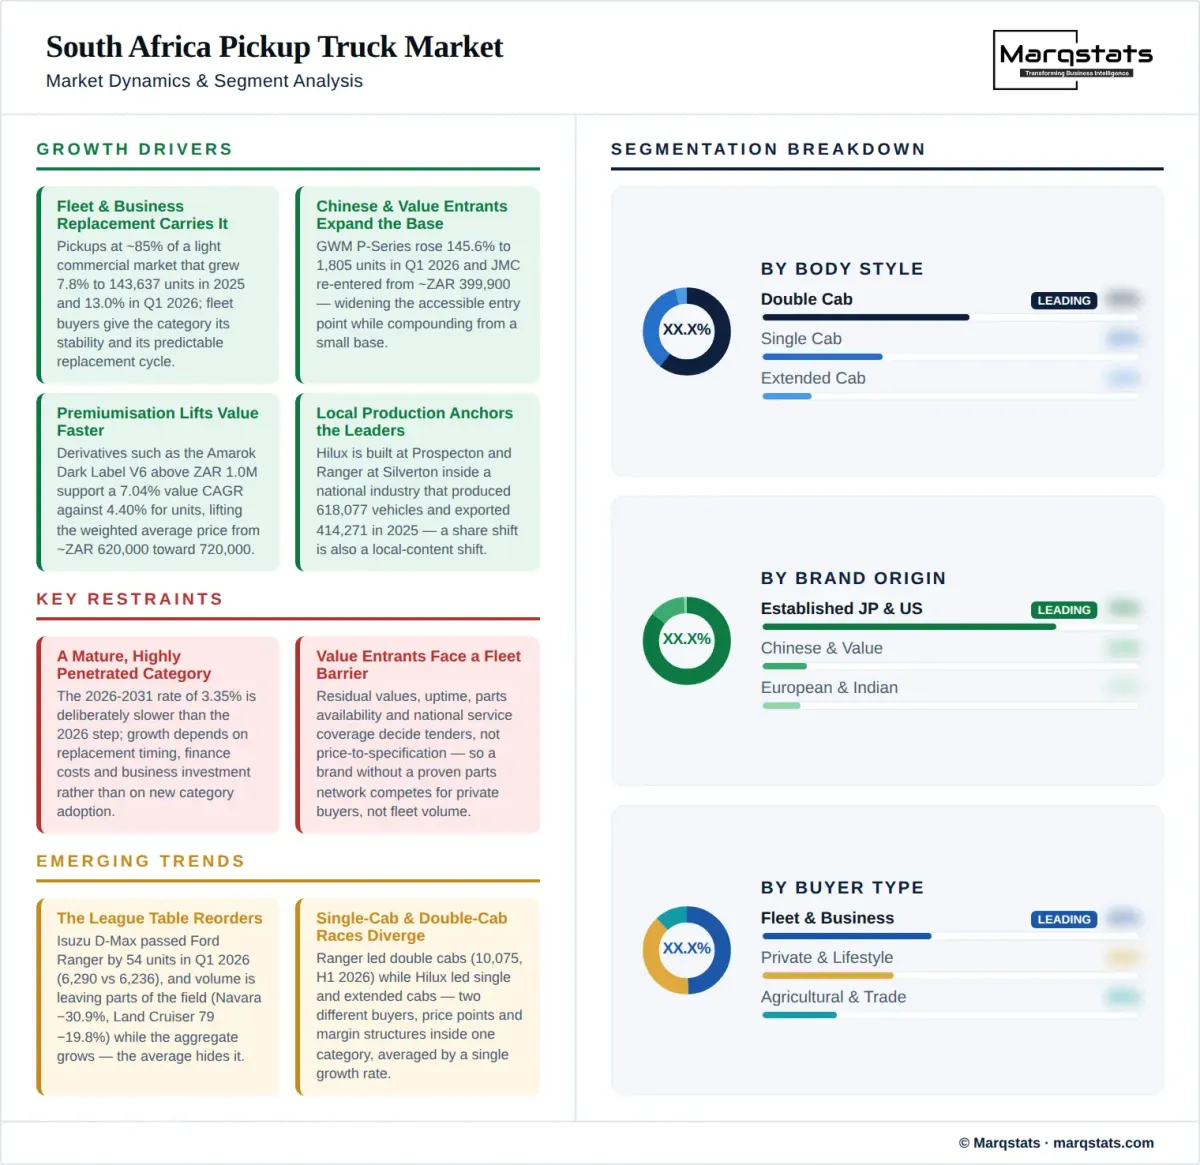
- Fleet and business replacement demand carries the category, with pickups at roughly 85% of a light commercial market that grew 7.8% to 143,637 units in 2025 and 13.0% in the first quarter of 2026.
- Chinese and value entrants are expanding the accessible end of the market, with GWM P-Series up 145.6% to 1,805 units in the first quarter of 2026 and JMC entering from around ZAR 399,900.
- Premiumisation lifts value faster than volume, with derivatives such as the Amarok Dark Label V6 priced above ZAR 1.0 million supporting a 7.04% value CAGR against 4.40% for units.
- Local production anchors the leading models, with Hilux built at Prospecton and Ranger at Silverton inside a national industry that produced 618,077 vehicles and exported 414,271 in 2025.
- Product investment by incumbents remains high, with Ford refreshing the Ranger lineup for Model Year 2026 and Volkswagen extending the Amarok range in the same year.
Key Restraints
- The category is mature and highly penetrated, which is why the 2026 to 2031 rate of 3.35% is deliberately slower than the 2026 step and why growth depends on replacement rather than adoption.
- Vehicle finance costs, fuel prices and business investment affect demand more directly than any technology incentive, leaving the category exposed to interest-rate and fuel-price cycles it cannot influence.
- Established volume is being lost as well as gained, with Nissan Navara down 30.9% and Toyota Land Cruiser 79 down 19.8% in the first quarter of 2026 while the aggregate grew.
- Value entrants face a fleet barrier that specification cannot clear, since residual values, uptime, parts availability and national service coverage decide tenders rather than price-to-specification alone.
Key Trends
- The league table is reordering under a stable aggregate, with Isuzu D-Max passing Ford Ranger by 54 units in the first quarter of 2026 at 6,290 against 6,236.
- Single-cab and double-cab races are diverging, with Ranger leading double cabs at 10,075 units in the first half of 2026 while Hilux led single and extended cabs.
- Price dispersion is widening at both ends simultaneously, spanning roughly ZAR 399,900 to above ZAR 1.0 million within one category.
- Electrification enters through manufacturing policy rather than demand, with the Section 12V production allowance available for qualifying battery-electric and hydrogen investment.
Market Segmentation
Single cabs are the workhorse end of the category and the body style Toyota Hilux led in the first half of 2026, alongside extended cabs. Demand is driven by payload, durability and total operating cost rather than by specification, and buyers are predominantly agricultural, construction and small-business operators for whom the vehicle is a production input.
Extended cabs sit between workhorse and lifestyle use and were led by Hilux alongside single cabs in the first half of 2026. The body style serves operators needing occasional passenger capacity without surrendering load area, and it is the smallest of the three by volume within a category of roughly 122,000 units.
Double cabs are the premium and lifestyle end and the subsegment Ford Ranger led with 10,075 units in the first half of 2026, despite trailing Hilux on total pickup volume. This is where the Amarok Dark Label at above ZAR 1.0 million and Chery's confirmed March 2026 entry plan both target, and where the value story of the category is concentrated.
Toyota, Ford, Isuzu and Nissan hold the substantial majority of the category, with Hilux at 36,525 units in 2025, Ranger at 25,465 and D-Max at 21,194. Their advantage rests on local production, dealer coverage, parts availability and residual values rather than on price, which is why value entrants have taken share at the accessible end rather than at the core.
GWM, JAC, Foton and JMC compete on price-to-specification and grow fastest in percentage terms, with GWM P-Series at 1,805 units in the first quarter of 2026 on 145.6% growth. Their combined first-quarter volume of roughly 3,184 units remains a small share of a top-ten tally near 31,950, so the growth rate and the current weight must be read together rather than separately.
Volkswagen and Mahindra occupy distinct positions at opposite ends. Mahindra Pik Up held fourth place at 2,793 units in the first quarter of 2026 on value and durability positioning, while Volkswagen Amarok grew 48.9% to 1,188 units on premium derivatives extending above ZAR 1.0 million. Neither competes directly with the locally built top three on volume.
Fleet buyers give the category its stability and apply the most demanding purchase test, weighing fuel, maintenance, finance, downtime and residual value over a replacement cycle rather than purchase price. They are the reason a 122,000-unit market grows at a predictable low single-digit rate, and the reason a new entrant without national service coverage cannot access the largest tranche of demand.
Small businesses and owner-operators are the most price-sensitive buyers and the entry point for value brands, which is why JMC launched the Vigus from around ZAR 399,900 and why GWM grew 145.6% in the first quarter of 2026. This buyer accepts a shorter dealer network in exchange for capital cost, but remains exposed to parts lead times that a fleet operator would price into a tender.
Private and lifestyle buyers concentrate in double cabs and drive the premiumisation lifting weighted average transaction price from approximately ZAR 620,000 toward ZAR 720,000. The Amarok Dark Label V6 above ZAR 1.0 million is aimed squarely at this buyer, for whom the bakkie is a discretionary purchase competing against passenger SUVs rather than a business input.
Hilux is built at Prospecton and Ranger at Silverton, inside a national industry that produced 618,077 vehicles and exported 414,271 units in 2025 with automotive exports of R291.0 billion. Local manufacture supports parts availability, residual values and Automotive Production and Development Programme qualification, and it is the structural reason the top three have held position for so long.
Imported models compete without the local-content advantages, and the fully imported Chinese trio of GWM P-Series, JAC T-Series and Foton Tunland together sold 3,184 units in the first quarter of 2026, or 9.97% of the top-ten bakkie volume of 31,950 units. That share matters more to aftermarket economics than to the showroom, because original equipment content, parts stocking and lead times differ significantly between locally built and imported bakkies, and a supplier opportunity should be segmented on that basis rather than on brand.
Conventional powertrains account for effectively the whole category, with only 1,084 of Hilux's 36,525 units in 2025 recorded as mild hybrid in model-level reporting. Turbodiesel remains the default for both workhorse and premium applications, ranging from the JMC Vigus at 123 kW and 430 Nm to the Amarok V6 at up to 184 kW and 600 Nm.
Electrified pickups are a manufacturing-policy question before they are a demand one, since the Section 12V production allowance is available for qualifying battery-electric and hydrogen investment. Rural and worksite duty cycles with limited charging access make the bakkie one of the harder light commercial applications to electrify, which is why fixed-route urban vans within the same 143,637-unit category will electrify first.
By Geography
Gauteng and the Industrial Heartland
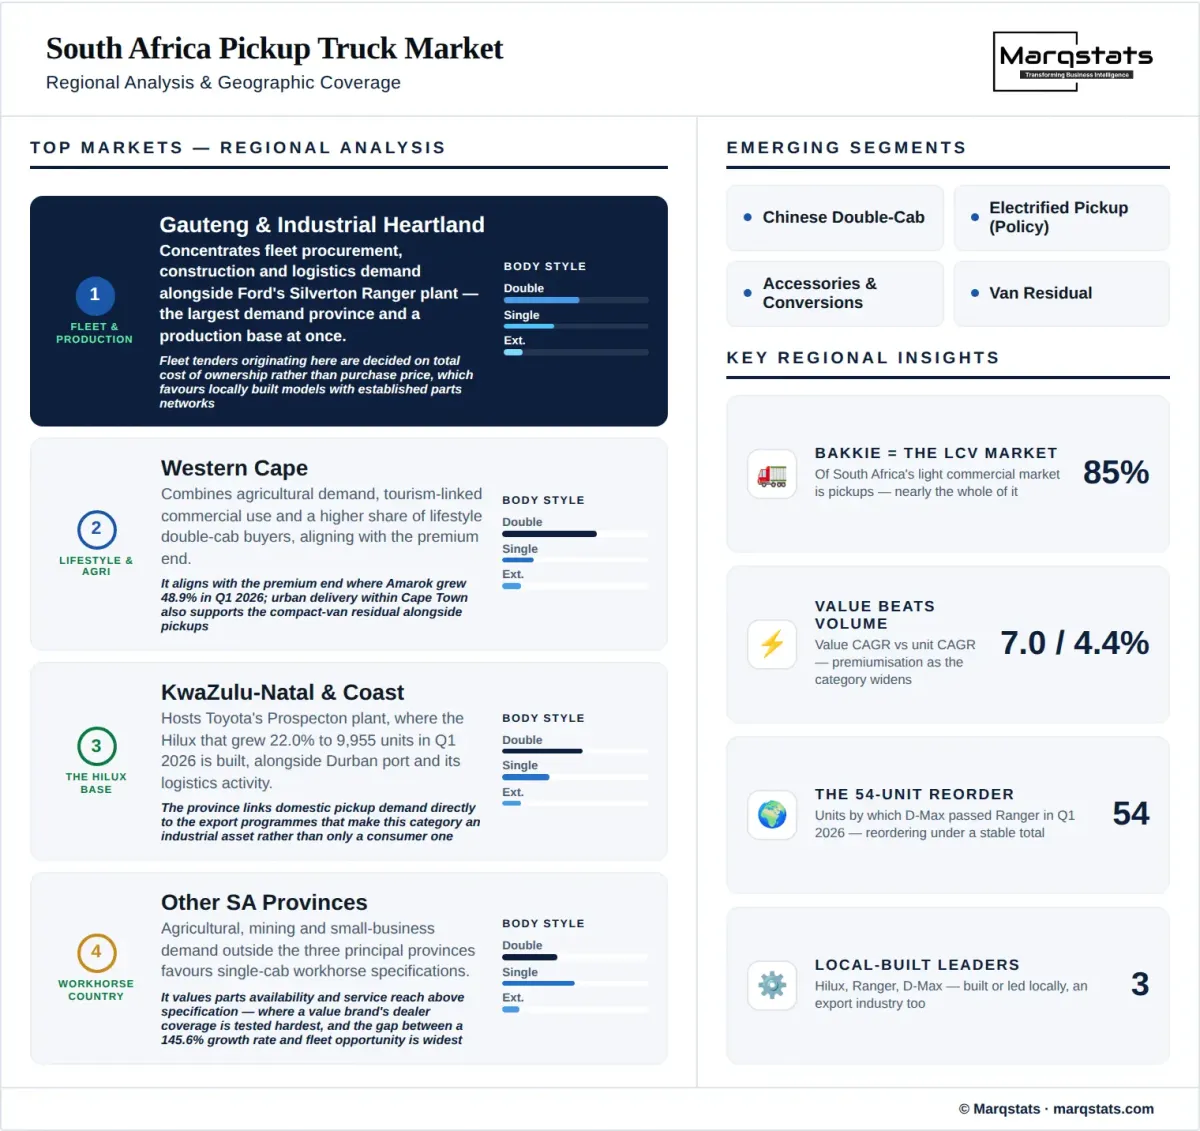
Gauteng concentrates fleet procurement, construction and logistics demand alongside Ford's Silverton Ranger plant, making it simultaneously the largest demand province and a production base within a national industry that exported 414,271 vehicles in 2025. Fleet tenders originating here are decided on total cost of ownership rather than purchase price, which favours locally built models with established parts networks.
Western Cape
The Western Cape combines agricultural demand, tourism-linked commercial use and a higher share of lifestyle double-cab buyers, which aligns with the premium end where Amarok grew 48.9% in the first quarter of 2026. Urban delivery within Cape Town also supports the compact van residual that sits alongside pickups in the 143,637-unit light commercial category.
KwaZulu-Natal and the Coastal Corridor
KwaZulu-Natal hosts Toyota's Prospecton plant, where the Hilux that grew 22.0% to 9,955 units in the first quarter of 2026 is built, alongside Durban port and the logistics activity around it. The province links domestic pickup demand directly to the export programmes that make this category an industrial asset rather than only a consumer one.
Other South African Provinces
Agricultural, mining and small-business demand outside the three principal provinces favours single-cab workhorse specifications and values parts availability and service reach above specification. It is where a value brand's dealer coverage is tested hardest, and where the gap between a 145.6% growth rate and an accessible fleet opportunity is widest.
How Competition Is Evolving
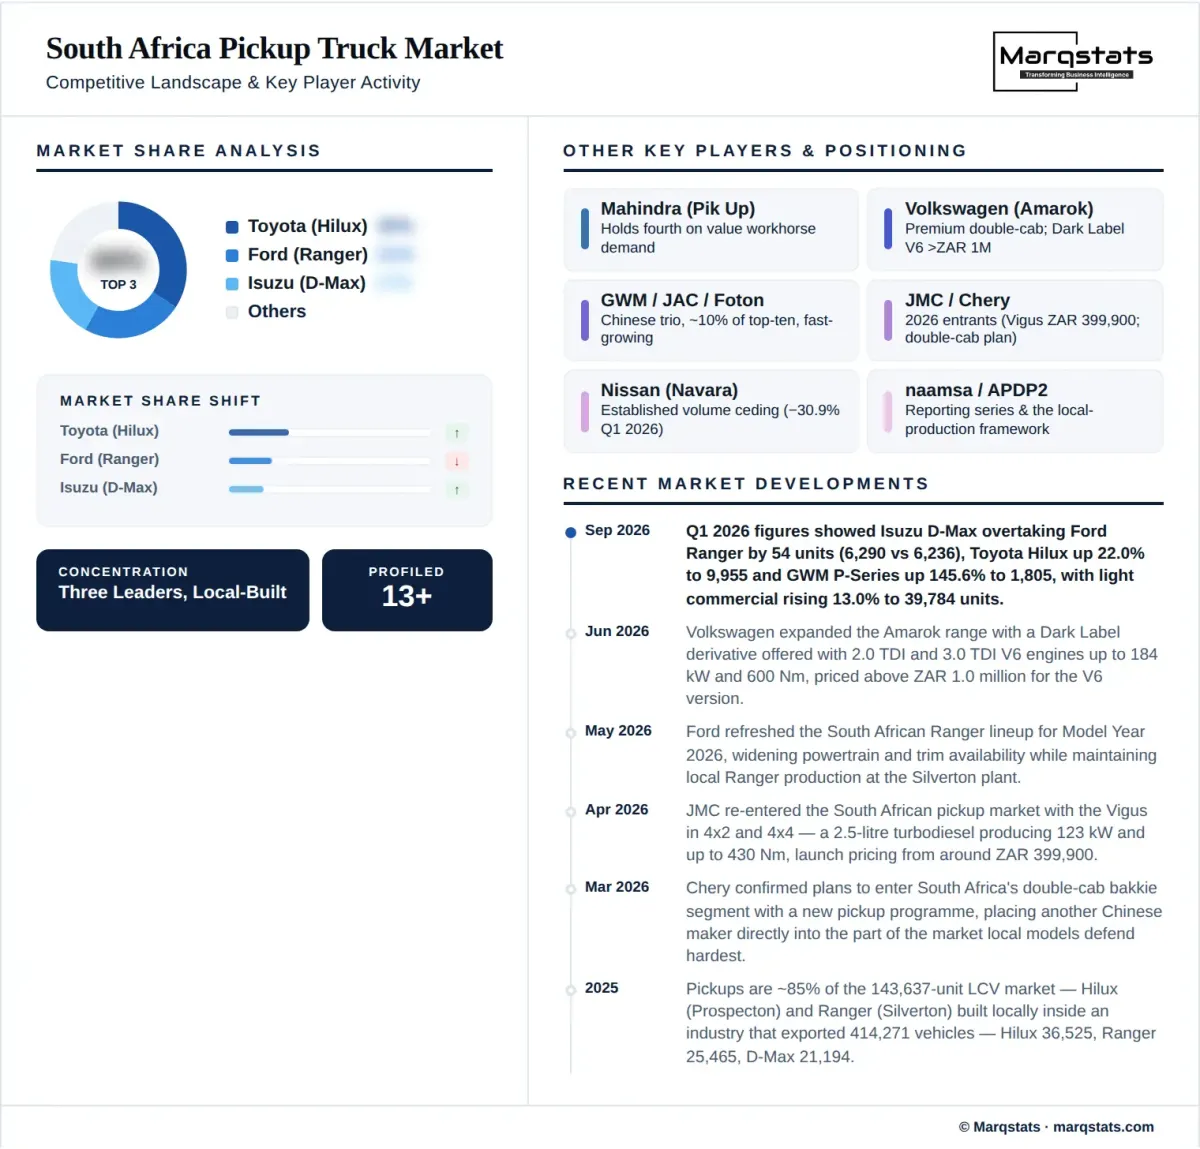
South Africa's pickup market is concentrated at the top and contested underneath. Toyota, Ford and Isuzu accounted for the substantial majority of 2025 volume through Hilux at 36,525 units, Ranger at 25,465 and D-Max at 21,194, and all three build locally. That combination of scale, local content and parts network has kept the competitive structure stable for years.
It moved in early 2026 without the aggregate moving much. Isuzu D-Max passed Ford Ranger by 54 units in the first quarter at 6,290 against 6,236, while Hilux extended its lead with 22.0% growth to 9,955 units. A category growing at low single digits in aggregate redistributed share at double digits underneath, and Nissan Navara at minus 30.9% and Toyota Land Cruiser 79 at minus 19.8% show the losses are as concentrated as the gains.
Chinese and value brands compete below the established three rather than against them. GWM P-Series grew 145.6% to 1,805 units in the first quarter of 2026, JAC T-Series 76.1% to 750 and Foton Tunland 43.9% to 629, with JMC re-entering in April 2026 from around ZAR 399,900. Mahindra occupies similar ground from a larger base at 2,793 units, and Chery confirmed in March 2026 that it intends to enter the double-cab segment directly.
The premium end is being defended and extended at the same time. Volkswagen added the Amarok Dark Label in June 2026 with V6 pricing above ZAR 1.0 million and grew 48.9% in the first quarter, while Ford refreshed the Ranger lineup for Model Year 2026. Sustained product investment by incumbents is what keeps the accessible entrants below rather than alongside them.
For a supplier or investor, the decisive question is local build versus import rather than brand origin. Original equipment content, aftermarket stocking and parts lead times differ significantly between the two, and a category of 122,000 units a year is large enough to support dedicated accessories, body conversions, fleet telematics and remanufactured parts businesses whose addressable base is the parc rather than annual sales.
Companies Covered
The report profiles 13+ companies with full strategy and financials analysis, including:
Recent Market Activity
Table of Contents
Coverage & Segmentation
The study covers South Africa with a 2025 base year, historical analysis from 2021 to 2025 and forecasts for 2026 to 2031. Headline CAGRs connect 2025 and 2031 across six years, and the narrower 2026 to 2031 rate is stated separately wherever used. The quantified measure is annual new pickup and bakkie registrations in units, with market value carried as a separate series on a disclosed average transaction price and a constant conversion of ZAR 18.30 per USD.
Coverage spans single, extended and double cab body styles; established Japanese and American, Chinese and value, and European and Indian brand origins; fleet, small-business and private buyers; locally manufactured and imported supply; and conventional and electrified powertrains. The national light commercial vehicle series is used as the containing denominator throughout, and compact and medium vans are analysed as the residual rather than merged into the pickup measure.
The analysis addresses supplier programme selection, fleet procurement, distributor entry and aftermarket investment. Stakeholder questions include why pickup demand and light commercial demand are nearly the same series, how far Chinese growth rates translate into accessible fleet volume, why market value grows faster than units, and what separates the single-cab and double-cab competitive races.