Market Snapshot
Key Takeaways
Market Overview & Analysis
Report Summary
Africa's used parts trade exists because Africa buys used vehicles. Roughly 60% of annual registrations across the continent are used imports, and in Kenya and Nigeria approximately 95% of vehicles added each year are second-hand, which produces a parc that is older, more repair-intensive and more dependent on salvaged components than any other major region. The parts market is a consequence of the vehicle market, not an independent phenomenon.
The measure is annual sales of used, salvaged, refurbished, reconditioned and factory-remanufactured automotive components across Africa. New replacement parts are excluded entirely, which keeps this panel well below the broader aftermarket and prevents double counting. Both the informal dismantler and parts-market channel and the organised layer of certified remanufacturers, OEM circular-economy programmes and digital marketplaces are counted, because a component's condition rather than its distribution channel defines the scope.
The analysis is written for remanufacturers assessing whether African core supply can support factory capacity, OEM circular-economy programmes evaluating dismantling and reverse-logistics investment, parts distributors and marketplaces weighing certified against informal competition, and policymakers designing end-of-life vehicle regimes. It treats core availability and traceability, not consumer demand or capital, as the variables that determine how much of this market formalises.
Africa Used and Remanufactured Auto Parts Market Size and Forecast
The combined market is estimated at USD 2,450 million in 2025, rising to approximately USD 2,800 million in 2026 and USD 4,750 million by 2031, an increase of USD 2,300 million across the window. The model is built from Africa's used-vehicle dependence, dismantling and recovery activity and parts-market structure, held deliberately below the total automotive aftermarket and constructed to avoid counting new replacement parts.
Two growth rates apply and both are published. The six-year rate connecting 2025 and 2031 is 11.67%. The five-year rate connecting 2026 and 2031 is 11.15%, and the 0.52-point gap reflects a modest 2026 step rather than a discrete event, because this market grows with the parc and with formalisation rather than with announcements.
Formal factory remanufacturing is benchmarked separately and is the smaller part. Public regional research places the formal Africa remanufactured parts market at about USD 1.0 billion by 2030, against an interpolated combined figure of roughly USD 4,254 million in the same year, which makes factory remanufacturing approximately 23.51% of the total. The remaining three-quarters is used, salvaged and reconditioned components moving largely through channels no agency measures.
Confidence is graded low and the reason is structural rather than methodological. The majority of transactions in this market occur between informal dismantlers, traders and independent workshops, in cash, without invoices, inventory systems or customs codes that separate a used alternator from a new one. A panel covering a market designed to be invisible carries a range, not a point claim.
The vehicle parc served grows from approximately 48.0 million to 72.0 million vehicles across the window, a 6.99% CAGR, so spend on used and remanufactured parts rises from USD 51.04 to USD 65.97 per vehicle. That 29.25% increase in per-vehicle spend, rather than parc growth alone, carries the difference between the two rates and is the clearest available measure of formalisation.
Europe Is Closing the Donor Pipeline and Opening a Competitor
The European Parliament adopted the End-of-Life Vehicles Regulation on 29 June 2026 with 437 votes. Its provisions apply two years after entry into force, and the prohibition on used vehicle exports takes effect five years after entry into force, placing the decisive change at the end of this forecast period rather than inside it.
Three provisions bear directly on African core supply. Vehicles classified as waste, meaning end-of-life or irreparably damaged, cannot be legally exported or resold as used vehicles; every exported vehicle requires a valid roadworthiness certificate; and member states must develop targeted inspection strategies to detect illegal activity. The cheapest donor vehicles, the ones dismantlers value most per dollar, are exactly the vehicles these rules remove.
The second effect is the one most commentary misses. The same regulation creates incentives for the reuse of spare parts and the sale of remanufactured components, naming turbochargers, starters and alternators specifically, which means European remanufacturers gain both a policy tailwind and first claim on cores that previously left the continent inside whole vehicles.
Recycled content targets reinforce the direction. At least 15% of plastic in new vehicles must be recycled within six years of entry into force, rising to 25% within ten years, with at least 20% of that recycled plastic originating from end-of-life vehicles, and steel and aluminium targets follow within two years. Each target increases the value of a European end-of-life vehicle to a European processor.
The net effect on Africa is a change in mix rather than a simple reduction. Fewer very low-quality donor vehicles arrive, the imported fleet that does arrive is newer and safer, and repair demand shifts from keeping failing vehicles alive toward maintaining a better parc, which favours certified reconditioned and remanufactured components over salvaged ones.
Africa Is Building Its Own End-of-Life Regime
Nigeria begins implementing an end-of-life vehicle programme in 2026 built around a mandatory recycling fee charged at registration on both newly imported and locally assembled vehicles, with projected annual revenue above NGN 150 billion and a stated aim of formalising the informal parts trade that currently dominates the market.
Set that against the trade it taxes. Nigerian vehicle imports ran at approximately NGN 1 trillion over nine months, an annualised NGN 1,333 billion, up 12.66% from NGN 894.09 billion in 2024, which makes the fee's projected yield equivalent to roughly 11.25% of annualised import value. That is a material new cost layer on a trade in which used vehicles accounted for 86% of imports between 2021 and 2025.
The programme also reaches outside Nigeria's borders. From 2026 all used vehicles destined for Nigeria must be inspected and certified in the exporting country, with the cost falling on foreign exporters rather than Nigerian buyers, which imports European-style quality control into the trade several years ahead of the European export ban itself.
Other governments are moving on the parts trade directly rather than on the vehicles. Uganda signalled in May 2026 that it would restrict imports of selected automotive spare parts already produced domestically as local manufacturing expands, which is a local-content instrument aimed at a market whose defining characteristic is that almost nothing in it is made locally.
The policy direction across both continents is consistent even though the instruments differ. Cheap, unverified vehicles and unverified parts are being progressively excluded, and the commercial opening that creates is for participants who can prove what a component is and where it came from.
Formalisation Is Not a Capital Problem
Stellantis opened a circular-economy dismantling centre in Casablanca in May 2026, the first in Morocco and the wider Middle East and Africa region and the third worldwide, at a cost of EUR 1.6 million across 6,000 square metres, with capacity to dismantle up to 10,000 vehicles a year and supporting around 150 direct and indirect jobs.
Divide those figures and the result reframes the investment case. The facility cost approximately EUR 160 per vehicle of annual dismantling capacity, occupies 0.60 square metres per vehicle-year and supports one job per 66.67 vehicles processed. Replicating it a hundred times across Africa, which would process a million vehicles a year, implies roughly EUR 160 million of capital against a market already worth USD 2,450 million.
Capital is therefore not what is missing. What is missing is predictable core supply, reverse logistics, traceability and the warranty infrastructure that lets a certified component command a premium over an identical-looking salvaged one, and none of those is bought with a construction budget.
The scale gap is the other half of the picture. Ten thousand vehicles a year is approximately 0.52% of the estimated 1.935 million used vehicles entering Africa annually, derived from continental new vehicle sales of around 1.29 million in 2025 against used imports representing roughly 60% of registrations. The region's first industrial dismantling centre handles half a percent of a single year's used-vehicle inflow.
Route to market is where the Casablanca model is genuinely novel. Recovered components are routed through Stellantis aftersales, the Distrigo distribution network, the Parts24 digital used-parts channel and local partners, which creates a traceable commercial pathway rather than a recovery operation that has to find buyers afterwards.
The Informal Sector Already Solved the Easy Problem
A peer-reviewed study of Morocco's informal end-of-life vehicle sector published in March 2025 sampled passenger cars at the Salmia scrap market and found approximately 7% aluminium and 76% iron by weight, quantifying the material recovery opportunity available from more formalised dismantling.
That composition explains why the informal sector is hard to displace. Metal is 83% of a vehicle's mass, it has an established buyer at a known price, and informal dismantlers recover it efficiently without certification, traceability or capital equipment. Any formal operator entering to compete for the metal is competing on a commodity where it has no advantage.
The remaining 17%, comprising plastics, glass, rubber, fluids and electronics, is where the informal process performs worst and where formal recovery has an actual edge. It is also the fraction the European recycled-content targets are aimed at, which means the formal economics improve as European demand for recovered polymer rises.
The larger prize is in components worth more whole than melted. An engine, transmission, turbocharger, alternator or starter recovered, tested and warranted is worth a multiple of its scrap value, and capturing that difference requires exactly the capabilities the informal channel lacks: diagnosis, reconditioning, traceability and a warranty someone will honour.
Nigeria's own programme puts the recoverable share at more than 85% of end-of-life vehicle parts being reusable or recyclable, covering engines, metals, plastics and electronics. The distance between that technical potential and what the informal channel actually captures is the commercial space this market's formal layer is being built into.
Three Channels, Three Different Businesses
Treating this as one market for sizing purposes is correct and treating it as one business for investment purposes is not. Informal salvage, organised tested and reconditioned parts, and factory remanufacturing carry different margins, different warranty expectations, different sourcing and different customers, and a strategy built for one fails in the others.
Informal salvage runs on speed, price and proximity, with no warranty and no traceability, and it will remain the largest channel by value throughout this forecast at roughly three-quarters of a market reaching USD 4,750 million. Its cost base cannot be matched by any formal operator and its quality cannot be guaranteed by anyone.
Organised reconditioning occupies the middle and is where most of the forecast growth sits. A tested, graded, warranted used component sold through a workshop network or a digital marketplace commands a premium over informal supply without requiring factory investment, which makes it the fastest route to formalising volume.
Factory remanufacturing is the smallest channel at roughly 23.51% of the 2030 market and the one with the hardest entry condition. A professional remanufacturing business needs core collection and reverse logistics before it needs factory capacity, because usable cores rather than production capability are the primary bottleneck, and a plant built ahead of a core network runs empty.
Market Dynamics
Key Drivers
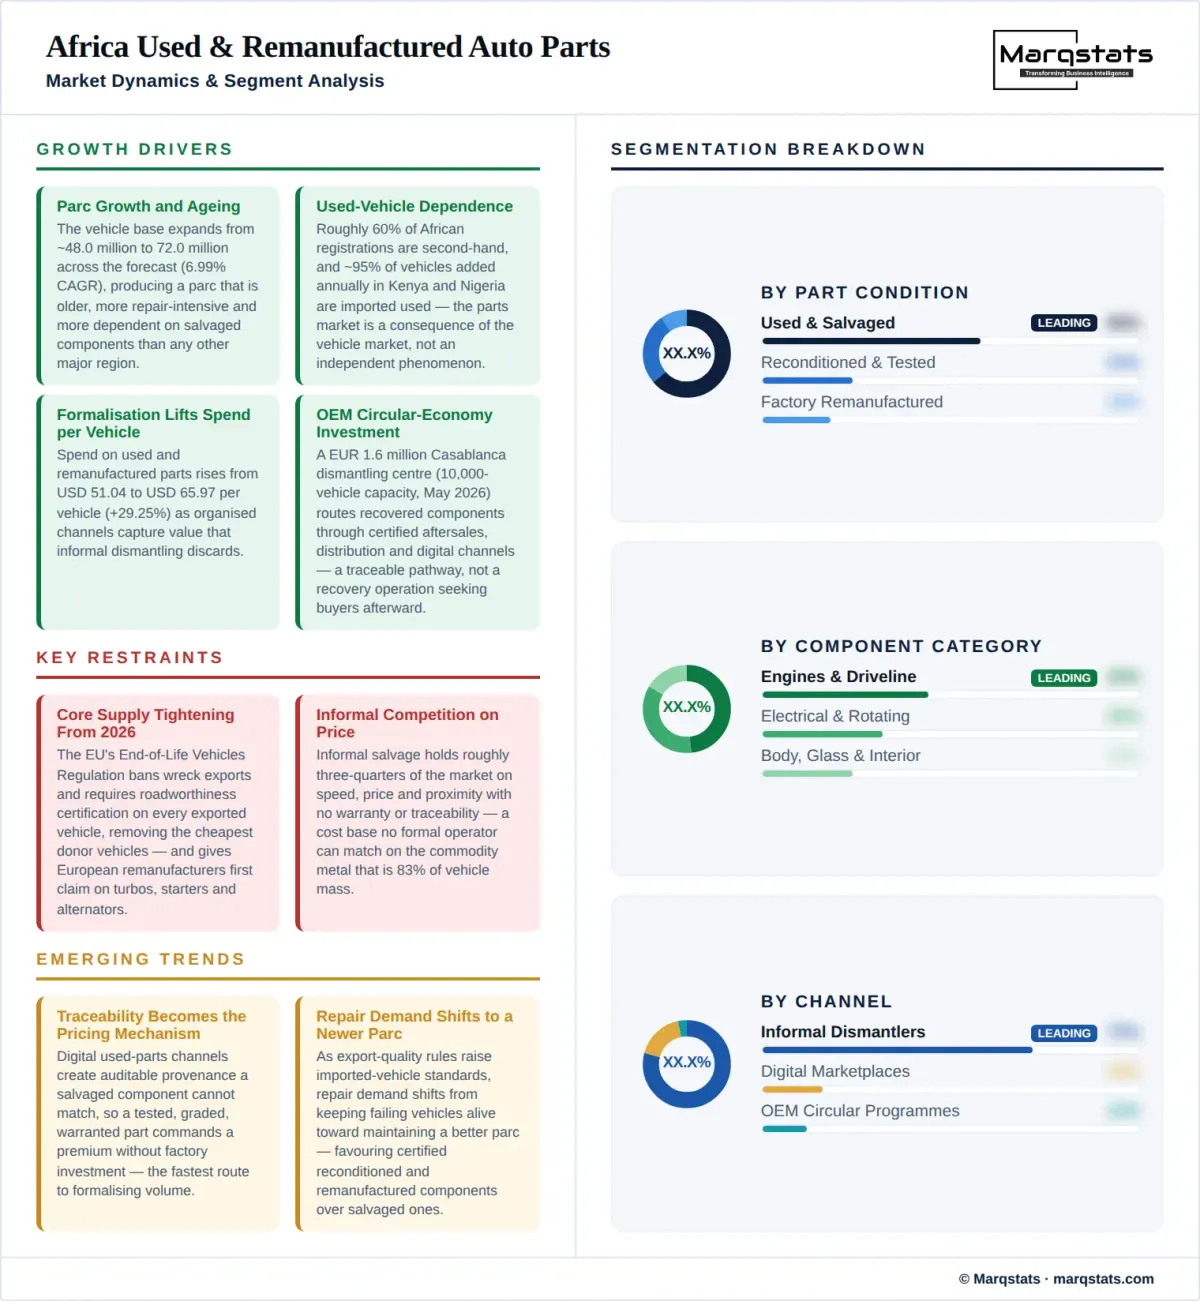
- Parc growth and ageing, with the vehicle base expanding from approximately 48.0 million to 72.0 million across the forecast at a 6.99% CAGR.
- Used-vehicle dependence, with roughly 60% of African registrations second-hand and approximately 95% of vehicles added annually in Kenya and Nigeria imported used.
- Formalisation of parts and service networks, lifting spend per vehicle from USD 51.04 to USD 65.97 across the window, a 29.25% increase.
- OEM circular-economy investment, exemplified by a EUR 1.6 million dismantling centre with 10,000-vehicle annual capacity opened in May 2026 and routed through certified channels.
- Regulatory formalisation, with Nigeria's end-of-life vehicle programme projected to raise more than NGN 150 billion a year from a recycling fee charged at registration.
Key Restraints
- Core supply tightening from 2026, as European rules ban wreck exports and require roadworthiness certification on every exported vehicle.
- European remanufacturers gaining first claim on cores, with the same regulation incentivising reuse and remanufacture of turbochargers, starters and alternators.
- Informal and counterfeit competition on price, in a channel holding roughly three-quarters of a market worth USD 2,450 million in 2025.
- Rising landed cost, with Nigeria's recycling fee alone equivalent to roughly 11.25% of annualised vehicle import value.
Key Trends
- Traceability becoming the pricing mechanism, with digital used-parts channels creating auditable provenance a salvaged component cannot match.
- Repair demand shifting from keeping failing vehicles alive toward maintaining a newer parc as export quality rules raise imported vehicle standards.
- Local-content policy reaching the parts trade directly, with Uganda signalling import restrictions on components already produced domestically in May 2026.
- Recovered polymer gaining value as European targets require 25% recycled plastic in new vehicles within ten years, with at least 20% sourced from end-of-life vehicles.
Market Segmentation
Components removed from donor vehicles and sold as found, with no testing, grading or warranty, and the largest channel by value across a market reaching USD 4,750 million by 2031. It competes on price and immediacy and its cost base cannot be matched by any formal operator.
Components cleaned, inspected, repaired to a defined standard and sold with a warranty, the segment carrying most of the forecast growth because it formalises volume without factory investment. Digital channels launched alongside the May 2026 Casablanca centre are the clearest route to market for this condition grade.
Components disassembled to piece part, restored to original specification and warranted as new, benchmarked at roughly USD 1.0 billion by 2030 or approximately 23.51% of the combined market. Entry requires core collection and reverse logistics before factory capacity, because usable cores are the primary bottleneck.
The highest-value recovery category and the one where the gap between scrap and functional value is widest, since an engine recovered from a vehicle that is 83% metal by mass is worth a multiple of its material content. Certification and warranty support premium pricing here more than in any other category.
Gearboxes, differentials and driveshafts, recovered whole and either sold used or reconditioned, and a category where diagnosis capability separates a reconditioner from a dismantler. Within a market reaching USD 4,750 million by 2031, failure rates on untested units are the principal reason workshops will pay for a warranted alternative.
Alternators, starters and turbochargers, named explicitly in the European regulation adopted on 29 June 2026 as targets for remanufacturing incentives, which makes this the category where African and European remanufacturers will compete most directly for the same cores.
Safety-critical components where certification and traceability carry the most commercial weight and where informal supply carries the most risk, on a continent where road traffic deaths run at close to 3 times the European rate. Warranty infrastructure rather than price decides purchases in organised channels, which is why this category formalises ahead of the other 4 component groups.
High-volume, low-value-density recovery covering doors, panels, lights, glass and trim, and the category most dependent on local donor availability because freight cost exceeds component value over distance. It sits largely within the 17% of vehicle mass that is not iron or aluminium.
Scrap yards, roadside dismantlers and open parts markets such as the Salmia market studied in Morocco in March 2025, holding roughly three-quarters of a market worth USD 2,450 million in 2025. Transactions occur in cash without invoices or inventory systems, which is why the panel is modelled rather than compiled.
Garages and parts retailers that source from dismantlers and resell with labour, the layer through which most used components actually reach a vehicle in a parc of approximately 48.0 million. They are the customer a certified supplier must convert, and they buy on availability before they buy on provenance.
Manufacturer-run dismantling and certified parts operations, currently represented in the region by a single facility processing up to 10,000 vehicles a year, or about 0.52% of annual used-vehicle inflow. Their advantage is traceability and warranty rather than cost.
Online channels creating searchable, auditable inventory across borders, including the used-parts platform connected to the May 2026 Casablanca operation alongside established distribution networks. Provenance becomes a priceable attribute only once a channel can record it.
The dominant core source, sustained by used imports representing roughly 60% of African registrations and an estimated 1.935 million vehicles a year. It is also the source most exposed to the European export prohibition taking effect five years after the regulation's entry into force.
Vehicles reaching the end of their life within Africa, a source that grows automatically as the parc expands from approximately 48.0 million to 72.0 million vehicles. Nigeria's recycling fee and deregistration framework are the first serious attempt to channel this flow into certified dismantling.
Damaged vehicles written off by insurers, the highest-quality core source per vehicle because components outside the impact zone are typically low-mileage, in a vehicle that is 83% metal by mass and far more valuable dismantled than scrapped. It is also the most formalised source, since insurance salvage already passes through a documented ownership transfer.
The largest application by unit volume across a parc reaching 72.0 million vehicles, dominated by used imports and served overwhelmingly by informal channels. Per-component values are lower and turnover is faster than in commercial applications.
Trucks, buses and light commercial vehicles where downtime carries a direct revenue cost, which makes operators willing to pay for warranted reconditioned and remanufactured units rather than accept the failure risk on salvaged ones. Engine and driveline remanufacturing economics are strongest here, which is why this application dominates the roughly 23.51% factory-remanufactured share.
By Geography
North Africa
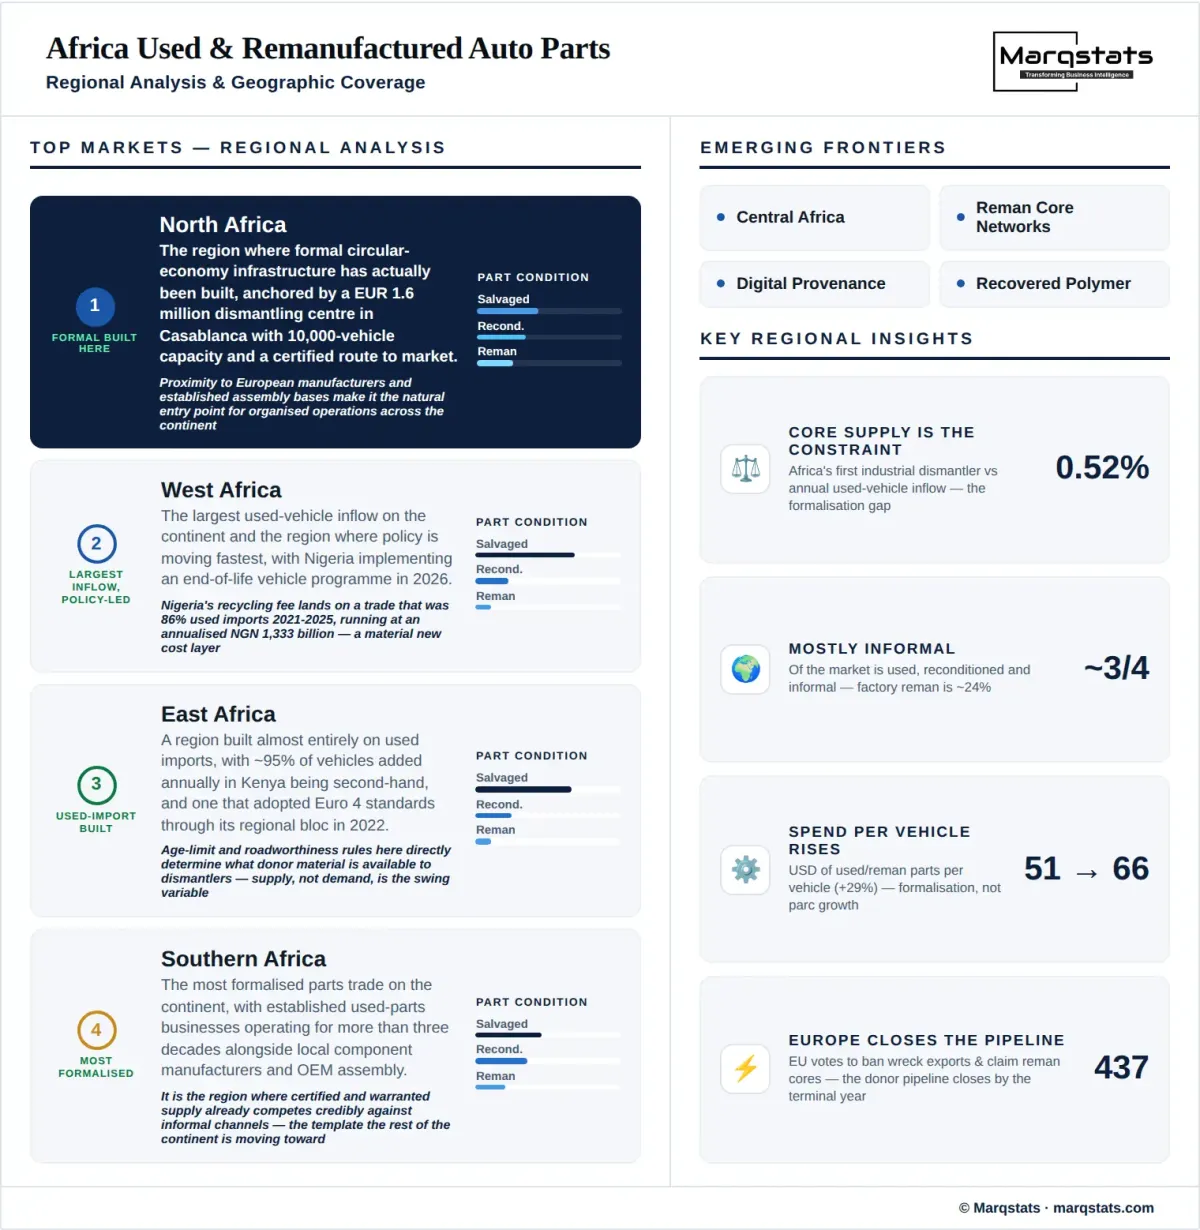
The region where formal circular-economy infrastructure has actually been built, anchored by a EUR 1.6 million dismantling centre opened in Casablanca in May 2026 with 10,000-vehicle annual capacity and a certified route to market. Proximity to European manufacturers and established assembly bases make it the natural entry point for organised operations.
West Africa
The largest used-vehicle inflow on the continent and the region where policy is moving fastest, with Nigeria implementing an end-of-life vehicle programme in 2026 and Nigerian vehicle imports running at an annualised NGN 1,333 billion. Used vehicles were 86% of Nigerian imports between 2021 and 2025.
East Africa
A region built almost entirely on used imports, with approximately 95% of vehicles added annually in Kenya being second-hand, and one that adopted Euro 4 standards through its regional bloc in 2022. Age-limit and roadworthiness rules here directly determine what donor material is available to dismantlers.
Southern Africa
The most formalised parts trade on the continent, with established used-parts businesses operating for more than three decades alongside local component manufacturers and OEM assembly. It is the region where certified and warranted supply already competes credibly against informal channels.
Central Africa
The least documented regional market and the one most dependent on cross-border parts flows from neighbouring hubs, contributing to the roughly three-quarters of this market that moves through channels no agency measures. Donor vehicle availability rather than demand limits activity here.
How Competition Is Evolving
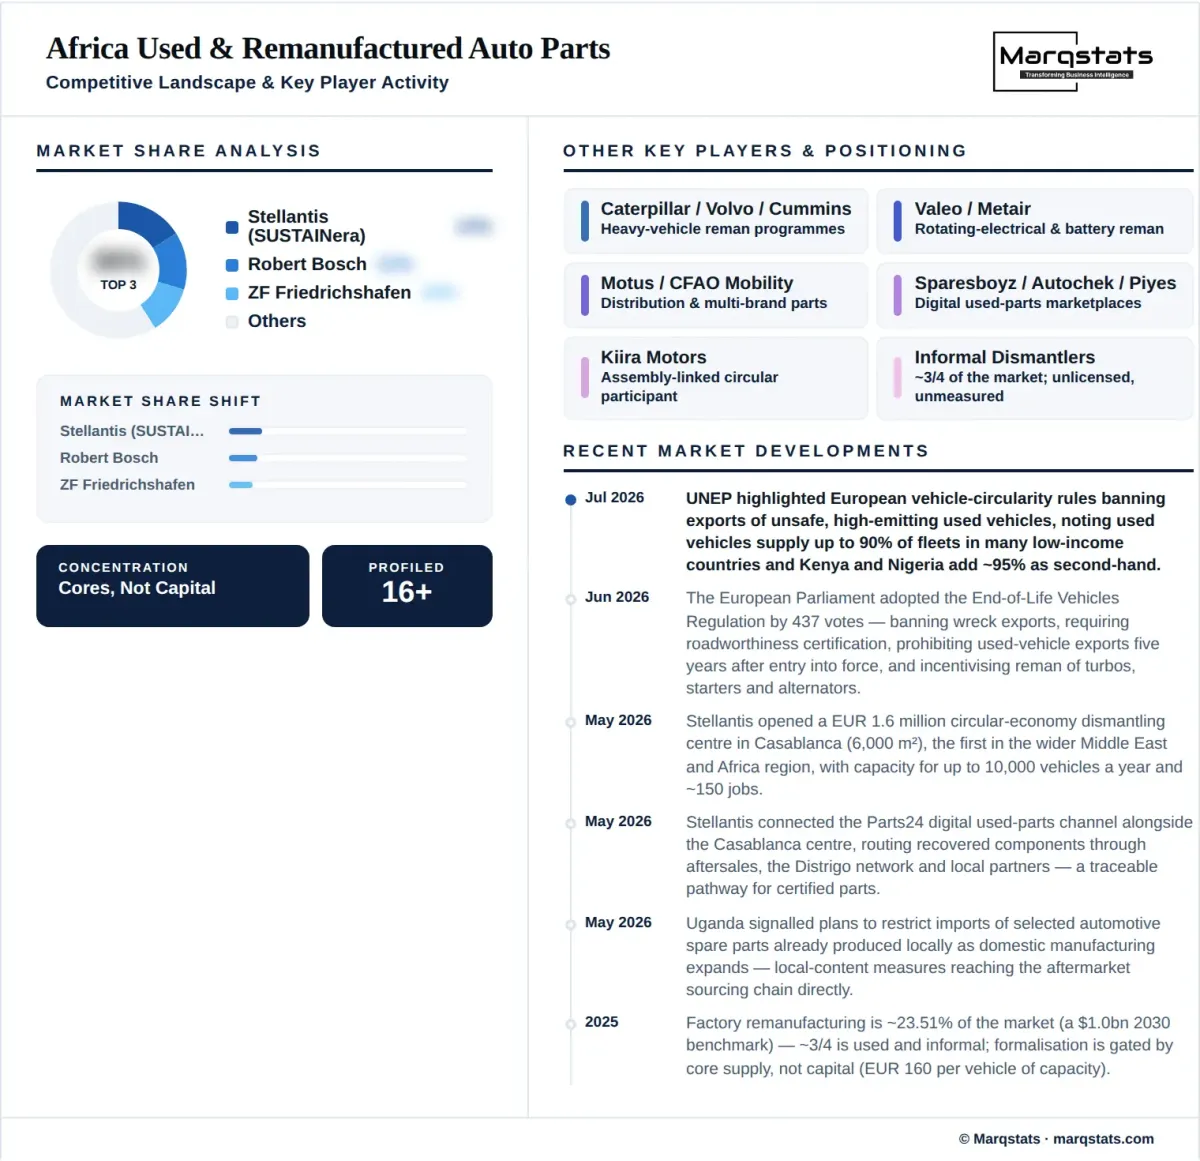
The competitive structure of this market is unusual because its largest participants are not companies. Informal dismantlers and parts traders hold roughly three-quarters of a market worth USD 2,450 million in 2025, operate without brands, balance sheets or fixed locations, and cannot be acquired, partnered with or competed away on cost.
Global remanufacturers including Bosch, ZF, Caterpillar, Volvo, Scania and Cummins hold the technical capability and the warranty credibility, and are strongest in commercial vehicle, mining and industrial applications where downtime cost justifies certified components. Their African constraint is core collection rather than manufacturing capacity.
Stellantis has taken the most complete position, pairing a dismantling centre with certified aftersales distribution, a digital used-parts channel and local partners in a single routed system. That combination of recovery and route to market is what distinguishes a circular-economy programme from a recycling investment, and no other manufacturer currently operates one in the region.
African participants are strongest where trust and local presence matter most. Long-established used-parts businesses in Southern Africa, regional distribution groups and digital parts marketplaces hold customer relationships with the independent workshops through which most components actually reach vehicles, which is the channel any entrant must convert.
For an entrant the decisive judgement is which scarce asset to build. Capital is not scarce at roughly EUR 160 per vehicle of annual dismantling capacity, technical capability can be licensed, and the genuinely hard assets are a reliable core stream, reverse logistics that work across fragmented borders, and a warranty a workshop believes in.
Companies Covered
The report profiles 15+ companies with full strategy and financials analysis, including:
Recent Market Activity
Table of Contents
Coverage & Segmentation
This analysis measures annual sales of used, salvaged, refurbished, reconditioned and factory-remanufactured automotive components across Africa from 2021 to 2031, with 2025 as the base year and 2026 to 2031 as the forecast period. New replacement parts are excluded entirely, which keeps the panel well below the total automotive aftermarket and prevents double counting. Both informal and organised channels are included, because a component's condition rather than its distribution route defines the scope.
Coverage spans three condition grades, five component categories, four channels, three core sources and two vehicle applications, with five regional clusters analysed on donor availability, policy direction and formalisation rather than quantified share. The vehicle parc served is carried as a named reference series rising from approximately 48.0 million to 72.0 million vehicles, and formal factory remanufacturing is benchmarked separately rather than blended into the combined figure. Fifteen entities are profiled across remanufacturers, circular-economy programmes, distributors and used-parts specialists.