Market Snapshot
Key Takeaways
Market Overview & Analysis
Report Summary
Saudi Arabia auto financing connects household mobility with corporate and SME asset investment. The market covers the competitive roles of banks, SAMA-licensed finance companies and distributor-linked finance providers, focusing on vehicle finance lease, often described commercially as Ijarah or lease-to-own. Car loans, Murabaha and personal-finance-funded purchases are assessed as competing customer propositions rather than added to the finance-lease totals, because they are different products with different collateral positions and different regulatory treatment.
Three measurements answer different stakeholder questions and none substitutes for another. Gross outstanding stock indicates the size of the existing receivables book, at SAR 52.30 billion in 2025. Annual new financed amount indicates business written during the year, at SAR 15.58 billion. Active and new contract counts, at 650,000 and 184,200 respectively, describe servicing scale and acquisition activity. Combining these reveals whether expansion comes from more customers, larger tickets or longer-lived balances, and prevents a stock figure from being mistaken for annual revenue.
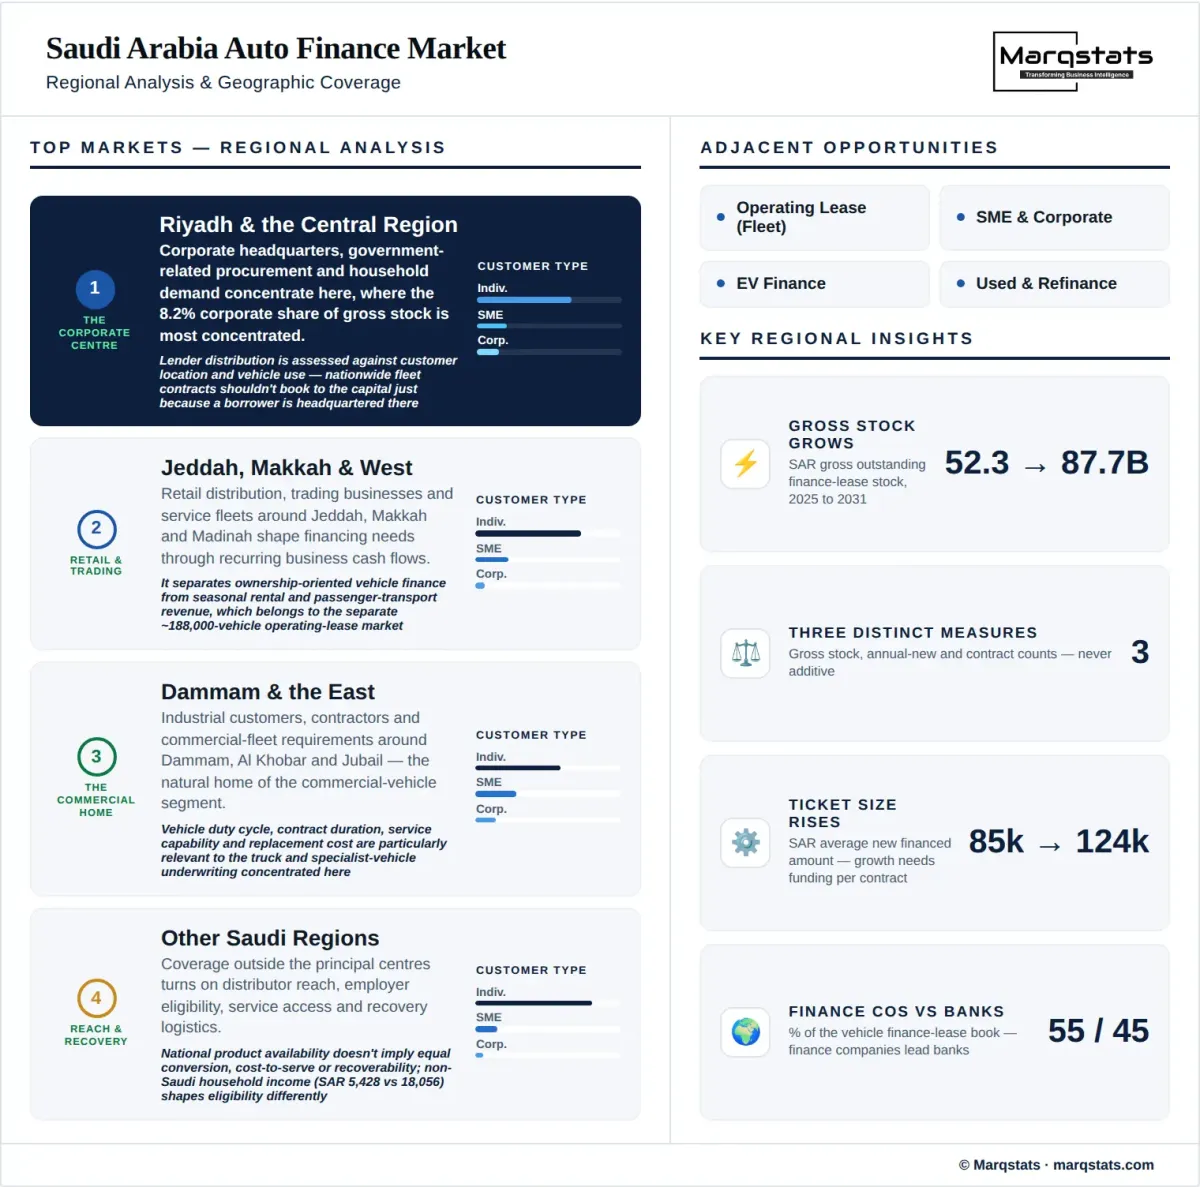
The Saudi Central Bank's finance-company statistics provide an external anchor for the base. Credit provided by licensed finance companies reached SAR 96.26 billion in 2024, up 13.6%, of which auto financing was SAR 25.16 billion or 26%, the second-largest category after personal finance. Against the 2024 finance-lease opening stock of SAR 45.90 billion carried here, finance companies therefore hold roughly 55% of the vehicle book and banks the remaining 45%. The two figures are consistent, and the split matters because the two provider groups fund, price and distribute differently.
For an OEM or distributor, the central question is how financing converts vehicle demand into completed sales without leaving excessive balloon or credit exposure. For a lender, it is how customer APR covers funding, expected credit losses, operating expense and capital. For an investor, it is whether a licensed platform, dealer partnership or greenfield finance company provides the strongest route to a sustainable book in a sector where 65 finance companies now hold licences.
Saudi Vehicle Finance Lease Market Size and Forecast
The historical series shows why a straight-line sales narrative is inadequate. Annual new contracts fell from 137,100 in 2021 to 130,200 in 2022 before rising to 164,600 in 2023 and 183,000 in 2024. The 2025 estimate of 184,200 indicates only 0.66% annual contract growth. New financed value nevertheless increased from SAR 14.86 billion in 2024 to SAR 15.58 billion in 2025, or 4.85%, as the implied average ticket rose. Gross stock grew from SAR 31.80 billion in 2021 to SAR 52.30 billion in 2025, a 13.24% compound rate that the forecast does not assume will persist.
The forecast retains the distinction between flow and stock. Annual new financed value reaches SAR 16.94 billion in 2026, SAR 21.78 billion in 2028, SAR 26.15 billion in 2030 and SAR 28.66 billion in 2031. Corresponding new contract counts are 192,100, 217,600, 226,400 and 230,900. Gross stock reaches SAR 58.00 billion, SAR 70.10 billion, SAR 81.40 billion and SAR 87.70 billion at those dates. The five-year rate on gross stock from 2025 to 2030 is 9.24%, marginally above the six-year 9.00% because the path decelerates slightly toward 2031. Annual originations and outstanding stock are related through repayments, settlements and other portfolio movements; they cannot be added together.
The contract forecast is built by customer and vehicle category rather than by applying a fixed financing penetration rate to national new-car sales. Annual finance-lease activity and annual new registrations are not interchangeable populations, particularly where used vehicles or refinanced facilities are involved. This matters for manufacturers evaluating finance-led sales conversion and for investors comparing the series with broader consumer-credit statistics, where the SAMA finance-company figure of SAR 25.16 billion covers only one of the two provider groups.
Car Finance Affordability and Balloon Payments
The estimation framework places the 2025 weighted new-vehicle price at SAR 134,300 across the represented vehicle mix. GASTAT's 2023 survey reports average monthly household disposable income of SAR 11,839 nationally, SAR 18,056 for Saudi households and SAR 5,428 for non-Saudi households. These figures describe household purchasing capacity in aggregate; individual credit approval requires the applicant's own verified income and obligations.
Under SAMA's responsible-lending framework, salary-linked monthly obligations are capped at 33.33% for employees and 25% for retirees. An employee earning SAR 6,000 therefore has an approximately SAR 2,000 salary-linked ceiling before existing obligations and the affordability assessment. Unequal instalments, including a balloon, are evaluated on an average-monthly basis, so advertised instalments alone do not establish approval capacity.
A simple cash-flow example explains the commercial effect. Moving SAR 10,000 of principal from 60 regular instalments into the final payment reduces the principal component of the monthly instalment by SAR 166.67 before financing charges. It also leaves SAR 10,000 more to be settled at maturity. The trade-off is between near-term affordability and future settlement exposure, not a reduction in vehicle cost.
A contractual balloon is distinct from a guaranteed resale value. Underwriting must assess whether the borrower can settle or refinance the balance and whether disposal proceeds cover it after condition, mileage and selling costs. Trade-in and replacement pathways also overlap, so maturity outcomes require a consistent definition before portfolio percentages are compared across lenders.
Funding Costs and Lender Profitability
The customer APR contains more than a reference-rate spread. Finance-company borrowing costs include the applicable benchmark, lender margin, facility fees, commitment structure and security terms. Banks also incur funding and capital costs, even where deposits provide a different funding base. Subtracting SAIBOR from an advertised APR does not produce a lender's profit margin, and sector returns show why: finance-company net income rose 72.13% to SAR 2.86 billion in 2024 with return on assets moving from 2.59% to 4.13%, a swing driven by funding conditions and credit performance rather than by headline pricing.
Funding sensitivity is commercially significant at modest scale. A 100-basis-point increase on SAR 1 billion of fully repricing average debt adds SAR 10 million to annual funding expense before hedging, amortisation or repricing offsets. A 50-basis-point increase adds SAR 5 million. A new entrant therefore needs a funding plan matched to its asset duration and customer pricing, rather than a single policy-rate assumption.
Fixed-price customer contracts constrain the ability to pass through higher funding costs on the existing book. New-business pricing, facility tenor, hedging and the mix of fixed and floating borrowing determine the speed of adjustment. Dealer or manufacturer support must be analysed separately as an explicit subsidy, discount, guarantee or commercial arrangement; brand affiliation alone does not establish subsidised funding.
Market Dynamics
Key Drivers
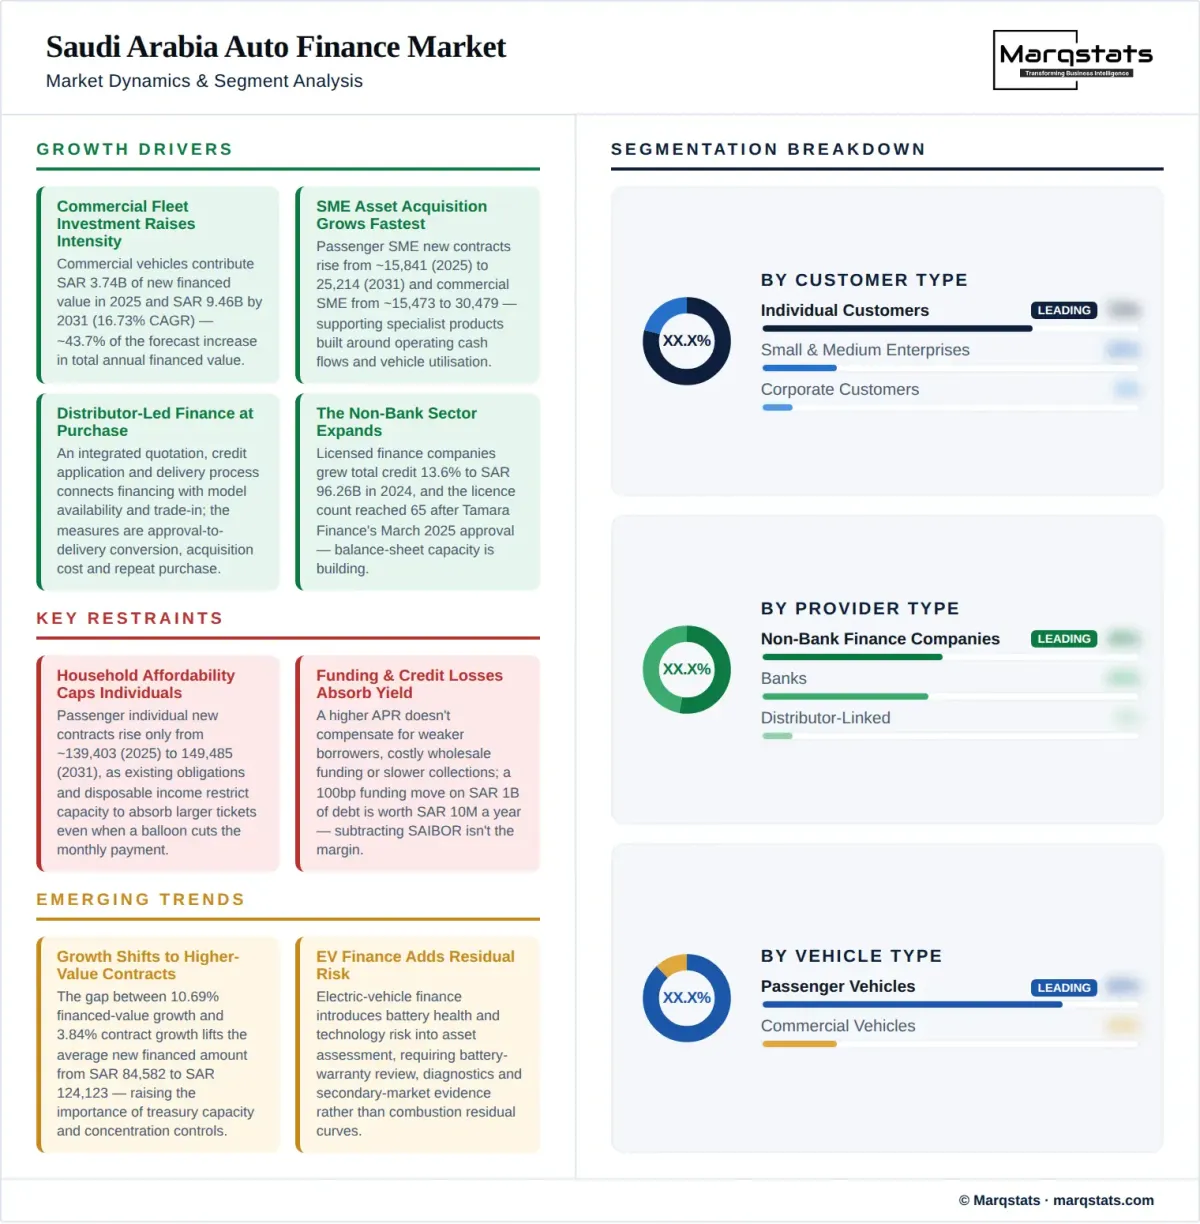
- Commercial fleet investment raises financing intensity, with commercial vehicles contributing SAR 3.74 billion of new financed value in 2025 and SAR 9.46 billion by 2031, a 16.73% CAGR that accounts for approximately 43.7% of the forecast increase in total annual financed value.
- SME asset acquisition creates a faster-growing customer opportunity, with passenger SME new contracts rising from approximately 15,841 in 2025 to 25,214 in 2031 and commercial SME new contracts increasing from approximately 15,473 to 30,479, supporting specialist products built around operating cash flows and vehicle utilisation.
- Distributor-led finance improves access to the customer at purchase, since an integrated quotation, credit application and delivery process connects financing with model availability and trade-in, and the relevant commercial measures are approval-to-delivery conversion, acquisition cost and repeat purchase rather than application volume alone.
- Fleet outsourcing creates an adjacent source of asset-finance demand, with the separate operating-lease market carrying approximately 188,000 active vehicles in 2025 and a forecast 356,927 in 2031, a business-to-business opportunity that cannot be added to finance-lease contracts without testing ownership and funding overlap.
- The non-bank sector is expanding its balance-sheet capacity, with licensed finance companies growing total credit 13.6% to SAR 96.26 billion in 2024 and the licence count reaching 65 after Tamara Finance's March 2025 approval.
Key Restraints
- Household affordability constrains individual contract growth, with the passenger individual forecast rising only from approximately 139,403 new contracts in 2025 to 149,485 in 2031, as existing obligations and disposable income restrict capacity to absorb larger tickets even when monthly payments are reduced through a balloon.
- Funding and credit losses absorb headline yield, since a higher APR does not necessarily compensate for weaker borrower quality, expensive wholesale funding or slower collections, and a 100-basis-point funding move on SAR 1 billion of debt is worth SAR 10 million a year.
- Residual-value uncertainty limits aggressive final-payment structures, because new nameplates and powertrains need model-specific resale evidence, service support and condition assessment, and a country-of-origin label alone is insufficient to set an appropriate balloon.
- Licence scope and capital requirements constrain entry options under the Finance Companies Control Law implementing regulation of 11 January 2026, since distribution, finance and operating leasing involve different activities and permissions, and acquisition of an existing platform does not remove the need to fund future receivables.
Key Trends
- Growth is shifting toward higher-value contracts, with the forecast gap between 10.69% annual financed-value growth and 3.84% contract growth lifting the average new financed amount from SAR 84,582 to SAR 124,123 and raising the importance of treasury capacity and concentration controls.
- Credit-bureau information is being combined with lender decisioning, with SIMAH credit records supporting assessment of existing facilities and repayment behaviour while lenders apply their own documented affordability methods under the 33.33% salary-linked ceiling.
- Dealer partnerships are extending beyond loan referrals to trade-in, remarketing and vehicle lifecycle support, with the economic benefit depending on how discount, residual risk, recovery costs and customer ownership are allocated across partners.
- Electric vehicle finance introduces battery health and technology risk into asset assessment, requiring battery-warranty review, diagnostics, repair support and secondary-market evidence rather than automatic use of combustion-vehicle residual curves.
Market Segmentation
Individuals account for an estimated SAR 37.45 billion, or 71.6%, of 2025 finance-lease gross stock. Their importance is larger by active contract count, at approximately 80.6%, reflecting smaller average balances than business accounts. Retail car finance remains the principal servicing and distribution business, but customer acquisition must be weighed against passenger individual new contracts growing at only 1.17% a year.
SMEs represent approximately SAR 10.56 billion, or 20.2%, of 2025 gross stock, with new contracts growing at 8.05% a year. Passenger and commercial needs differ: employee mobility and sales vehicles require different repayment structures from delivery vans or working trucks. SME shares are market allocations informed by provider segmentation rather than a claim that every lender applies an identical turnover or headcount threshold.
Corporate customers represent approximately SAR 4.29 billion, or 8.2%, of 2025 gross stock, with new contracts growing at 9.30% a year. Commercial-vehicle corporate new contracts rise from approximately 5,158 to 12,700 by 2031, a 16.20% CAGR. Concentrated fleet accounts increase origination efficiency but also require borrower-group exposure limits and detailed analysis of contract-backed revenues.
Passenger vehicles account for 572,000 active finance-lease contracts and SAR 41.84 billion in gross stock in 2025, representing 88.0% of active contracts and 80.0% of value. By 2031 the forecast reaches 724,590 contracts and SAR 64.90 billion, a 4.02% contract CAGR. Sedans and SUVs share the same broad retail financing channels, but price, insurance, resale liquidity and customer income alter product economics.
Commercial vehicles account for 78,000 active contracts and SAR 10.46 billion of gross stock in 2025. The 2031 forecast reaches 148,410 contracts and SAR 22.80 billion, an 11.32% contract CAGR, lifting commercial vehicles to 17.0% of active contracts and 26.0% of stock value. Their higher ticket size makes them more important to portfolio value than a unit-only market view suggests.
Banks hold roughly 45% of the vehicle finance-lease book, or about SAR 20.7 billion of the SAR 45.90 billion 2024 opening stock, competing through customer relationships, salary-linked distribution, balance-sheet capacity and dealer agreements. Their existing credit records and transaction histories complement bureau data. Vehicle-specific portfolios and product terms are assessed separately from total bank consumer finance, preserving the difference between a diversified bank's assets and its auto-finance exposure.
Licensed finance companies held SAR 25.16 billion of auto financing at end-2024, 26% of their SAR 96.26 billion total credit and roughly 55% of the vehicle finance-lease book. They compete through asset knowledge, distributor access, credit-policy differentiation and service responsiveness. Their strategic challenge is to turn channel strength into sufficient risk-adjusted yield after wholesale funding and collections costs, and 2024's rise in sector return on assets from 2.59% to 4.13% shows how much that yield moves with funding conditions.
Distributor-linked providers connect finance with inventory, vehicle pricing and repeat purchase, and Abdul Latif Jameel United Finance is the relevant benchmark for this model. Captive finance and partner-led distribution are assessed on their own economics without assuming that affiliation automatically creates cheap funds, preferential approvals or guaranteed residual values, since the SAR 134,300 weighted new-vehicle price must still be underwritten against the same 33.33% salary-linked ceiling.
New-car finance benefits from clearer invoice pricing and manufacturer warranties, and it anchors the SAR 134,300 weighted new-vehicle price in the 2025 estimation framework. New finance-lease contracts describe newly written financing agreements, not necessarily newly manufactured vehicles, so the 184,200 new contracts written in 2025 are not equated with new registrations when assessing penetration.
Used-car finance requires more intensive valuation, condition and remaining-useful-life assessment, and it is a material share of the 184,200 annual new contracts precisely because contracts and registrations are different populations. Refinanced facilities and used-vehicle purchases sit inside the finance-lease series and outside the new-registration series, which is why penetration cannot be read from either figure alone.
Established combustion vehicles provide longer operating and resale histories, which is what makes a balloon such as the SAR 10,000 deferral in the cash-flow example underwritable against a known secondary market. They remain the large majority of the 650,000 active contracts, and their residual curves are the benchmark against which every newer powertrain is assessed.
Hybrids and battery electric vehicles require additional review of battery condition, warranty transferability and specialist repair availability. For Tesla, BYD and other new entrants, product distribution and service support are assessed alongside funding access. Financing penetration and balloon percentages are not inferred from a brand's total sales share, and combustion residual curves are not applied automatically to an electrified asset: a SAR 10,000 deferral that is underwritable on a combustion vehicle with a known secondary market becomes an open residual position on an electrified vehicle with no resale history, even though the same 33.33% salary-linked ceiling and SAR 2,000 monthly capacity for a SAR 6,000 earner apply to both.
By Geography
Riyadh and the Central Region
The regional assessment examines corporate headquarters, government-related procurement and household demand around Riyadh, where the 8.2% corporate share of gross stock is most concentrated. Lender distribution is assessed against customer location and vehicle use rather than the booking office alone, avoiding the concentration of nationwide fleet contracts in the capital simply because a borrower is headquartered there.
Jeddah Makkah and the Western Region
The western-region assessment covers retail distribution, trading businesses and service fleets around Jeddah, Makkah and Madinah. It separates ownership-oriented vehicle finance from seasonal rental and passenger-transport revenue, the latter belonging to the separate operating-lease market of approximately 188,000 vehicles, while examining how dealer access and recurring business cash flows influence financing needs.
Dammam and the Eastern Region
The eastern-region assessment focuses on industrial customers, contractors and commercial fleet requirements around Dammam, Al Khobar and Jubail, the natural home of the commercial-vehicle segment growing from 78,000 to 148,410 active contracts. Vehicle duty cycle, contract duration, service capability and replacement costs are particularly relevant to truck and specialist-vehicle underwriting.
Other Saudi Regions
Coverage outside the principal centres examines distributor reach, employer eligibility, service access and recovery logistics. A lender's national product availability does not imply equal conversion, cost-to-serve or recoverability across every location, and the SAR 5,428 average disposable income of non-Saudi households against SAR 18,056 for Saudi households shapes eligibility differently across regions. Regional opportunity is evaluated through operating conditions rather than unsupported regional market shares.
How Competition Is Evolving
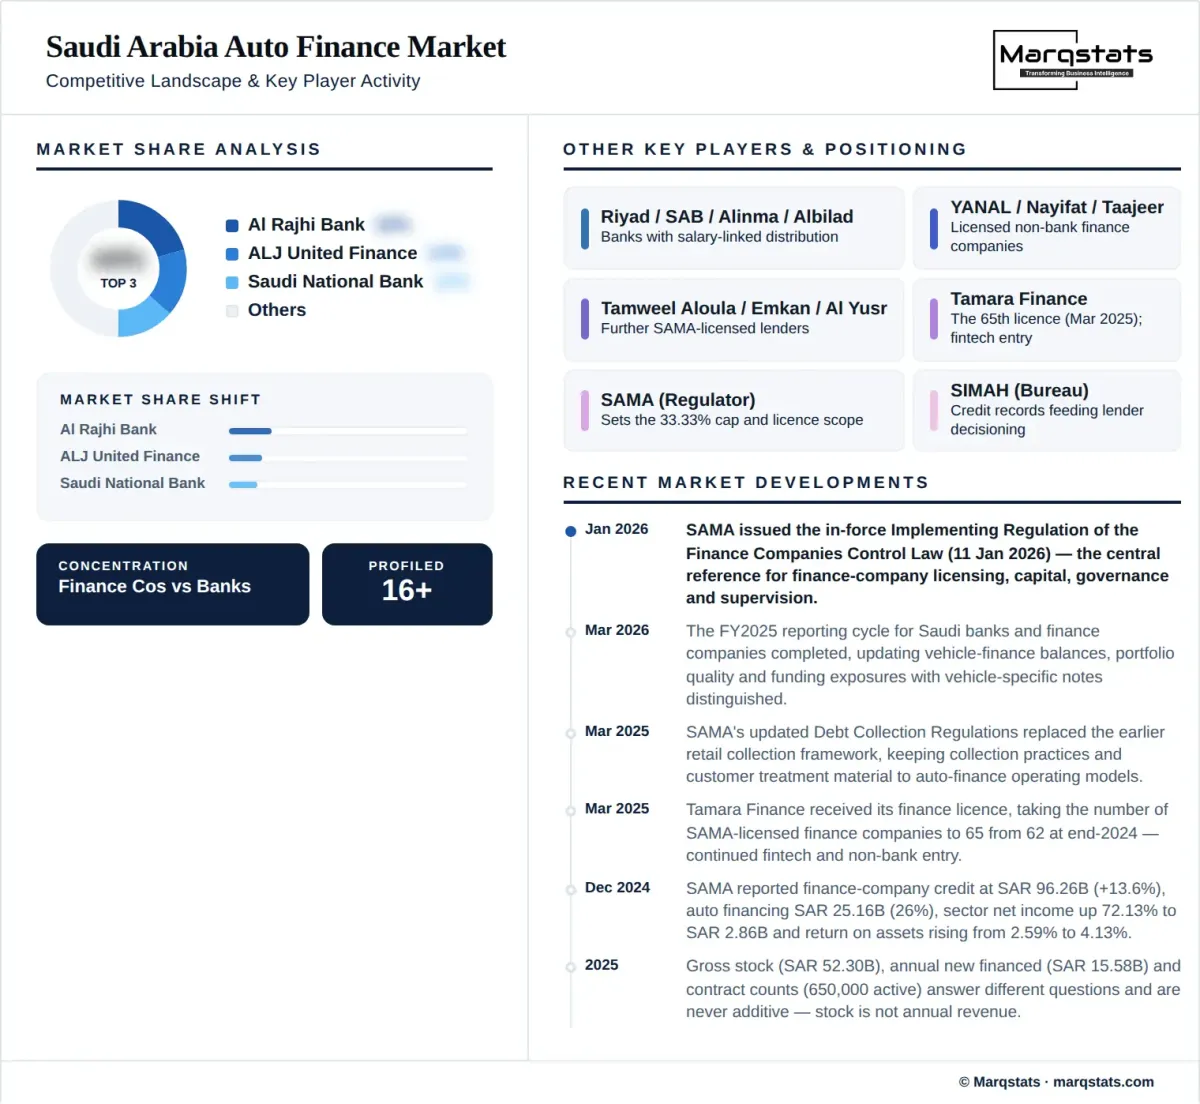
Saudi auto finance competition operates across funding, underwriting and distribution. Banks bring established customer relationships and balance-sheet scale, holding roughly 45% of the vehicle finance-lease book. The 65 licensed finance companies and distributor-linked providers bring asset expertise and purchase-point access, holding the remaining 55% at SAR 25.16 billion. A credible entrant needs an advantage in at least one of these areas and an operating model that does not surrender that advantage through higher acquisition, funding or loss costs.
Gross vehicle-finance balances are separated from net receivables and total finance-company assets throughout, and lender revenue is distinguished from annual principal advanced. These boundaries are important when evaluating market share, acquisition pricing and return on capital, particularly where a provider finances equipment or other assets alongside vehicles. The 2024 finance-company sector's SAR 2.86 billion net income sits against SAR 96.26 billion of credit across all categories, and auto finance's 26% share of that credit cannot be assumed to carry 26% of the profit.
A partnership with an experienced international lessor addresses systems, risk practices and asset-management capability, but the investment case must specify the actual contribution. Shareholder capital, committed funding, underwriting technology and manufacturer relationships are separate benefits with different contractual requirements. Greenfield, acquisition and minority-participation routes are evaluated against these requirements rather than treating all foreign partnerships as equivalent, and the January 2026 implementing regulation sets the licensing, capital and governance thresholds each route must clear.
Companies Covered
The report profiles 16+ companies with full strategy and financials analysis, including:
Recent Market Activity
Table of Contents
Coverage & Segmentation
The study covers Saudi Arabia with a 2025 base year, historical analysis from 2021 to 2025 and forecasts for 2026 to 2030, with 2031 carried as an indicative endpoint. Five-year CAGRs connect 2025 and 2030; six-year CAGRs connect 2025 and 2031 and are labelled as such wherever used. The quantified market series covers vehicle finance lease through banks and licensed finance companies, with gross outstanding stock, annual new financed amount, active contracts and new contracts carried separately.
Segmentation covers passenger and commercial vehicles, individuals, SMEs and corporate customers. Provider type, vehicle condition, powertrain, distribution, affordability, funding and regional operating conditions form complementary commercial analyses. Unsecured personal finance, other car-loan structures and operating lease are treated as adjacent alternatives and are not added to the finance-lease market totals. Cash purchases, short-term rental revenue and used-vehicle disposal revenue are excluded from the financed-value series.
The analysis addresses lender portfolio planning, OEM and distributor finance partnerships, fleet funding, investor due diligence and foreign-entry strategy. Stakeholder questions include where contract growth exceeds retail growth, how larger tickets change funding needs, how balloons affect maturity risk and how a licensed entrant can compete with established distribution networks.