Market Snapshot
Middle bar: base-year value × (1 + CAGR), rounded to two decimals. This is a calculated illustration, not a separately researched annual estimate.
The North America agricultural tire market is valued at USD 3,544.95 million in 2025 and is projected to reach USD 4,138.35 million by 2030, registering a CAGR of 3.14% over 2026–2030. The market covers new pneumatic tires for tractors, combines, sprayers, implements and farm trailers sold in the United States, Canada and Mexico, as original equipment (OE) and replacement. Marqstats estimates 4.65 million agricultural tires were supplied across the region in 2025, and replacement tires account for 87.68% of value as farm equipment sales fall for a second year.
Market size and forecast figures are generated using Marqstats' proprietary estimation framework, updated as of October 2026.
Coverage spans two sales channels, three equipment types, three tire constructions and three countries. The analysis benchmarks 16 tire makers, including Titan International, Inc., Bridgestone Corporation, Compagnie Générale des Établissements Michelin SCA, The Yokohama Rubber Co., Ltd. and Balkrishna Industries Limited, and tracks common fitment sizes such as 380/90R46 on row-crop tractors and sprayers, 710/70R42 on high-horsepower tractors, 800/70R38 on combines and 18.4-38 bias rear tires. Agricultural rubber tracks sit outside the market.
Key Takeaways
Market Overview & Analysis
Report Summary
The North America agricultural tire market comprises new pneumatic tires for farm tractors, combines, forage harvesters, cotton pickers, self-propelled sprayers, balers, planters, tillage implements and farm trailers, valued at USD 3,544.95 million in 2025 at manufacturer selling prices. The market spans bias, radial and IF and VF radial constructions across rim diameters from 12 to 54 inches. Agricultural rubber tracks, wheels sold without tires, retreads and used tires sit outside the market perimeter, as do construction, forestry and lawn and garden tires. Marqstats estimates 4.65 million tires were supplied in 2025, of which 3.37 million were replacement tires and 1.27 million were OE fitments. Replacement value is estimated at an average of USD 921.18 per tire in 2025, against USD 195.23 for imported tires at the border, since large radial tractor and combine tires carry prices of several thousand dollars.
Replacement demand follows the installed equipment base. The 2022 Census of Agriculture counts 3,784,743 tractors on US farms, including 1,252,844 tractors of 100 PTO horsepower or more, plus 298,301 self-propelled grain and bean combines, 55,496 forage harvesters and 16,153 cotton pickers. Canada's 2021 Census of Agriculture counts 659,337 tractors, including 52,953 above 249 horsepower. Tractors of 100 horsepower and above generate an estimated USD 2,103.47 million of 2025 value across two-wheel drive, front-wheel assist and four-wheel drive machines, since their large radial tires carry the highest prices.
OE demand is in a cyclical downturn. The Association of Equipment Manufacturers (AEM) reports US farm tractor sales of 195,857 units in 2025, down 9.9%, with four-wheel drive tractors down 41.6% to 2,543 and self-propelled combines down 35.6% to 3,579. US tractor sales fell a further 12.6% to 135,325 units in January to September 2026, and Marqstats projects OE tire value to fall to an estimated USD 393.47 million in 2026 before recovering to USD 522.64 million by 2030. The market value holds at USD 3,547.39 million in 2026 as replacement demand offsets the OE decline. Canadian sales held up better in 2025, with tractors down 1.0% to 23,246 and combines up 2.9% to 1,806, before Canadian combine sales fell 37.6% in September 2026.
Trade data shows a shift in import mix. US agricultural tire imports fell 23.6% from 2.613 million units in 2024 to 1.997 million in 2025, while customs value fell 11.7% to USD 389.8 million, raising the border value per tire 15.6% to USD 195.23. Imports equal about 53% of the 3.77 million tires supplied to the US market in 2025, and domestic plants operated by Titan International, Inc. and Bridgestone Americas, Inc. supply most large radial fitments. US truck tire demand is covered in the Marqstats US Commercial Truck Tire Market analysis.
Market Dynamics
Key Drivers
Five factors sustain agricultural tire demand in North America through a weak equipment cycle.
- Large installed equipment base. US farms operate 3,784,743 tractors and 298,301 combines, and Canadian farms operate 659,337 tractors. Replacement tires account for 87.68% of 2025 value, and replacement units rise from 3.37 million in 2025 to 3.45 million by 2030 as farmers keep machines longer. Older machines need tires regardless of new equipment sales, which stabilizes demand when OE orders fall. The 2022 census count of 3,784,743 tractors compares with 4,038,099 in 2017, so the base shrinks slowly while the average machine gets larger.
- Larger, heavier machines. Tractors of 100 horsepower and above account for 1,252,844 US machines, and Canada counts 52,953 tractors above 249 horsepower, 79.9% of them in the Prairie provinces. Larger machines run wider, higher-load tires such as 710/70R42 and 800/70R38 and often use dual fitments, which raises tire value per machine. Four-wheel drive tractors with eight tires generate an estimated USD 629.58 million of 2025 value. Dual fitments on four-wheel drive tractors and combines double the tire count on a single axle.
- Radial and VF adoption. Farmers move from bias to radial and IF and VF radial tires to cut soil compaction and carry heavier loads at lower pressure. Mitas promoted its HC1000 VF sprayer tire in February 2026 with up to 40% more load capacity and a 65 km/h speed rating. IF and VF radial tires grow at an 8.46% CAGR to 2030, against 3.14% for the market. Radial and VF tires carry higher prices per tire than the bias tires they replace, which lifts value even when unit demand is flat.
- Self-propelled sprayers and precision equipment. High-clearance sprayers run tall, narrow sizes such as 380/90R46 and 480/80R50 with high load ratings, and custom applicators run them for long seasons. Narrow row-crop tires with VF ratings protect crops and soil during repeated field passes. These fitments carry prices well above implement tires and lift value in the tractor and sprayer categories. Sprayer tires also face long road transfers between fields, which wears treads faster than field work alone.
- Cost-of-ownership selling. Tire makers sell agricultural tires on fuel, yield and downtime savings rather than unit price. Titan International, Inc. offered USD 200 off qualifying purchases of USD 1,000 or more at the Farm Progress Show in September 2026 and promoted a payback calculator for its Low Sidewall Technology (LSW) tires. Payback-based selling supports premium radial demand when farm budgets are tight. Payback tools help dealers sell premium tires when farm budgets are under pressure.
Key Restraints
Four constraints hold growth near 3% a year through 2030.
- Farm equipment downturn. US self-propelled combine sales fell 35.6% to 3,579 units in 2025, and four-wheel drive tractor sales fell 41.6% to 2,543. US tractor sales fell 16.4% and combine sales 10.9% in September 2026, while Canadian tractor sales fell 15.1% and combine sales 37.6% in the month. By class, 2025 US sales of two-wheel drive tractors under 40 horsepower fell 9.1%, those of 40 to 99 horsepower fell 4.0% and those of 100 horsepower and above fell 22.6%. OE tire units fall to an estimated 1.14 million in 2026. Equipment makers cut production to clear dealer inventory, which reduces OE tire orders further than retail sales alone.
- Tight farm budgets. Lower crop prices and high input costs lead farmers to repair tires, run worn treads longer and defer replacement. Titan's global agricultural segment sales fell 6.0% to USD 740.9 million in 2025, with gross margin down to 12.5% from 13.2% and operating income down to USD 27.5 million from USD 39.8 million. Repairs and tube fitments extend tire life on implements and older tractors, which delays replacement purchases.
- Track substitution. Rubber tracks replace tires on some high-horsepower tractors, combines and grain carts, and Michelin rebranded its Camso agricultural tracks as BIBTRACK from September 2026. Each machine fitted with tracks removes a set of large radial tires from replacement demand. Tracks remain outside the market and slow growth in the largest size classes. Tracks gain most where soil compaction and flotation matter, such as wet spring planting and late harvest.
- Low-cost imports. Bias and implement tires from India, Sri Lanka and China compete on price with domestic production. US imports carried a border value of USD 195.23 per tire in 2025, against an estimated average replacement value of USD 921.18 across all agricultural tires. Price competition holds bias tire value flat at an estimated USD 1,200.12 million by 2030. Imported bias tires gain share among small farms and hobby operations that buy mainly on price.
Key Trends
Four shifts are changing how agricultural tires are designed, produced and sold in North America.
- VF tires for sprayers and transport. Mitas showcased the HC1000 VF sprayer tire at Commodity Classic in February 2026, with up to 40% more load and 65 km/h road speed. Tire makers extend VF ratings to sprayers, grain carts and trailers that run on both fields and roads. VF tires carry more load at the same pressure or the same load at lower pressure. Equipment makers specify VF tires as factory options on new sprayers and grain carts.
- Broader bias ranges for small tractors. Alliance AgriNova covers 60 sizes and 111 SKUs from 12 to 42 inches in R-1 bias tires launched for 2026. Wide bias ranges serve utility tractors of 40 to 99 horsepower and older machines that still run sizes such as 12.4-24 and 18.4-38. Bias tires remain the low-cost option for small farms and livestock operations. Small tractor buyers also choose R-4 industrial tires for loader work around livestock operations.
- Production consolidation. Titan International, Inc. announced in March 2026 that it will close its Jackson, Tennessee facility at the end of October 2026, affecting about 140 employees, and move the work to other North American plants. Consolidation raises utilization at remaining plants and reduces fixed costs during the equipment downturn. Titan moves the Jackson work into existing plants rather than cutting product lines.
- Low sidewall and wide-footprint designs. Titan promotes LSW tires that pair larger rims with shorter sidewalls to widen the footprint and reduce sidewall flex. Wide-footprint and low-pressure designs target soil compaction and yield gains, and tire makers back these products with payback calculators for dealers and farmers. Low sidewall designs also improve stability on hillsides and at road speed.
Market Segmentation
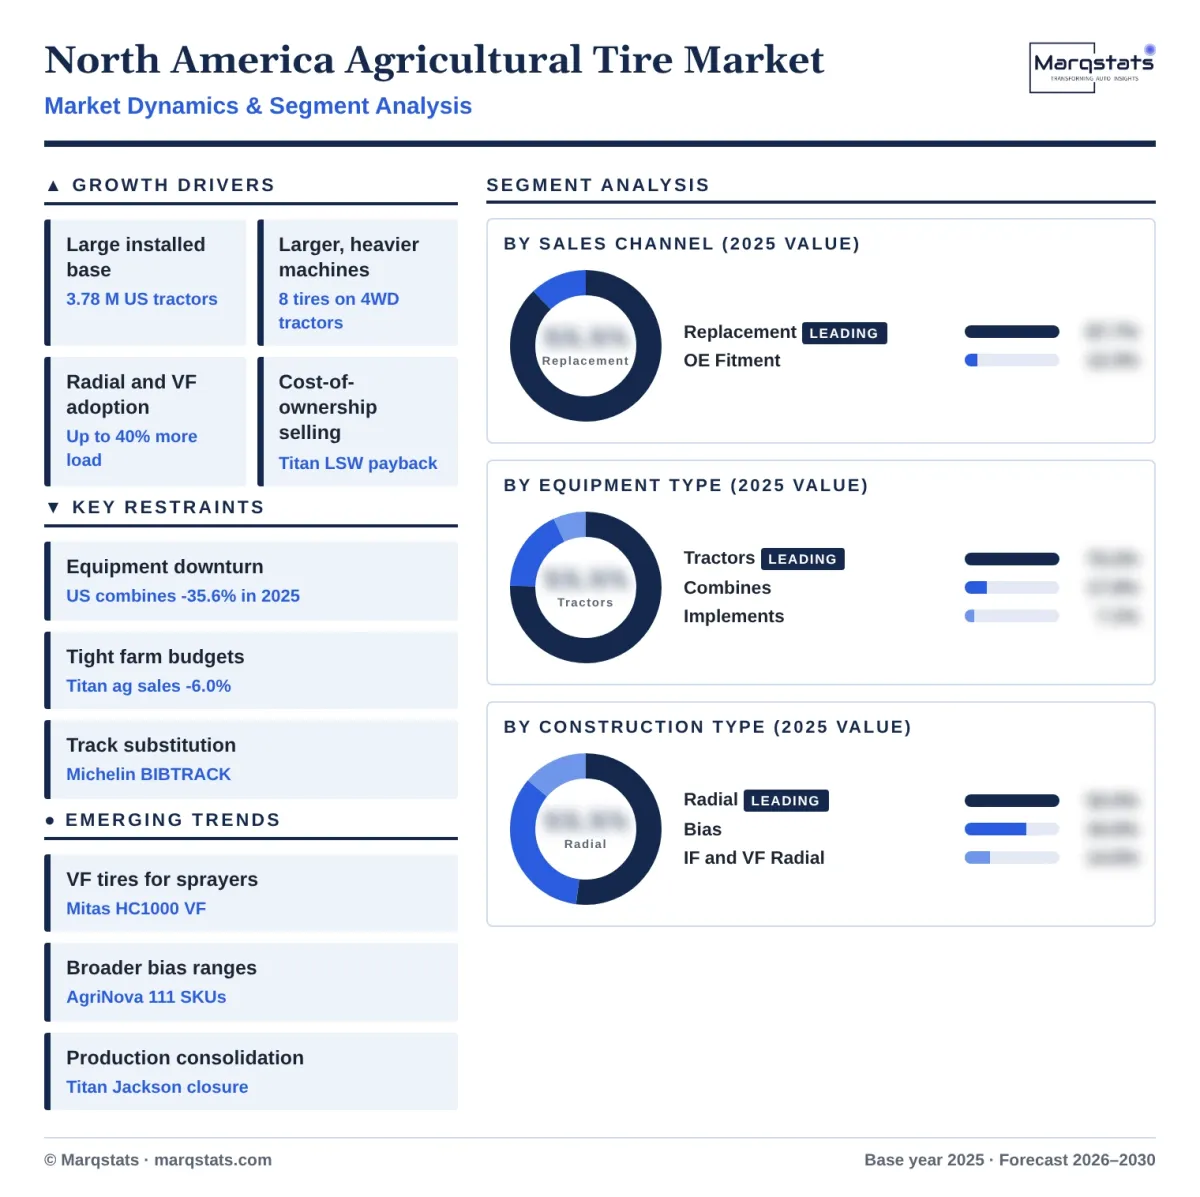
Replacement accounts for an estimated USD 3,108.36 million, or 87.68% of 2025 value, and is projected to reach USD 3,615.71 million by 2030 at a 3.07% CAGR. An estimated 3.37 million replacement tires were fitted in 2025 across the installed base of tractors, combines and implements, at an average value of USD 921.18 per tire. Farmers who defer new equipment purchases keep older machines running, which sustains tire replacement on high-hour tractors. Replacement value grows faster than replacement units, at 3.07% against about 0.5% a year, as farmers move to radial and IF and VF tires at the next change.
OE fitment accounts for an estimated USD 436.59 million, or 12.32% of 2025 value, and is projected to reach USD 522.64 million by 2030 at a 3.66% CAGR. OE units fall from 1.27 million in 2025 to an estimated 1.14 million in 2026 as US tractor sales fall 12.6% in the first nine months of 2026, before recovering to 1.34 million by 2030. OE prices run at an estimated 75% of replacement value under contracts with equipment makers. OE value recovers faster than replacement after 2026 as equipment makers specify larger and VF-rated tires on new tractors, combines and sprayers.
Tractors account for an estimated USD 2,667.67 million, or 75.25% of 2025 value, and are projected to reach USD 3,114.69 million by 2030 at a 3.15% CAGR. Two-wheel drive and front-wheel assist tractors of 100 horsepower and above contribute USD 1,473.89 million, four-wheel drive tractors USD 629.58 million, tractors of 40 to 99 horsepower USD 433.36 million and tractors under 40 horsepower USD 130.85 million. Common rear sizes include 710/70R42, 480/80R46 and 18.4-38. Tractors of 100 horsepower and above account for 78.85% of tractor tire value, since their rear tires cost several times more than tires on utility tractors.
Combines and harvesters account for an estimated USD 624.84 million, or 17.63% of 2025 value, and are projected to reach USD 728.58 million by 2030 at a 3.12% CAGR. The category covers 298,301 grain and bean combines, 55,496 forage harvesters and 16,153 cotton pickers on US farms. Combine drive tires such as 800/70R38 and IF 900/60R32 carry the highest prices per tire in the market. Combine sales fell 35.6% in 2025, so replacement on the existing fleet carries the category until OE orders recover.
Sprayers, implements and trailers account for an estimated USD 252.44 million, or 7.12% of 2025 value, and are projected to reach USD 295.08 million by 2030 at a 3.17% CAGR. The category covers planters, balers, tillage tools, grain carts, wagons and pull-type sprayers, with high-volume implement sizes such as 11L-15 and 31x13.5-15. US farms operate 564,948 hay balers alone. Implement tires carry low prices per tire, so the category holds a small value share despite high unit volume.
Radial tires account for an estimated USD 1,843.38 million, or 52.00% of 2025 value, and are projected to reach USD 2,193.33 million by 2030 at a 3.54% CAGR. Standard radials dominate row-crop and high-horsepower tractor fitments, with sizes such as 380/90R46, 480/80R46 and 710/70R42. Share rises to 53.00% by 2030. Radial tires gain share mainly from bias tires on mid-size tractors as farmers upgrade at replacement.
Bias tires account for an estimated USD 1,205.28 million, or 34.00% of 2025 value, and decline slightly to USD 1,200.12 million by 2030, a CAGR of -0.09%. Bias tires serve tractors under 100 horsepower, older machines, implements and trailers, with R-1 sizes such as 12.4-24 and 18.4-38. Low-cost imports and the shift to radials cut bias share to 29.00% by 2030. Bias tires still hold the largest unit share in implements and small tractors, where price outweighs field performance.
IF and VF radial tires account for an estimated USD 496.29 million, or 14.00% of 2025 value, and are projected to reach USD 744.90 million by 2030 at an 8.46% CAGR, the fastest of any segment. Improved flexion (IF) tires carry 20% more load and very high flexion (VF) tires 40% more load than standard radials at the same pressure. Combines, sprayers and four-wheel drive tractors lead adoption, and share rises to 18.00% by 2030. Mitas, Michelin, Firestone and Titan all market VF tires for sprayers and high-horsepower tractors.
By Geography
United States
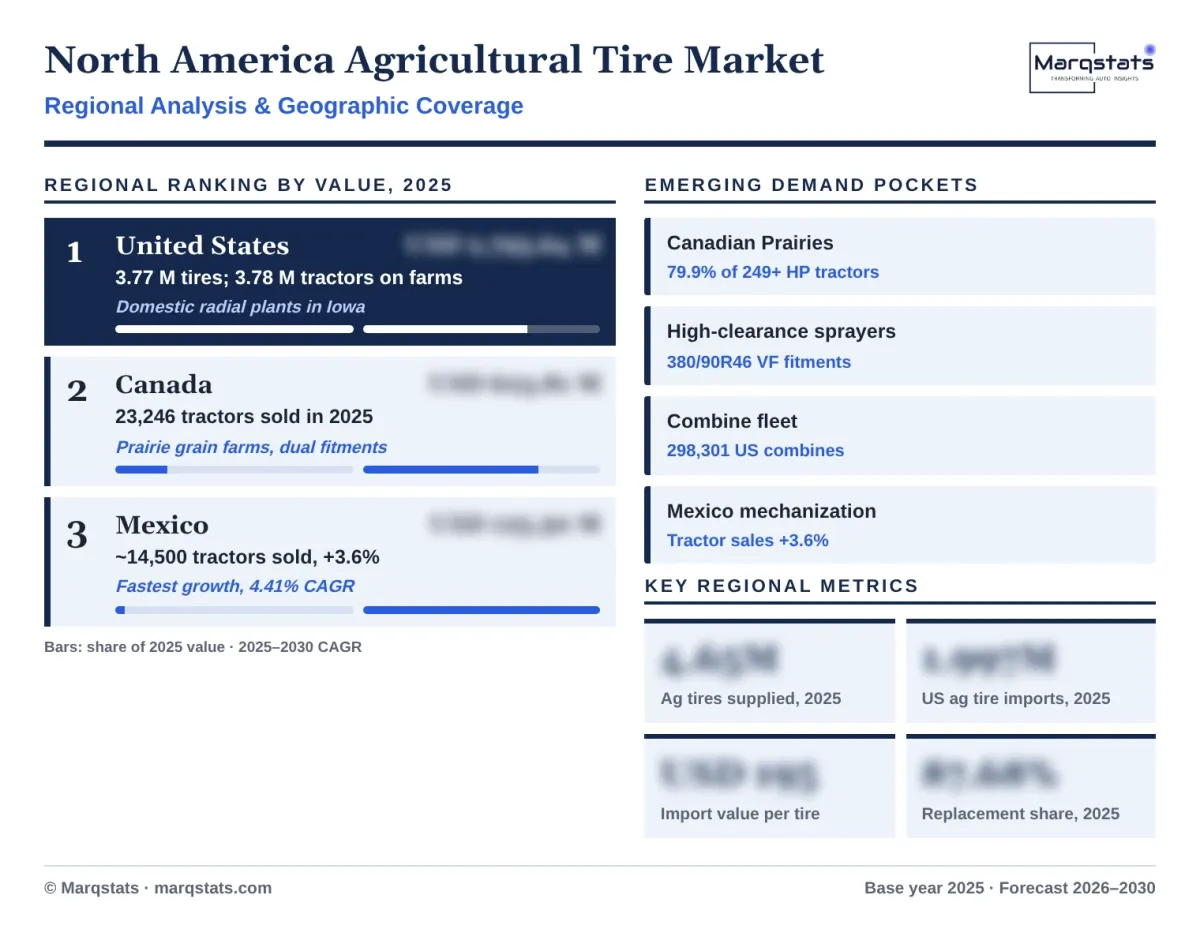
The United States is the largest market, accounting for 78.86% of 2025 value, or USD 2,795.64 million, rising to USD 3,249.45 million by 2030 at a 3.05% CAGR. An estimated 3.77 million tires were supplied in 2025, including 1.06 million OE fitments on 195,857 new tractors and 3,579 combines. The Corn Belt and Great Plains states hold most of the 1,252,844 tractors of 100 PTO horsepower or more, and domestic tire plants in Des Moines, Iowa serve both OE and replacement demand. US tractor sales fell a further 12.6% in January to September 2026, so OE demand stays weak through 2026 while replacement supports value.
Canada
Canada accounts for 17.60% of 2025 value, or USD 623.81 million, and is projected to reach USD 733.16 million by 2030 at a 3.28% CAGR. Tractor sales held steady at 23,246 units in 2025, down 1.0%, and combine sales rose 2.9% to 1,806, outperforming the United States. Large grain farms in Saskatchewan, Alberta and Manitoba run high-horsepower four-wheel drive tractors and combines on dual fitments, which lifts value per machine. Canadian combine sales fell 37.6% in September 2026, which signals weaker OE demand in 2026 after a stable 2025.
Mexico
Mexico accounts for 3.54% of 2025 value, or USD 125.50 million, and grows fastest at a 4.41% CAGR to USD 155.74 million by 2030. Tractor sales rose 3.6% to about 14,500 units in 2025, with mid-size tractors suited to smaller farms in the central and southern states. Large irrigated farms in Sinaloa, Sonora and Chihuahua run higher-horsepower tractors and combines on radial tires. Mexico imports most agricultural tires and grows from a low base as farm mechanization rises, with tire value per machine below US levels.
How Competition Is Evolving
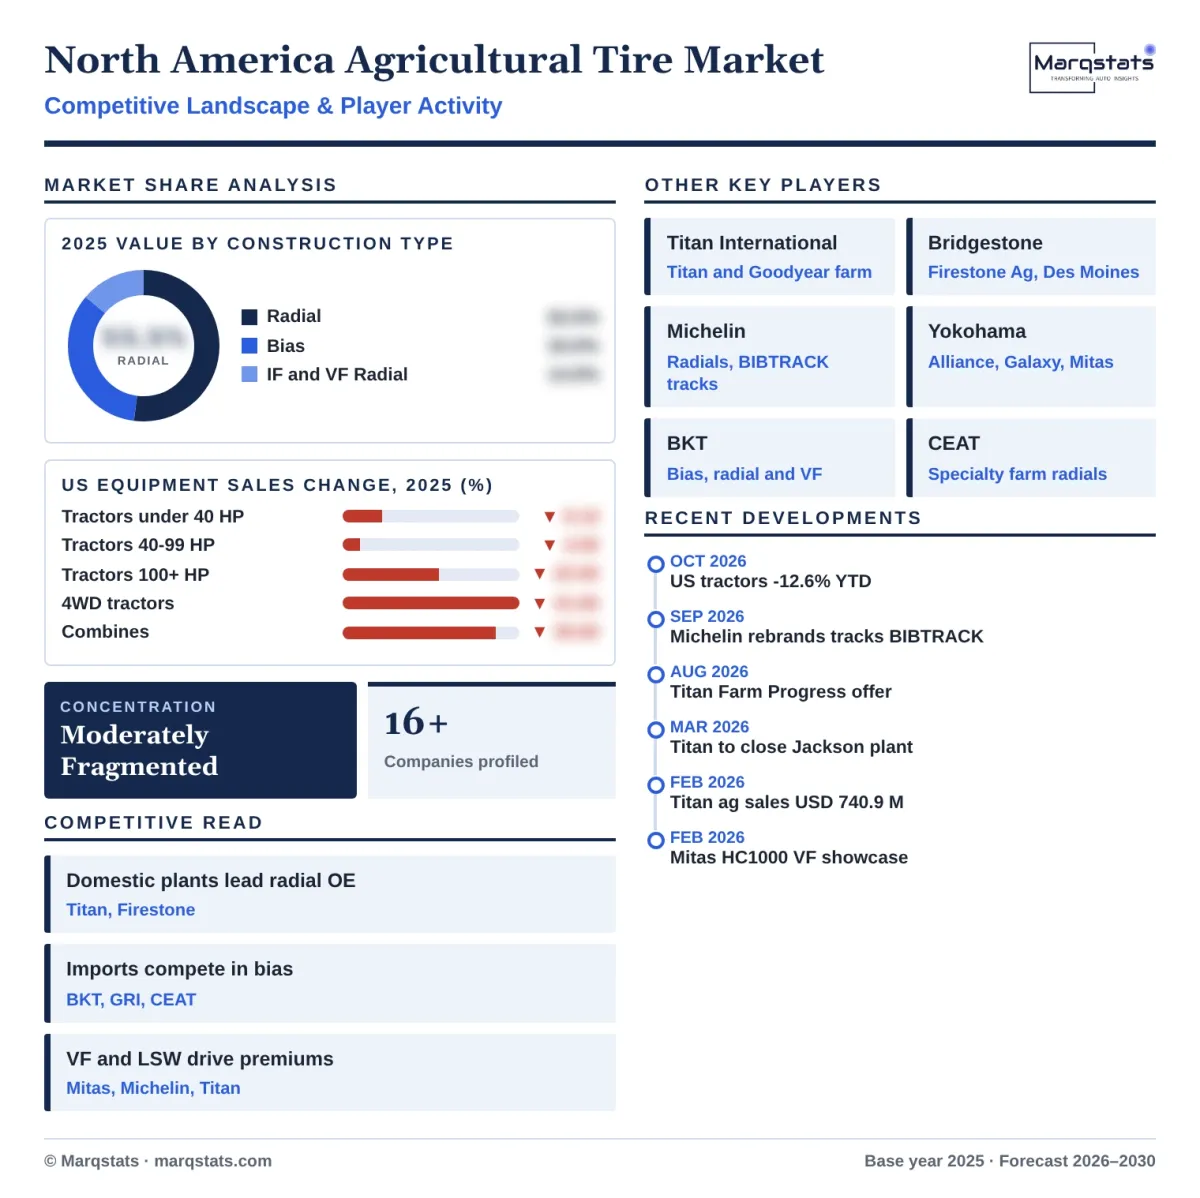
The North America agricultural tire market is moderately fragmented, with domestic producers supplying most large radial OE fitments and imported brands competing hard in bias and implement tires. Titan International, Inc. makes Titan and Goodyear-brand farm tires and wheels, Bridgestone Corporation supplies Firestone agricultural tires from its Des Moines, Iowa plant, and Compagnie Générale des Établissements Michelin SCA sells premium Michelin radials, including IF and VF ranges. The Yokohama Rubber Co., Ltd. owns the Alliance, Galaxy, Primex and Mitas brands through its off-highway and wheel system units. Continental AG, Nokian Tyres plc, Apollo Tyres Ltd. and Petlas Lastik Sanayi ve Ticaret A.Ş. serve the market through importers and dealers, while The Carlstar Group, LLC supplies implement and specialty tires.
Competition centers on IF and VF technology, OE approvals with equipment makers and dealer coverage. Titan sells LSW tires on a payback basis and reported 2025 agricultural segment sales of USD 740.9 million, down 6.0%, with a 12.5% gross margin. Balkrishna Industries Limited, CEAT Limited and Global Rubber Industries (Pvt) Ltd. compete in bias, radial and VF tires on price, application coverage and local stock, and Yokohama's Alliance AgriNova range covers 60 sizes and 111 SKUs. Equipment makers approve several tire suppliers per model, so OE share shifts with platform wins and dealer stocking rather than single long-term contracts.
Capacity and portfolio moves reshape supply during the downturn. Titan will close its Jackson, Tennessee facility at the end of October 2026 and move production to other North American plants, and Michelin rebranded its Camso agricultural tracks as BIBTRACK from September 2026, keeping its tire and track businesses side by side. Off-highway tire demand outside farming is covered in the Marqstats US Replacement Tire Market report.
Companies Covered
Companies covered in the report include:
Recent Market Activity
Table of Contents
Coverage & Segmentation
The North America agricultural tire market comprises new pneumatic tires for tractors, combines, harvesters, sprayers, implements and farm trailers sold in the United States, Canada and Mexico, valued at manufacturer selling prices in US dollars. The market excludes rubber tracks, wheels sold without tires, retreads, used tires, installation and service, and tires for construction, forestry and lawn and garden equipment. Coverage uses a 2025 base year, a 2021–2025 historical period and a 2026–2030 forecast period, with 2026 as the estimated year. The US tire aftermarket is covered in the Marqstats US Replacement Tire Market report.
Segmentation covers two sales channels, three equipment types, three tire constructions and three countries, with 16 tire makers profiled. OE units follow new machine sales by class and tires per machine, replacement units follow the installed equipment base by class, tire positions and annual replacement rates, and value applies class prices per tire, with fitment sizes such as 380/90R46, 710/70R42, 800/70R38 and 18.4-38 tracked as reference sizes. Tire dealer channels are covered in the Marqstats US Tire Dealer Market report.