Statistics & Highlights

Market Snapshot

Market size in Thousand Units
503K Units
2025
Base year
540K Units
2026
Estimated
  
728K Units
2030
Forecast
Largest market
Nigeria
Fastest growing
Electric (Fuel Type)
Dominant segment
Passenger Carrier
Concentration
Moderately Concentrated
CAGR
7.28%
2026 – 2030
GROWTH
+225K Units
Absolute
STUDY PARAMETERS
Base year2025
Historical period2021 – 2025
Forecast period2026 – 2030
Units consideredVolume (Thousand Units)
REPORT COVERAGE
Segments covered4
Regions covered5
Companies profiled16+
Report pages280+
DeliverablesPDF, Excel, PPT
Executive Summary

Key Takeaways

Africa three wheeler market recorded 503.07 thousand units in 2025, projected to reach 728.04 thousand units by 2030 at 7.28% CAGR.
Market value stood at USD 2249.97 million in 2025 and is forecast to reach USD 3499.10 million by 2030 at 8.83% CAGR.
Nigeria accounted for 34.80% of continental volume in 2025; its recovery from the 2024 currency crisis anchors regional growth at a 7.70% CAGR.
Passenger carriers held a 75.80% volume share in 2025, while load carriers grow faster at 10.00% CAGR on last-mile logistics demand.
CNG/LPG powertrains reached 33.00% of 2025 volume and expand at 9.74% CAGR, driven by Nigeria's one-million-vehicle gas conversion target.
Electric three wheelers are the fastest growing fuel segment at 28.12% CAGR, rising from 12.07 thousand units in 2025 to 42.95 thousand units by 2030.
Market Insights

Market Overview & Analysis

Report Summary

The Africa three wheeler market covers passenger-carrier and load-carrier three wheeled vehicles sold across the continent, spanning petrol, diesel, CNG/LPG, and electric powertrains. The study quantifies the market in volume (thousand units) and value (USD million) across 2021-2025 historical and 2026-2030 forecast horizons, with 2025 as the base year. Africa is a structurally import-dependent market: India supplies the overwhelming majority of new three wheelers, and continental demand is therefore tightly coupled to Indian export dispatches, ocean freight economics, and African foreign-exchange availability.

Demand contracted sharply in 2022 and stagnated through 2024 as the Nigerian naira devaluation and weak regional currencies compressed import affordability, with 2024 volumes at 457.71 thousand units, still below the 2019 level of 537.52 thousand units. A decisive recovery began in 2025 as currencies stabilized and Indian dispatches to Africa rebounded; India shipped 50,655 three wheeler export units in April 2026 alone, nearly double the prior-year month, according to SIAM production and export statistics, with exports absorbing roughly 47% of Indian three wheeler output. Marqstats reconciles continental demand against these dispatch flows, national registration records, and distributor channel checks to produce the volume series underlying this report.

Over the forecast period, growth is driven by urbanization, the deepening of gas-mobility programmes in West Africa, and electrification in East Africa. The market adds approximately 224.97 thousand annual units between 2025 and 2030, with value growth outpacing volume growth owing to powertrain mix enrichment toward CNG and electric variants that carry higher average selling prices.

Pricing structure varies by powertrain and market. Blended average selling prices sit near USD 4,470 per unit in 2025, with petrol passenger carriers landing at the lower end and factory CNG and electric variants commanding premiums that are recovered through fuel savings within six to twelve months of commercial operation. Retail affordability is the binding constraint in most markets: hire-purchase terms, aggregator schemes, and asset-financing platforms determine effective demand as much as sticker prices do, and currency movements transmit directly into showroom pricing given the import-dependent supply base.

Market Dynamics

Key Drivers

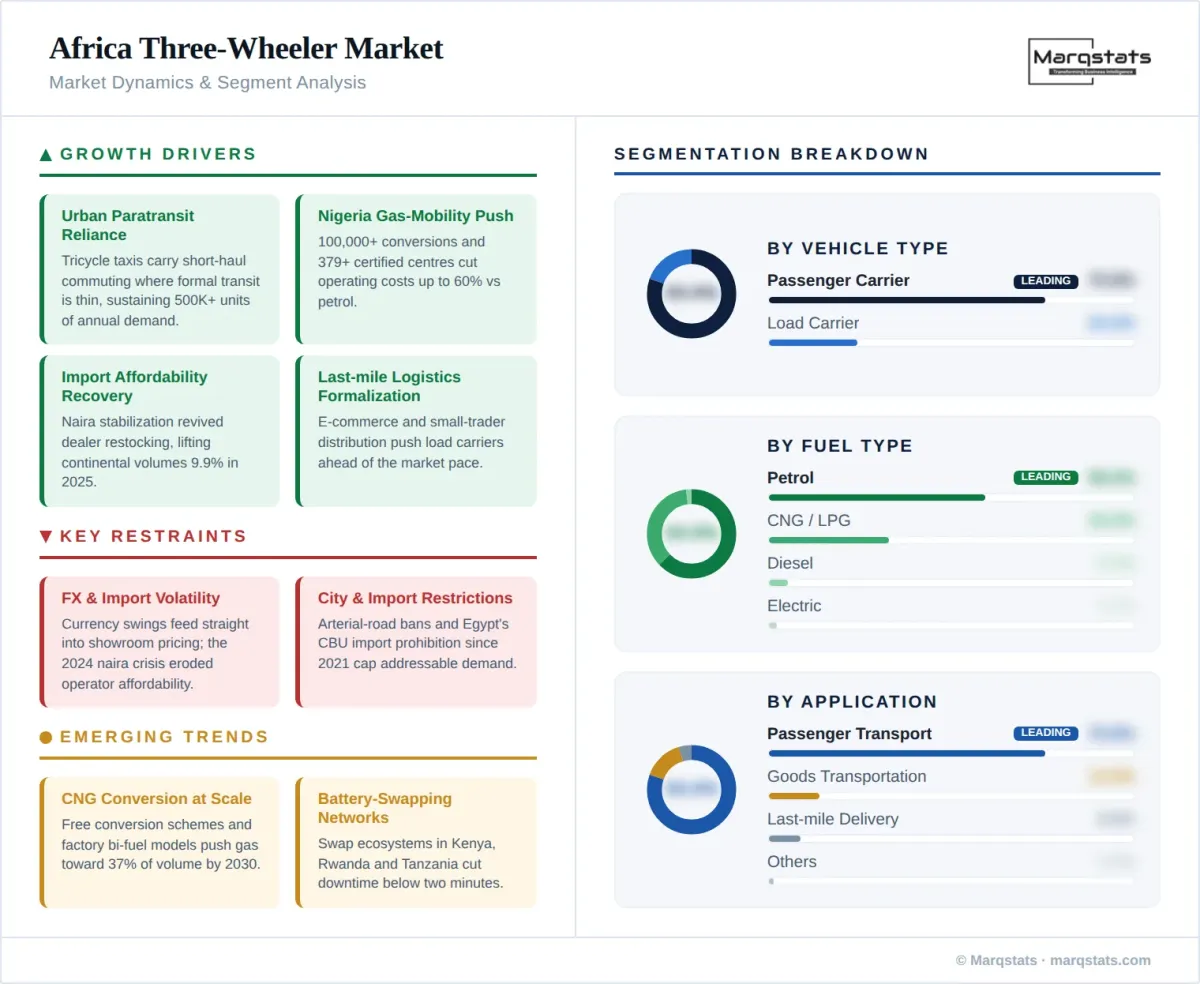
  • Urban paratransit dependence: with formal bus networks covering a fraction of trips in most African cities, tricycle taxis carry a large share of short-haul passenger movement, sustaining replacement and expansion demand of more than 500 thousand units annually.
  • Nigeria's gas-mobility programme: more than 100,000 vehicles have been converted and 5,123 CNG tricycles deployed under the Presidential CNG Initiative, with 379+ certified conversion centres across 22 states lowering operating costs by up to 60% versus petrol.
  • Recovery in import affordability: naira stabilization from late 2024 restored dealer restocking; Indian three wheeler exports to Africa recovered strongly through FY2026, lifting continental volumes 9.9% in 2025.
  • Last-mile logistics formalization: e-commerce and small-trader distribution push load-carrier demand at a 10.00% CAGR, ahead of the 7.28% market average.
  • Livelihood financing models: lease-to-own and aggregator schemes from distributors and fleet platforms reduce upfront capital barriers for owner-drivers, expanding the addressable buyer base.

Key Restraints

  • Foreign-exchange volatility: import-dependent supply exposes prices to currency swings; the 2024 naira crisis cut Nigerian volumes and pushed retail tricycle prices in Nigeria to roughly NGN 3.5 million, eroding operator affordability.
  • Regulatory restrictions in key cities: several jurisdictions restrict tricycle operation on arterial roads or ban them from central districts, and Egypt has prohibited fully built three wheeler imports since end-2021, capping addressable demand.
  • Financing gaps: high interest rates and thin credit histories limit formal lending to owner-drivers, keeping much of the fleet purchase activity in cash or informal hire-purchase channels.
  • Conflict-related disruption: the civil conflict in Sudan collapsed that market to 7.94 thousand units in 2025 from 15.91 thousand units in 2019, and insecurity weighs on demand in parts of the Sahel.

Key Trends

  • CNG conversion at scale: free conversion programmes and factory bi-fuel models such as the TVS King Deluxe CNG shift the installed base toward gas, with CNG/LPG projected to reach 37.00% of volume by 2030.
  • Battery-swapping ecosystems: swap networks in Kenya, Rwanda, and Tanzania cut refuelling downtime to under two minutes and de-risk battery ownership, accelerating electric tricycle adoption in East Africa.
  • Local assembly momentum: CKD and SKD assembly in Nigeria, Kenya, and Ethiopia deepens as governments tie import access to localization commitments, gradually shortening supply chains.
  • Fleet aggregation: professionally managed fleets grow at 8.19% CAGR as ride-hailing platforms and delivery operators consolidate what was historically an owner-driver market.
Africa Three Wheeler Market Market Dynamics Segment Analysis Infographic
Segment Analysis

Market Segmentation

Passenger Carrier
Leading

Passenger carriers accounted for 75.80% of 2025 volume at 381.33 thousand units and are projected to reach 529.28 thousand units by 2030 at a 6.34% CAGR. The segment is anchored in tricycle taxi operations across Nigerian, Kenyan, Ugandan, and Tanzanian cities, where three to four passenger configurations dominate short-haul commuting. Replacement cycles of five to seven years sustain a deep recurring demand base.

Load Carrier

Load carriers held 24.20% of 2025 volume at 121.74 thousand units and constitute the faster growing vehicle type at a 10.00% CAGR, reaching 198.76 thousand units by 2030. Demand is propelled by market-trader distribution, construction material movement, waste collection contracts, and the expansion of structured last-mile delivery networks in large cities.

Petrol
Leading

Petrol remained the largest fuel segment at 59.20% of 2025 volume, or 297.82 thousand units, yet grows slowest at a 5.00% CAGR as subsidy removal in Nigeria and elevated pump prices across the continent push operators toward gas and electric alternatives. Its share declines to 53.50% of volume by 2030.

Diesel

Diesel is a legacy niche at 5.40% of 2025 volume and contracts at a -1.18% CAGR through 2030, as emissions rules, higher fuel costs, and the withdrawal of diesel variants from exporter portfolios erode the segment.

CNG/LPG

CNG/LPG variants reached 33.00% of 2025 volume at 166.01 thousand units and expand at a 9.74% CAGR to 269.38 thousand units by 2030. Nigeria is the epicentre: the national programme targets one million gas vehicles by 2027, distributes tricycles to youth operators through aggregator schemes, and has commissioned 75 refuelling stations across 20 states. Factory bi-fuel models from Indian OEMs reinforce the shift.

Electric

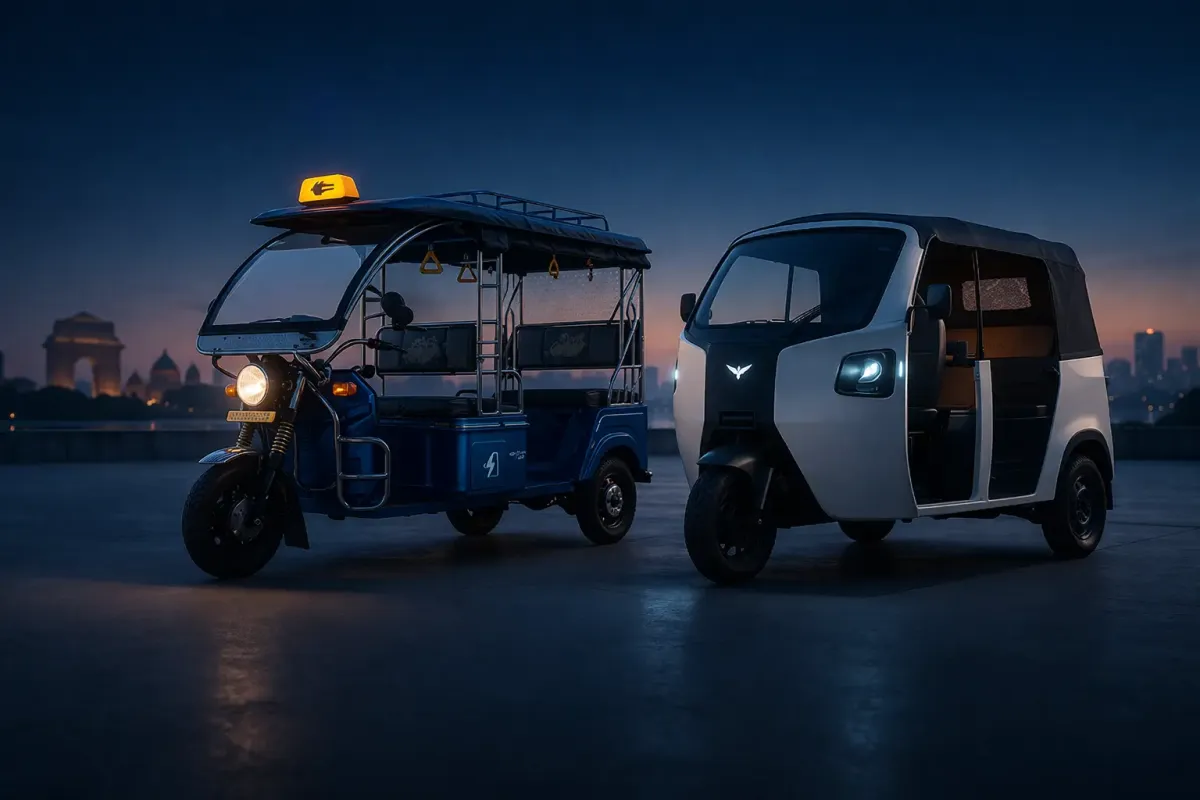
Electric three wheelers are the fastest growing segment, expanding from 12.07 thousand units in 2025 to 42.95 thousand units by 2030 at a 28.12% CAGR. Adoption concentrates in East Africa, where pilot deployments and policy frameworks coordinated through the UNEP Global Electric Mobility Programme span Kenya, Uganda, Rwanda, Ethiopia, and Tanzania, and where renewable-heavy grids make per-kilometre energy costs as much as 80% lower than petrol. Battery-swapping networks and lease-to-own schemes address range and financing barriers.

Passenger Transport
Leading

Passenger transport represented 75.80% of 2025 volume, mirroring the passenger-carrier vehicle base, and grows at a 6.34% CAGR. Tricycle taxis remain the most affordable motorized mode for 2-10 kilometre urban trips across the continent.

Last-mile Delivery/Logistics

Last-mile delivery is the fastest growing application at a 11.74% CAGR, rising from 44.31 thousand units in 2025 to 78.31 thousand units by 2030 as e-commerce platforms, food delivery services, and courier networks contract dedicated tricycle fleets.

Goods Transportation

General goods transportation accounted for 13.89% of 2025 volume at 69.88 thousand units, growing at a 9.02% CAGR on market-trader haulage, agricultural produce evacuation, and construction supply movement in secondary cities.

Others

Other applications, including municipal services, waste management, and mobile vending, held 1.50% of 2025 volume and grow at a 8.16% CAGR as city governments contract tricycles for sanitation and utility functions.

Individual Owner/Drivers
Leading

Individual owner-drivers purchased 65.00% of 2025 volume at 327.00 thousand units, growing at a 6.78% CAGR. Ownership remains the dominant livelihood model, typically financed through hire-purchase arrangements with distributors or savings groups.

Fleet Operators

Fleet operators accounted for 33.63% of 2025 volume and outpace the market at a 8.19% CAGR to 254.67 thousand units by 2030, as ride-hailing platforms, delivery aggregators, and asset-financing companies build professionally managed tricycle fleets with telematics and structured maintenance.

Government/Institutional Purchases

Government and institutional purchases held 1.37% of 2025 volume and grow at a 8.07% CAGR, reflecting empowerment-programme distributions such as Nigeria's youth tricycle schemes and municipal service procurement.

Regional Analysis

By Geography

Nigeria

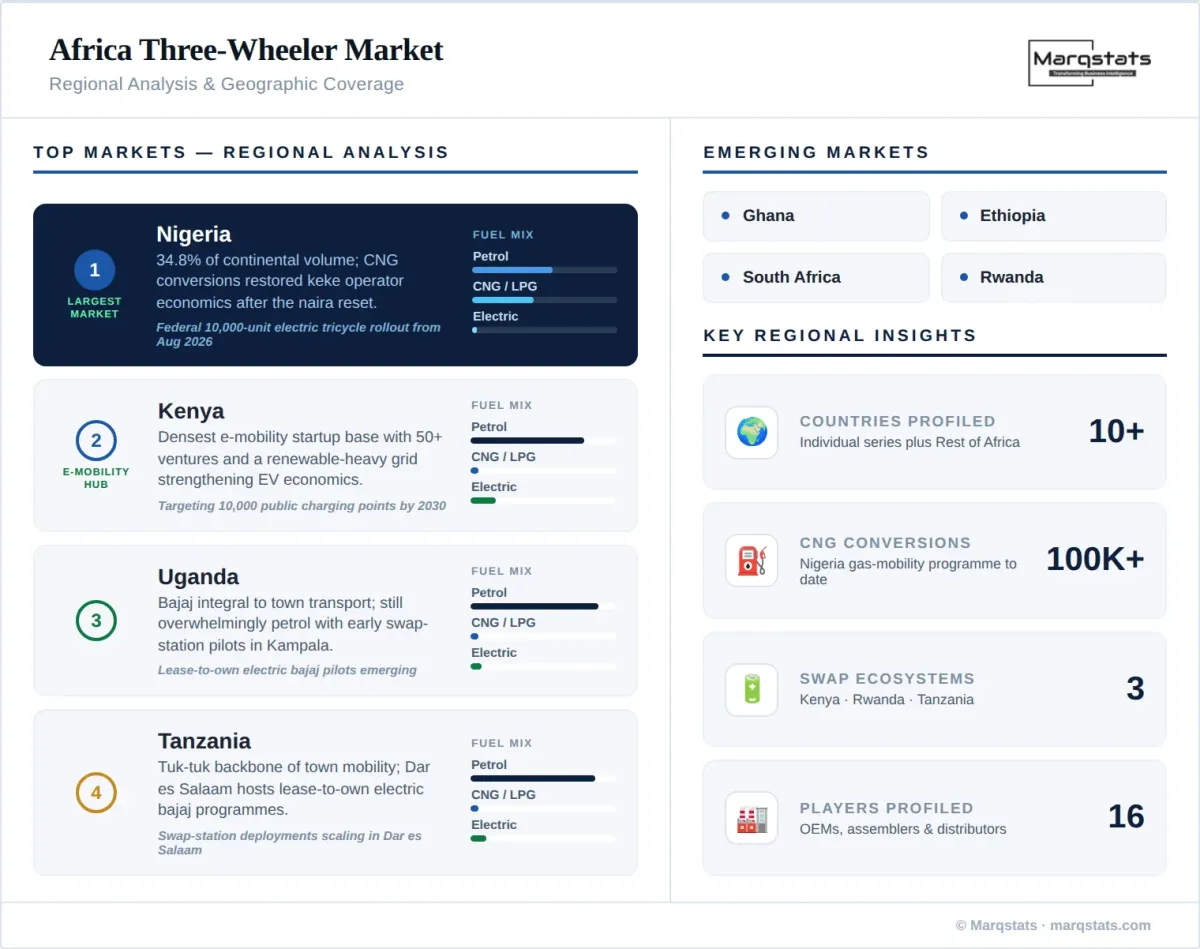
Nigeria is the anchor market with 175.07 thousand units in 2025, a 34.80% continental share, and USD 803.30 million in value. Volumes dipped in 2024 as naira depreciation compressed affordability, then rebounded as more than 100,000 vehicle conversions and free tricycle conversion schemes rolled out under the Presidential CNG Initiative restored operating economics for keke operators. The market grows at a 7.70% CAGR to 261.42 thousand units by 2030, with a federal rollout of 10,000 electric tricycles commencing from August 2026 adding an electrification layer.

East Africa

Kenya (48.51 thousand units, 7.40% CAGR), Uganda (41.08 thousand units, 7.00% CAGR), and Tanzania (35.51 thousand units, 7.00% CAGR) together held 24.87% of 2025 continental volume. The bajaj is integral to town transport across the region, and East Africa hosts the continent's most advanced electric tricycle ecosystems, with Kenya targeting 10,000 public charging points by 2030 under its National E-Mobility Policy and Dar es Salaam hosting lease-to-own electric bajaj programmes.

Kenya combines an established tricycle taxi culture in coastal and lakeside towns with the continent's densest e-mobility startup ecosystem, hosting more than 50 electric mobility ventures and a renewable-heavy grid that strengthens electric operating economics. Uganda and Tanzania remain overwhelmingly petrol markets today, yet both feature growing swap-station pilots and lease-to-own electric bajaj deployments in Kampala and Dar es Salaam, positioning the region for an accelerating powertrain transition in the second half of the forecast period.

West and Central Africa (excluding Nigeria)

Ghana (14.80 thousand units), Cameroon (10.86 thousand units), Guinea (5.65 thousand units), and Mali (7.71 thousand units) form a corridor of mid-sized markets growing at 6.4-7.3% CAGRs. Demand centres on load carriers for market-trader logistics and passenger operations in secondary cities, with imports routed through Tema, Douala, and Conakry. Ghana is the largest of the four and benefits from a stable import regime and an emerging domestic electric mobility scene, while Sahelian markets in Mali and Guinea depend on regional re-export corridors and remain price-sensitive cash markets in which Chinese cargo trikes compete strongly on landed cost.

Southern Africa

South Africa is a small yet fast-expanding market at 9.92 thousand units in 2025, growing at a 8.61% CAGR from a low base as tourism precincts, township delivery services, and campus mobility schemes adopt tricycles, including electric variants serving short-radius logistics.

Sudan and Rest of Africa

Sudan contracted to 7.94 thousand units in 2025 amid civil conflict and recovers gradually at a 8.87% CAGR from that suppressed base. The Rest of Africa grouping, at 146.02 thousand units and a 29.03% share, includes Ethiopia, where demand is rebounding alongside import policy shifts favouring electric vehicles, and Egypt, where the fully built three wheeler import prohibition since end-2021 redirects demand toward locally assembled units and quadricycle substitutes.
Africa Three Wheeler Market Regional Analysis Geographic Coverage Infographic
Competitive Landscape

How Competition Is Evolving

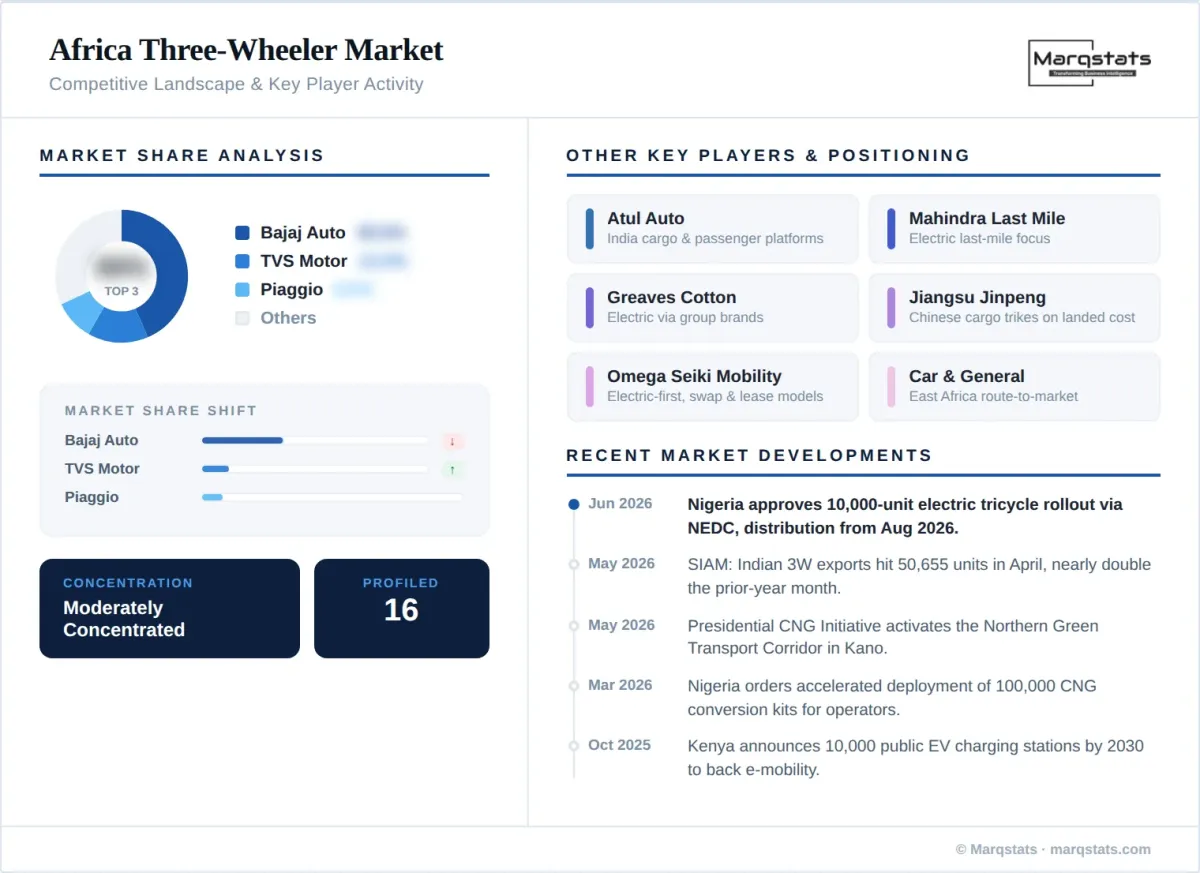
The market is moderately concentrated. Bajaj Auto Limited holds an estimated 35-36% share of continental volume, supported by a distributor-led model spanning more than 35 African countries, deep spare-parts penetration, and the brand equity of the RE and Maxima platforms; the bajaj name has become the generic term for tricycle taxis across East Africa. TVS Motor Company Limited and Piaggio & C. S.p.A. form the second tier, with TVS gaining ground in Nigeria through factory CNG variants and Piaggio's Ape franchise holding niches in North and East Africa.

Competition is intensifying on three fronts. Chinese manufacturers, including Jiangsu Jinpeng, Zongshen, Loncin, and Dayang, compete on landed cost in West and Central African cargo segments. Electric-first entrants and assemblers, among them Omega Seiki Mobility, TRI in Tanzania, and Qoray Mobility in Nigeria, pair vehicles with battery-swap or lease-to-own models. Distributors such as Car & General in East Africa control route-to-market and after-sales networks, giving incumbents a defensible service moat that new entrants must replicate or partner to access.

Strategic activity centres on powertrain localization and financing. OEMs are pairing with conversion-kit suppliers and gas distributors in Nigeria, while asset financiers and ride-hailing platforms aggregate fleet demand, shifting a share of purchasing power from individual operators toward institutional buyers with structured procurement criteria.

Barriers to entry are moderate on product and high on distribution. Homologation requirements are light in most markets, and CBU import is straightforward where permitted, yet profitable scale requires a spare-parts pipeline, trained mechanics, and financing partnerships built over years. This asymmetry explains why the share structure has remained stable despite repeated low-cost entry attempts, and why electric challengers are pursuing fleet and platform partnerships rather than open retail channels to reach operators.
Africa Three Wheeler Market Competitive Landscape Key Player Activity Infographic
Major Players

Companies Covered

The report profiles 16+ companies with full strategy and financials analysis, including:

Bajaj Auto Limited
TVS Motor Company Limited
Piaggio & C. S.p.A.
Atul Auto Limited
Mahindra Last Mile Mobility Limited
Greaves Cotton Limited
Jiangsu Jinpeng Group Co., Ltd.
Chongqing Zongshen Automobile Industry Co., Ltd.
Loncin Motor Co., Ltd.
Lifan Technology (Group) Co., Ltd.
Luoyang Dayang Trike Locomotive Co., Ltd.
Omega Seiki Mobility Private Limited
Car & General (Trading) Limited
Innoson Vehicle Manufacturing Co. Ltd.
TRI Tanzania Limited
Qoray Mobility Limited
Note: Full company profiles include revenue analysis, product portfolio, SWOT, and recent strategic developments.
Latest Developments

Recent Market Activity

Jun 2026
Nigeria approved a nationwide rollout of 10,000 electric tricycles through the North East Development Commission, with distribution commencing from August 2026 before replication through other regional development commissions.
May 2026
SIAM data showed Indian three wheeler exports of 50,655 units in April 2026, nearly double the prior-year month, with African demand recovery cited as a principal driver and exports absorbing roughly 47% of production.
May 2026
Nigeria's Presidential CNG Initiative activated the Northern Green Transport Corridor in Kano, extending certified conversion and refuelling infrastructure across northern commercial routes.
Mar 2026
Nigeria ordered the accelerated deployment of 100,000 CNG conversion kits targeting commercial transport operators, including tricycle owners, in response to elevated petrol prices.
Oct 2025
Kenya announced a plan to install 10,000 public EV charging stations by 2030, strengthening the infrastructure base for electric two and three wheeler adoption in East Africa.
Report Structure

Table of Contents

1. Introduction
1.1 Study Assumptions & Definitions
1.2 Research Scope
1.3 Market Definition — Passenger & Load Carrier Three-Wheelers
1.4 Currency, Units & Conversion Basis
1.5 Years Considered — Historical 2021–2025, Forecast 2026–2030
2. Research Methodology
2.1 Research Framework
2.2 Secondary Research — Export Dispatch, Registration & Port Data
2.3 Primary Research — 40+ Stakeholder Interviews
2.4 Market Estimation — Bottom-Up Volume Model
2.5 Data Triangulation & Validation
2.6 Reconciliation Notes — FX-Driven 2024 Reset & Sudan Re-Basing
2.7 Assumptions & Limitations
3. Executive Summary
3.1 Market Snapshot — Volume & Value
3.2 Key Findings by Segment
3.3 Key Findings by Country
3.4 CXO Perspective — An Import-Reliant Paratransit Market
3.5 Analyst Recommendations
4. Market Dynamics
4.1 Market Drivers
4.1.1 Urban Paratransit Dependence & Public Transport Gaps
4.1.2 Nigeria's Gas-Mobility Programme & Conversion Economics
4.1.3 Import Affordability Recovery & Currency Stabilization
4.1.4 Last-Mile Logistics Formalization
4.1.5 Livelihood Financing — Lease-to-Own & Aggregator Schemes
4.2 Market Restraints
4.2.1 Foreign-Exchange Volatility & Landed-Cost Pass-Through
4.2.2 Urban Operating Restrictions & Import Prohibitions
4.2.3 Financing Gaps for Owner-Drivers
4.2.4 Conflict-Related Disruption — Sudan & the Sahel
4.3 Market Trends
4.3.1 CNG Conversion at Scale & Factory Bi-Fuel Models
4.3.2 Battery-Swapping Ecosystems in East Africa
4.3.3 CKD/SKD Local Assembly Momentum
4.3.4 Fleet Aggregation & Platform Procurement
4.4 Market Opportunities
4.4.1 Electric Tricycle Deployment Programmes
4.4.2 Cargo Segment Premiumization
4.4.3 Government Empowerment Procurement
4.5 Industry Value Chain Analysis
4.6 Porter's Five Forces Analysis
4.6.1 Bargaining Power of Suppliers
4.6.2 Bargaining Power of Buyers
4.6.3 Threat of New Entrants
4.6.4 Threat of Substitutes
4.6.5 Intensity of Competitive Rivalry
5. Africa Three-Wheeler Market Size & Growth Analysis
5.1 Market Size in Volume, Thousand Units (2021–2030)
5.2 Market Size in Value, USD Million (2021–2030)
5.3 Volume vs Value Growth Decomposition
5.4 Average Selling Price Analysis by Powertrain
5.5 Growth — Absolute & CAGR Bridge (2026–2030)
6. Africa Three-Wheeler Market, By Vehicle Type
6.1 Segment Overview & Share Analysis (2025 vs 2030)
6.2 Passenger Carrier
6.2.1 Market Size in Volume, Thousand Units (2021–2030)
6.2.2 Market Size in Value, USD Million (2021–2030)
6.2.3 Tricycle Taxi Operating Models & Replacement Cycles
6.3 Load Carrier
6.3.1 Market Size in Volume, Thousand Units (2021–2030)
6.3.2 Market Size in Value, USD Million (2021–2030)
6.3.3 Cargo Configurations — Flatbed, Box Body, Tipper
7. Africa Three-Wheeler Market, By Fuel Type
7.1 Segment Overview & Share Analysis (2025 vs 2030)
7.2 Petrol
7.2.1 Market Size in Volume, Thousand Units (2021–2030)
7.2.2 Market Size in Value, USD Million (2021–2030)
7.2.3 Subsidy Removal Impact on Operating Economics
7.3 Diesel
7.3.1 Market Size in Volume, Thousand Units (2021–2030)
7.3.2 Market Size in Value, USD Million (2021–2030)
7.3.3 Legacy Fleet Contraction Drivers
7.4 CNG/LPG
7.4.1 Market Size in Volume, Thousand Units (2021–2030)
7.4.2 Market Size in Value, USD Million (2021–2030)
7.4.3 Conversion Kits vs Factory Bi-Fuel Models
7.4.4 Refuelling Network Coverage & Corridor Rollout
7.5 Electric
7.5.1 Market Size in Volume, Thousand Units (2021–2030)
7.5.2 Market Size in Value, USD Million (2021–2030)
7.5.3 Battery-Swapping vs Plug-In Charging Models
7.5.4 Total Cost of Ownership vs Petrol & CNG
8. Africa Three-Wheeler Market, By Application Type
8.1 Segment Overview & Share Analysis (2025 vs 2030)
8.2 Passenger Transport
8.2.1 Market Size in Volume, Thousand Units (2021–2030)
8.2.2 Market Size in Value, USD Million (2021–2030)
8.2.3 Urban & Peri-Urban Route Structures
8.3 Last-mile Delivery/Logistics
8.3.1 Market Size in Volume, Thousand Units (2021–2030)
8.3.2 Market Size in Value, USD Million (2021–2030)
8.3.3 E-Commerce & Quick-Commerce Fleet Contracts
8.4 Goods Transportation
8.4.1 Market Size in Volume, Thousand Units (2021–2030)
8.4.2 Market Size in Value, USD Million (2021–2030)
8.4.3 Market-Trader & Agricultural Haulage
8.5 Others (Municipal, Waste, Vending)
8.5.1 Market Size in Volume, Thousand Units (2021–2030)
8.5.2 Market Size in Value, USD Million (2021–2030)
8.5.3 Institutional Service Contracts
9. Africa Three-Wheeler Market, By End-User Ownership Model
9.1 Segment Overview & Share Analysis (2025 vs 2030)
9.2 Individual Owner/Drivers
9.2.1 Market Size in Volume, Thousand Units (2021–2030)
9.2.2 Market Size in Value, USD Million (2021–2030)
9.2.3 Hire-Purchase & Savings-Group Financing
9.3 Fleet Operators
9.3.1 Market Size in Volume, Thousand Units (2021–2030)
9.3.2 Market Size in Value, USD Million (2021–2030)
9.3.3 Ride-Hailing & Delivery Platform Fleets
9.3.4 Telematics & Managed Maintenance
9.4 Government/Institutional Purchases
9.4.1 Market Size in Volume, Thousand Units (2021–2030)
9.4.2 Market Size in Value, USD Million (2021–2030)
9.4.3 Empowerment Programme Distributions
10. Africa Three-Wheeler Market, By Country
10.1 Country Share Analysis — Volume & Value (2025 vs 2030)
10.2 Country Growth Matrix — CAGR vs Market Size
10.3 Import Corridors & Port Routing
11. Nigeria Three-Wheeler Market Deep Dive
11.1 Market Context — Keke Economy & FX Reset
11.1.1 Market Size in Volume, Thousand Units (2021–2030)
11.1.2 Market Size in Value, USD Million (2021–2030)
11.2 Presidential CNG Initiative — Conversion Centres, Refuelling Network & Tricycle Distribution
11.2.1 Conversion Economics — Petrol vs CNG Cost per Kilometre
11.2.1.1 Petrol Baseline — Post-Subsidy Cost Structure
11.2.1.2 CNG Cost Structure & Operator Payback Period
11.2.2 Northern Green Transport Corridor
11.2.2.1 Conversion Centre & Refuelling Station Coverage
11.2.2.2 Corridor Freight & Passenger Route Economics
11.3 Electric Tricycle Rollout — NEDC 10,000-Unit Programme
11.4 State-Level Regulatory Patchwork & Route Restrictions
11.5 Competitive Position — OEMs, Assemblers & Distributors
12. East Africa Three-Wheeler Markets
12.1 Kenya
12.1.1 Market Size in Volume, Thousand Units (2021–2030)
12.1.2 Market Size in Value, USD Million (2021–2030)
12.1.3 By Vehicle Type & Fuel Type
12.1.4 National E-Mobility Policy & Charging Network Targets
12.1.5 Coastal & Lakeside Tricycle Taxi Corridors
12.2 Uganda
12.2.1 Market Size in Volume, Thousand Units (2021–2030)
12.2.2 Market Size in Value, USD Million (2021–2030)
12.2.3 By Vehicle Type & Fuel Type
12.2.4 Kampala Paratransit Structure & Financing Channels
12.3 Tanzania
12.3.1 Market Size in Volume, Thousand Units (2021–2030)
12.3.2 Market Size in Value, USD Million (2021–2030)
12.3.3 By Vehicle Type & Fuel Type
12.3.4 Dar es Salaam Electric Bajaj Programmes & Lease-to-Own Models
13. West & Central Africa Three-Wheeler Markets
13.1 Ghana
13.1.1 Market Size in Volume, Thousand Units (2021–2030)
13.1.2 Market Size in Value, USD Million (2021–2030)
13.1.3 By Vehicle Type & Fuel Type
13.1.4 Tema Import Channel & Cargo Trike Demand
13.2 Cameroon
13.2.1 Market Size in Volume, Thousand Units (2021–2030)
13.2.2 Market Size in Value, USD Million (2021–2030)
13.2.3 By Vehicle Type & Fuel Type
13.2.4 Douala Corridor & Secondary-City Passenger Demand
13.3 Guinea
13.3.1 Market Size in Volume, Thousand Units (2021–2030)
13.3.2 Market Size in Value, USD Million (2021–2030)
13.3.3 By Vehicle Type & Fuel Type
13.3.4 Conakry Import Routing & Price-Band Structure
13.4 Mali
13.4.1 Market Size in Volume, Thousand Units (2021–2030)
13.4.2 Market Size in Value, USD Million (2021–2030)
13.4.3 By Vehicle Type & Fuel Type
13.4.4 Sahel Re-Export Corridors & Security Considerations
14. Southern Africa, Sudan & Rest of Africa
14.1 South Africa
14.1.1 Market Size in Volume, Thousand Units (2021–2030)
14.1.2 Market Size in Value, USD Million (2021–2030)
14.1.3 By Vehicle Type & Fuel Type
14.1.4 Tourism, Township Delivery & Campus Mobility Niches
14.2 Sudan
14.2.1 Market Size in Volume, Thousand Units (2021–2030)
14.2.2 Market Size in Value, USD Million (2021–2030)
14.2.3 By Vehicle Type & Fuel Type
14.2.4 Conflict Re-Basing & Recovery Path
14.3 Rest of Africa
14.3.1 Ethiopia — Import Policy Shift & Electric Substitution
14.3.2 Egypt — CBU Import Prohibition & Local Assembly Response
14.3.3 Other Markets — Volume & Value (2021–2030)
15. Policy & Regulatory Environment
15.1 National Gas-Mobility Programmes
15.1.1 Nigeria — Presidential CNG Initiative Structure & Milestones
15.1.2 Regional Replication — Egypt, Tanzania & Others
15.2 E-Mobility Policies, Duty Waivers & Tax Incentives
15.2.1 Kenya National E-Mobility Policy & Charging Targets
15.2.2 Rwanda EV Tax Waivers & Ethiopia Import Policy Shift
15.3 Import Regimes, Localization Requirements & Assembly Incentives
15.4 Urban Operating Regulations & Route Restrictions
15.5 Emissions & Safety Standards
16. Powertrain Transition Economics
16.1 Total Cost of Ownership — Petrol vs Diesel vs CNG vs Electric
16.1.1 Acquisition Cost & Financing Comparison
16.1.2 Running Cost per Kilometre by Powertrain
16.1.3 Payback Analysis for Commercial Operators
16.2 Conversion-Kit Supply Chain & Certification
16.3 Battery-Swapping Network Economics
16.4 Charging & Refuelling Infrastructure Coverage Mapping
16.5 Powertrain Mix Forecast Scenarios to 2030
17. Competitive Landscape
17.1 Market Share Analysis — Continental & Key Countries (2025)
17.2 Competitive Positioning Matrix
17.3 Distribution & After-Sales Network Benchmarking
17.4 Pricing & Financing Strategy Comparison
17.5 Strategic Developments — Launches, Partnerships & Localization (2024–2026)
18. Company Profiles
18.1 Bajaj Auto Limited
18.1.1 Company Overview & Africa Footprint
18.1.2 Product Portfolio — Three-Wheeler Platforms
18.1.3 Recent Developments & Strategy
18.2 TVS Motor Company Limited
18.2.1 Company Overview & Africa Footprint
18.2.2 Product Portfolio — Three-Wheeler Platforms
18.2.3 Recent Developments & Strategy
18.3 Piaggio & C. S.p.A.
18.3.1 Company Overview & Africa Footprint
18.3.2 Product Portfolio — Three-Wheeler Platforms
18.3.3 Recent Developments & Strategy
18.4 Atul Auto Limited
18.4.1 Company Overview & Africa Footprint
18.4.2 Product Portfolio — Three-Wheeler Platforms
18.4.3 Recent Developments & Strategy
18.5 Mahindra Last Mile Mobility Limited
18.5.1 Company Overview & Africa Footprint
18.5.2 Product Portfolio — Three-Wheeler Platforms
18.5.3 Recent Developments & Strategy
18.6 Greaves Cotton Limited
18.7 Jiangsu Jinpeng Group Co., Ltd.
18.8 Chongqing Zongshen Automobile Industry Co., Ltd.
18.9 Loncin Motor Co., Ltd.
18.10 Lifan Technology (Group) Co., Ltd.
18.11 Luoyang Dayang Trike Locomotive Co., Ltd.
18.12 Omega Seiki Mobility Private Limited
18.13 Car & General (Trading) Limited
18.14 Innoson Vehicle Manufacturing Co. Ltd.
18.15 TRI Tanzania Limited
18.16 Qoray Mobility Limited
19. Appendix
19.1 Abbreviations & Glossary
19.2 List of Tables
19.3 List of Figures
19.4 Sources & References
19.5 Customization Options
19.6 Disclaimer
Study Scope & Focus

Coverage & Segmentation

This report quantifies the Africa three wheeler market in volume (thousand units) and value (USD million) across a 2021-2025 historical period and a 2026-2030 forecast period, with 2025 as the base year. Segmentation covers vehicle type (passenger carrier, load carrier), fuel type (petrol, diesel, CNG/LPG, electric), application (passenger transport, last-mile delivery/logistics, goods transportation, others), end-user ownership model (individual owner/drivers, fleet operators, government/institutional purchases), and ten profiled countries plus Rest of Africa. The competitive assessment profiles 16 manufacturers and distributors. Demand patterns are assessed alongside adjacent segments, including trends documented in the Africa two wheeler market, whose import, financing, and electrification dynamics closely parallel the three wheeler segment.

The study evaluates policy programmes, powertrain transition economics, import and assembly flows, financing models, and competitive positioning to support procurement, market-entry, and portfolio decisions by OEMs, distributors, financiers, and development institutions. Forecasts incorporate announced policy commitments with published budgets or deployment schedules, exporter shipment guidance, and infrastructure rollout timelines; speculative programmes without funding commitments are excluded from the base case. Country series reflect structural adjustments where warranted, including the Sudan conflict re-basing and the Nigerian currency-driven demand reset of 2024.
Frequently Asked Questions

FAQs About the Africa Three-Wheeler Market

The Africa three-wheeler market recorded 503.07 thousand units in 2025 and is projected to reach 728.04 thousand units by 2030. In value terms, the market stood at USD 2,249.97 million in 2025, reaching USD 3,499.10 million by 2030.
The market expands at a 7.28% volume CAGR during 2026–2030, with value growing faster at 8.83% owing to powertrain mix enrichment toward CNG and electric variants.
Nigeria leads with 175.07 thousand units in 2025, a 34.80% share of continental volume, followed by Kenya (9.64%), Uganda (8.17%), and Tanzania (7.06%).
Passenger carriers dominate with 75.80% of 2025 volume (381.33 thousand units), while load carriers grow faster at a 10.00% CAGR on last-mile logistics demand.
Electric three-wheelers are the fastest growing fuel segment at a 28.12% CAGR, rising from 12.07 to 42.95 thousand units by 2030. CNG/LPG, at 33.00% of 2025 volume, expands at 9.74% on Nigeria's gas conversion programme.
Bajaj Auto Limited, TVS Motor Company Limited, Piaggio & C. S.p.A., Atul Auto Limited, Mahindra Last Mile Mobility Limited, Greaves Cotton Limited, Jiangsu Jinpeng Group Co., Ltd., Chongqing Zongshen Automobile Industry Co., Ltd., Loncin Motor Co., Ltd., Lifan Technology (Group) Co., Ltd., Luoyang Dayang Trike Locomotive Co., Ltd., Omega Seiki Mobility Private Limited, Car & General (Trading) Limited, Innoson Vehicle Manufacturing Co. Ltd., TRI Tanzania Limited, and Qoray Mobility Limited.
The report is delivered as a PDF (280+ pages), Excel data tables, and a PPT summary deck with analyst email support. Marqstats offers 20% complimentary customization on additional countries, segments, or data.