Market Snapshot
Key Takeaways
Market Overview & Analysis
Report Summary
Kenya's electric motorcycle market is not an environmental story and treating it as one produces the wrong forecast. It is a rider cash-flow story: a boda-boda operator earns daily, spends a large share of that on fuel, and will switch to any machine whose combined financing and energy cost lands below the fuel bill it replaces. Every structural feature of this market follows from that single arithmetic.
The measure is annual sales and registrations of battery-electric motorcycles and motorised two-wheelers in Kenya, across boda-boda passenger transport, last-mile delivery, private use and institutional fleets. Three-wheelers are excluded entirely. Both locally assembled and imported complete units are counted, because the buyer experiences them identically and the policy framework increasingly does not.
The analysis is written for manufacturers assessing entry into a market about to receive more than ten new competitors, financiers structuring asset finance against documented rider economics, energy and swap operators sizing charging demand the utility's own figures understate, and investors screening a segment where the vehicle is the least differentiated part of the offer. It treats financing structure and energy access, not product specification, as the variables that decide share.
Kenya Electric Two-Wheeler Market Size and Forecast
Electric two-wheeler sales are estimated at 18,500 units in 2025, rising to approximately 28,000 in 2026 and 85,000 by 2031, an increase of 66,500 units across the window. The model triangulates cumulative EV registrations of 39,324 at the end of 2025, total motorcycle registrations of 241,763 that year, ministry statements identifying boda-boda as the fastest-growing EV category, and disclosed financing and fleet programmes.
Two growth rates apply and both are published. The six-year rate connecting 2025 and 2031 is 28.94%. The five-year rate connecting 2026 and 2031 is 24.87%, and the 4.07-point gap reflects a 2026 step of roughly 9,500 units carried by the entrant wave and the mid-2026 fuel shock rather than by a change in the underlying adoption curve.
The forecast is better understood as a penetration requirement than as a growth rate. Kenya registered 241,763 motorcycles in 2025, more than double the prior year, of which 18,500 electric machines were 7.65%. Reaching 85,000 units requires 35.16% penetration if the total motorcycle market stays flat, or 21.25% if that market grows to 400,000 units a year, and the second is the more plausible path.
Stating the requirement that way exposes the real risk, which is not demand. Nothing in the rider economics argues against a fifth of new motorcycles being electric by 2031. The question is whether energy access and credit supply can be built at that rate, and those are the two constraints the rest of this analysis quantifies.
Market value moves from approximately USD 44.40 million to USD 170.00 million across the forecast, on a disclosed per-vehicle convention falling from about USD 2,400 to USD 2,000. Value compounds at 25.08% against 28.94% for units, and the inversion is deliberate: local assembly, falling battery costs and more than ten entrants preparing to compete all push per-unit prices down rather than up.
The Rider Arithmetic That Decides Everything
Two published daily figures settle this market's direction. A Kenyan boda-boda rider running on petrol spends roughly KES 1,000 a day on fuel; the same rider on an electric machine spends about KES 600 a day on charging or battery swaps, a 40% reduction in energy cost with no change in earnings.
The financing figure is the one that matters more. A financing programme launched with more than 600 electric motorcycles offered entry at a KES 25,000 deposit and KES 527 a day for 24 months, a package that includes the motorcycle, the battery, insurance and charging access, with ownership at the end of the term.
Set the two together and the result is decisive. The rider's total daily outlay under that package is 47.30% below the petrol bill alone that it replaces, a gap of KES 473 a day, and across 24 months the difference between KES 384,710 paid and KES 730,000 in fuel is KES 345,290 retained plus an owned asset. Almost no consumer durable in any market offers that proposition.
Sensitivity runs the right way too. Petrol reached KES 214.03 a litre in 2026 with diesel setting record highs, and fuel prices climbed more than 20% following conflict in the Middle East, after which electric motorcycle sales rose more than 40% in a matter of months. The switching case strengthens with every fuel price increase and weakens only if petrol falls materially, which no participant is planning for.
The commercial consequence is that this is a credit market wearing a vehicle market's clothes. A rider who cannot access a daily-payment structure cannot capture savings that are already large enough to fund the asset, which is why a lender rather than a manufacturer is currently the largest single channel into this market.
Financing Is the Channel, Not the Product
M-KOPA has financed more than 10,000 electric motorcycles in Kenya, a cumulative position equal to 54.05% of a single year's electric two-wheeler registrations. That is a financier holding origination scale comparable to the manufacturers whose product it moves, which is an unusual market structure and a durable one.
Pay-as-you-drive and daily-payment structures work here for a reason specific to the buyer. A boda-boda rider has daily revenue and no balance sheet, so a daily instalment matched against daily earnings is a better credit instrument than a monthly loan underwritten on documented income the rider does not have.
Local content feeds directly into the financing case rather than only into policy eligibility. Roam states that 36% of the components in its Air Gen 2 were locally manufactured under its 2025 financing programme, which reduces landed cost, shortens parts lead times and improves the collateral position on a machine a lender may need to recover and redeploy.
The strategic implication for an entrant is uncomfortable and worth stating plainly. A manufacturer arriving with a better motorcycle and no financing partner is competing against a package, not a product, and the ten-plus entrants preparing for this market in September 2026 will discover that the scarce capability is credit origination and collection rather than assembly.
Energy Demand Is Larger Than the Utility Reports
Kenya Power reported that EV charging consumed 8.43 million kWh in 2025, up 188.70% from 2.92 million kWh in 2024, with 205 customers on the e-mobility tariff. Those figures are usually cited as evidence of rapid growth, and they are, but they also understate actual demand by more than half.
The arithmetic is straightforward. A commercial boda-boda covering roughly 100 kilometres a day at about 35 watt-hours per kilometre across 300 working days needs approximately 1,050 kWh a year, so 8.43 million kWh supports about 8,029 full-time machines, against 18,500 electric two-wheelers registered in 2025 alone. The metered total therefore covers roughly 43.40% of what the 2025 cohort by itself requires.
The balance is not missing, it is unmetered as e-mobility. It sits on ordinary domestic and small commercial connections, in homes, shops and informal charging points that appear in Kenya Power's general load rather than under its e-mobility tariff, which 205 customers had joined against a cumulative EV parc of 39,324 vehicles, roughly one tariff account for every 191.82 electric vehicles.
That ratio tells its own story. The e-mobility tariff is a commercial instrument used by swap operators and charging hubs, not a rider instrument, so the utility's series measures the organised half of this market and misses the informal half entirely.
The consequence for anyone sizing grid or charging investment is direct. A forecast built on Kenya Power's reported e-mobility consumption will undershoot real electricity demand from electric two-wheelers by a factor of more than two, and the gap widens as the fleet grows faster than the organised swap network serving it.
Swap Networks Are Becoming the Competitive Asset
Battery swapping resolves the two objections riders actually raise, which are charging time and battery replacement cost, by separating the battery from the vehicle. A swap takes minutes against hours of charging, and it moves battery degradation risk from the rider's balance sheet to an operator equipped to manage it across a pool.
The networks are now being built at commercial scale and on existing fuel retail estate. ARC Ride and SUN Mobility launched 35 swap stations across Nairobi and Mombasa, partnering with a major fuel retailer's station network, using technology that more than 30 original equipment manufacturers use globally, which brings interoperability that a single-brand network cannot offer.
Density rather than count is what determines whether a network works. Thirty-five stations against 18,500 electric two-wheelers is roughly 528.57 machines per station nationally, though the stations are concentrated in two cities where the addressable fleet is a fraction of that, which is why swap coverage currently supports urban commercial riders and not rural or intercity use.
The strategic question for the market is whether swapping or ownership wins, and the answer is likely to be both in different segments. Delivery fleets and high-mileage urban riders favour swapping for uptime; owner-operators outside dense swap coverage favour owned batteries and overnight charging, and a manufacturer that supports only one model surrenders half the market.
Policy Is Enabling Rather Than Subsidising
Kenya launched a National Electric Mobility Policy in February 2026 covering manufacturing, charging, financing and adoption, positioned explicitly against a petroleum import bill of roughly USD 5 billion a year, equivalent to the KES 628.4 billion recorded in 2025. Green reflective number plates now distinguish fully electric vehicles, and fiscal and non-fiscal incentives remain under review in the 2026 implementation programme.
The import substitution case is real and smaller than the framing suggests, which is worth quantifying honestly. At roughly four litres a day across 300 working days and petrol at KES 214.03, the 2025 electric fleet displaces about KES 4.75 billion of fuel, or 0.76% of the national bill, rising to approximately KES 21.83 billion or 3.47% at 85,000 units in 2031.
A policy that delivers three and a half percent of the fuel import bill is not a macroeconomic solution, and presenting it as one invites disappointment. What it does deliver is a domestic industrial base, a large transfer of household spending away from imported fuel, and a grid load that Kenya is unusually well placed to serve given electricity supply that is around 93% renewable.
The absence of heavy purchase subsidy is a strength rather than a gap. This market already works on unsubsidised rider economics, which means adoption does not reverse when a fiscal incentive expires, and policy effort is better directed at charging standards, credit guarantees and local assembly eligibility than at price support.
A Crowded Field Is About to Get More Crowded
More than ten manufacturers were preparing to enter Kenya as of September 2026, spanning Chinese producers including Afrina Neopower, QJ-YY, Sprocomm, VMoto and Wylex, Indian producers including BGauss, Motovolt and Odysse, Piaggio from Italy and the local entrant Fika Mobility. Yadea, the largest electric two-wheeler manufacturer globally, has already entered through a partnership with ARC Ride.
That wave arrives into a market of roughly 18,500 annual units, which is small relative to the number of participants targeting it. Incumbents including Roam, Spiro, Ampersand, ARC Ride, eBee and Kibo hold distribution, financing relationships and swap infrastructure that a new entrant must either build or buy.
Price competition is therefore the near-certain outcome and it is built into this forecast rather than treated as a risk. The per-vehicle convention falls from approximately USD 2,400 to USD 2,000 across the window, which is why market value compounds 3.86 points behind unit volume and why revenue-based entry cases will look worse than volume-based ones.
Manufacturing scale is arriving alongside the entrants. Spiro's Nairobi facility is reported capable of producing hundreds of motorcycles a day, capacity well ahead of current national demand, and the same low-utilisation condition seen in other African assembly programmes applies here: the constraint is offtake, not capacity.
Market Dynamics
Key Drivers
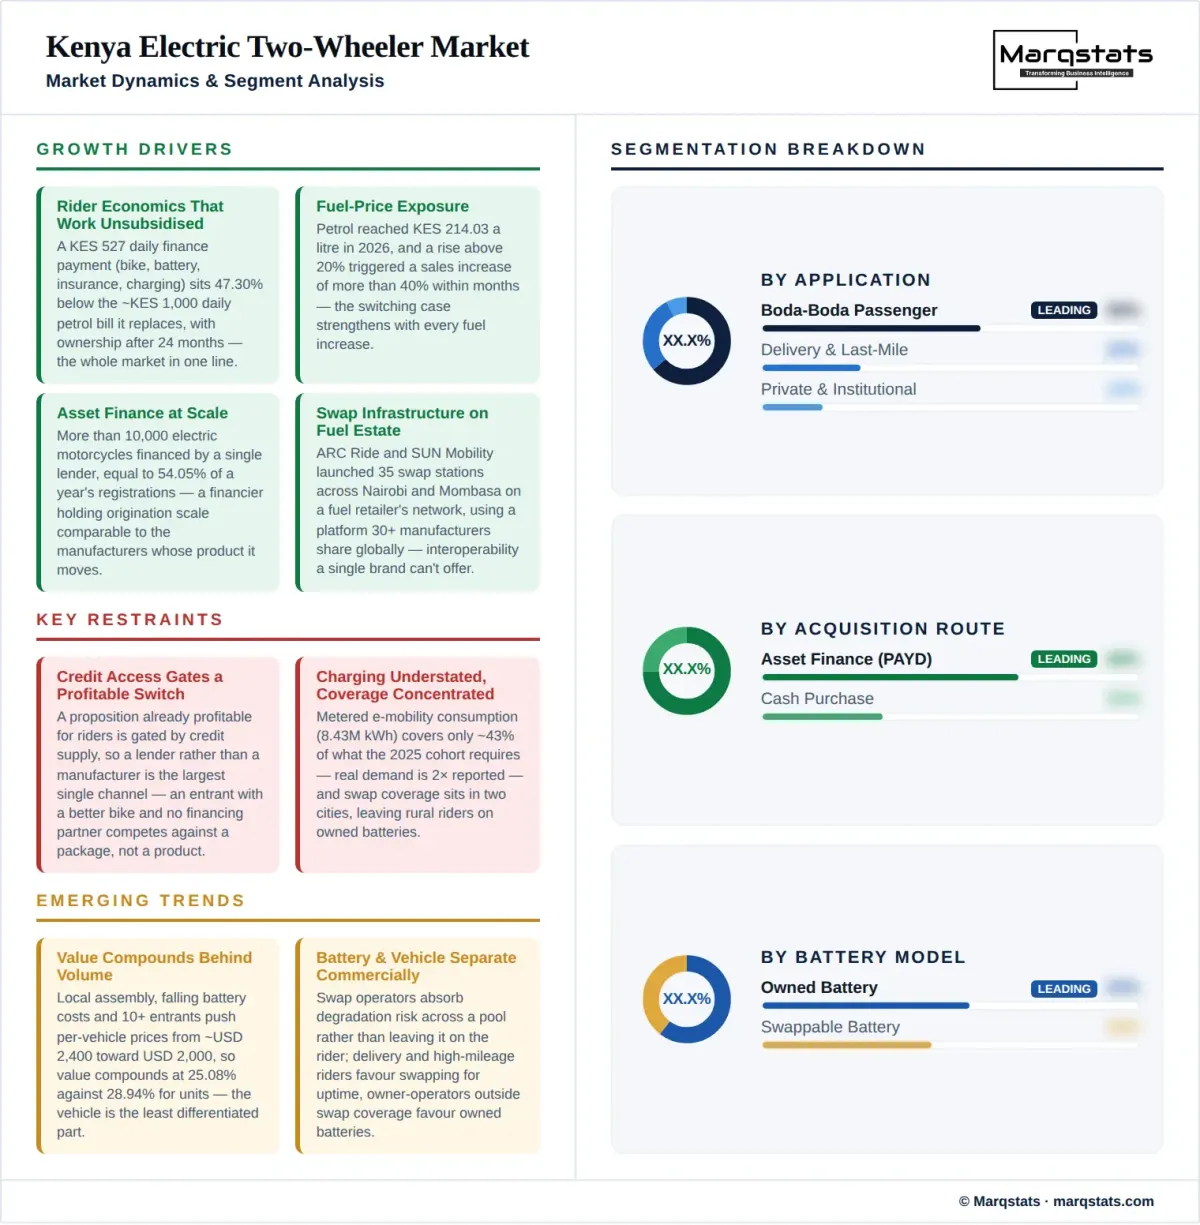
- Rider economics that work unsubsidised, with a KES 527 daily finance payment sitting 47.30% below the roughly KES 1,000 daily petrol bill it replaces.
- Fuel price exposure, with petrol at KES 214.03 a litre in 2026 and a rise above 20% triggering a sales increase of more than 40% within months.
- Asset finance at scale, with more than 10,000 electric motorcycles financed by a single lender, equal to 54.05% of a year's registrations.
- Swap infrastructure on existing fuel retail estate, with 35 stations across Nairobi and Mombasa using technology shared by more than 30 manufacturers globally.
- Policy formalisation through a national e-mobility framework launched in February 2026, backed by electricity supply that is around 93% renewable.
Key Restraints
- Credit access, which gates a proposition already profitable for riders, in a market where a lender rather than a manufacturer is the largest single channel.
- Charging capacity understated by official data, with metered e-mobility consumption of 8.43 million kWh covering roughly 43.40% of what the 2025 cohort alone requires.
- A nascent base of 18,500 annual units creating high year-to-year volatility, with more than ten new entrants targeting it simultaneously.
- Swap coverage concentrated in two cities, leaving rural and intercity riders dependent on owned batteries and overnight charging.
Key Trends
- Value compounding behind volume at 25.08% against 28.94%, as local assembly and entrant competition push per-vehicle prices from about USD 2,400 toward USD 2,000.
- Battery and vehicle separating commercially, with swap operators absorbing degradation risk across a pool rather than leaving it on the rider.
- Local content rising, with 36% of components in one leading model locally manufactured under a 2025 financing programme.
- Assembly capacity arriving ahead of demand, with one facility reported capable of hundreds of motorcycles a day against a market of 18,500 units a year.
Market Segmentation
The largest application by units and the one the entire market economics rest on, covering riders whose daily petrol spend of roughly KES 1,000 is the benchmark every electric proposition is measured against. The ministry identified this category as recording the highest percentage EV growth in 2025.
Courier, e-commerce and food delivery riders with the highest daily mileage and therefore the fastest payback, and the segment most dependent on swap uptime rather than charging convenience. At roughly 1,050 kWh a year per full-time machine, these riders are the heaviest individual energy consumers in the fleet.
Commuters and household buyers who capture the 40% energy cost reduction without the mileage that makes payback rapid, which makes this the most price-sensitive segment. It is the segment most likely to grow as the per-vehicle convention falls from approximately USD 2,400 toward USD 2,000.
Corporate, NGO and public sector fleets procuring in blocks, exemplified by financing programmes launched with more than 600 machines at a time. Procurement here is decided on total cost of ownership and supplier service capability rather than on the daily payment structures that move individual riders.
The rider owns the pack outright, typically within a financing package such as the KES 527 daily structure covering motorcycle, battery, insurance and charging access. Ownership suits riders outside the 35-station swap footprint who charge overnight and accept longer replenishment times.
The battery is held and maintained by an operator and exchanged in minutes, moving degradation risk off the rider and onto a pool. Interoperability is becoming a differentiator, with one swap technology platform used by more than 30 manufacturers globally rather than locked to a single brand.
The dominant route and the reason this market exists in its present form, with more than 10,000 machines financed by a single lender, equal to 54.05% of a year's registrations. Daily instalments matched to daily earnings underwrite riders who have revenue but no documented income.
Outright purchase by better-capitalised riders, small fleets and private buyers, a minority route in a market where the entry deposit on a financed machine is KES 25,000. Its share should rise as the per-vehicle convention falls toward USD 2,000 and entrant competition compresses prices.
Daily or weekly rental of machines owned by fleet operators, which removes the credit requirement entirely and serves riders who cannot pass origination even at a KES 25,000 deposit. It is the route that scales fastest when credit supply rather than rider demand is the binding constraint.
Machines assembled in Kenya with rising domestic content, evidenced by 36% of components in one leading model manufactured locally under a 2025 financing programme, and by facilities reported capable of hundreds of units a day. Local assembly improves policy eligibility, shortens parts lead times and strengthens lender collateral positions.
Fully built machines from Chinese, Indian and European manufacturers, the route most of the ten-plus entrants preparing for the market in September 2026 will use first. Imports carry duty, freight and foreign exchange exposure that a locally assembled equivalent partly avoids.
Operator-run exchange points, including 35 stations launched across Nairobi and Mombasa on an existing fuel retailer's estate. Siting on fuel forecourts is the fastest route to coverage because the land, permits, power connection and customer habit already exist.
Depot and hub charging serving fleets and organised operators, the assets behind most of the 205 e-mobility tariff accounts Kenya Power recorded. These are the only charging assets whose consumption reliably appears in official e-mobility statistics.
Overnight charging at homes, shops and informal points on ordinary domestic and small commercial connections, which is where the majority of the roughly 56.60% of fleet energy demand invisible to the e-mobility tariff is actually consumed. It requires no capital and imposes no siting constraint, which is why it dominates outside swap coverage.
By Geography
Nairobi Metropolitan Area
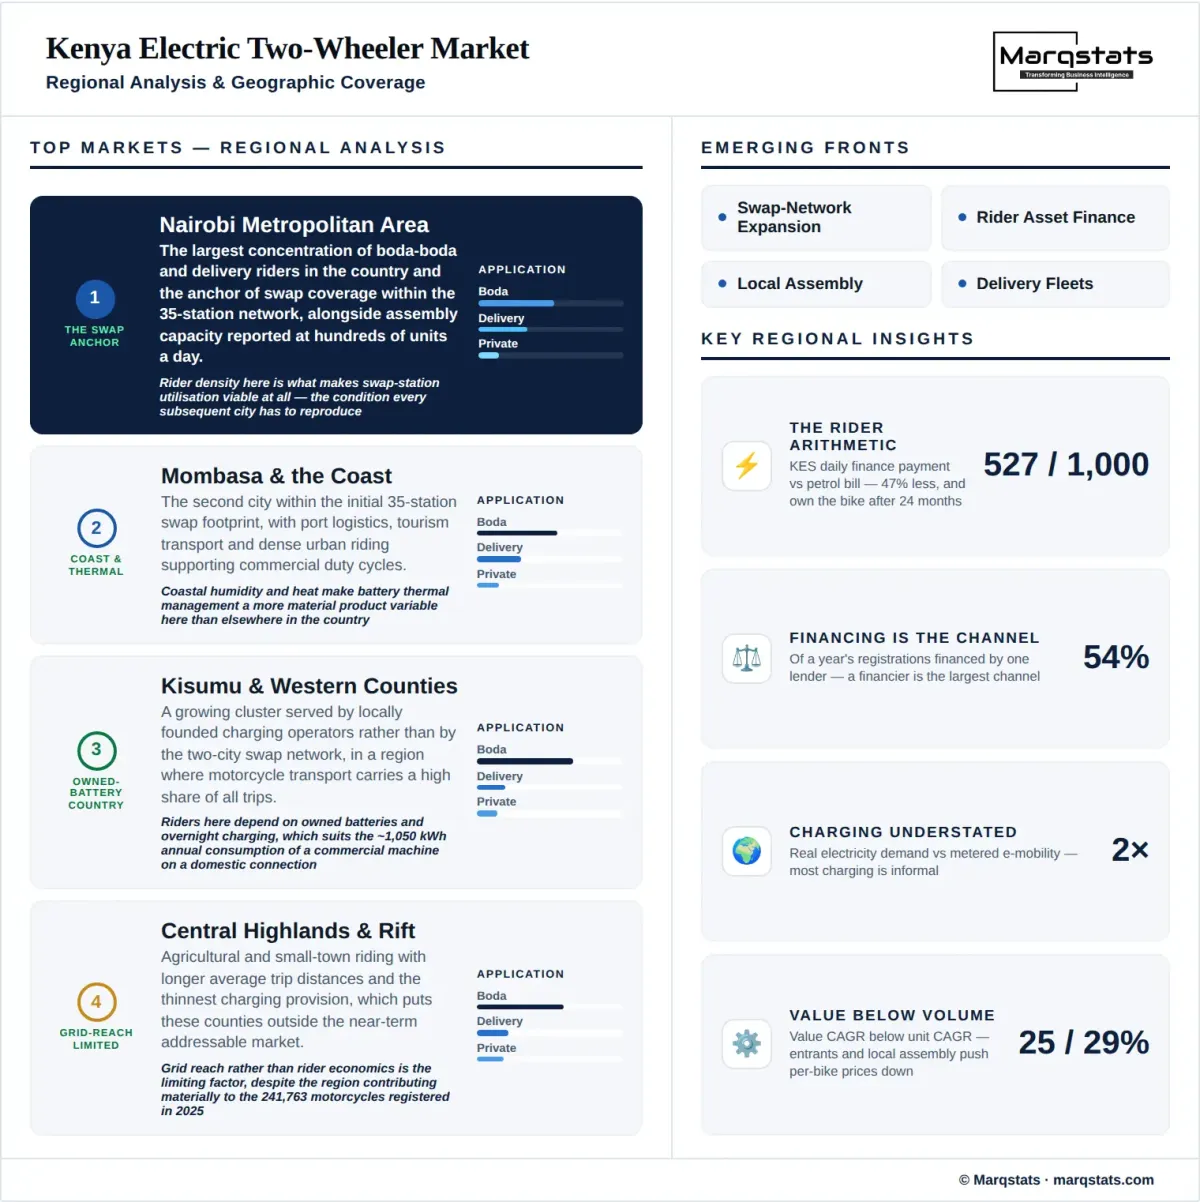
The largest concentration of boda-boda and delivery riders in the country and the anchor of swap coverage within the 35-station Nairobi and Mombasa network, alongside assembly capacity reported at hundreds of units a day. Rider density here is what makes swap station utilisation viable at all.
Mombasa and the Coast
The second city within the initial 35-station swap footprint, with port logistics, tourism transport and dense urban riding supporting commercial duty cycles. Coastal humidity and heat make battery thermal management a more material product variable here than elsewhere in the country.
Kisumu and the Western Counties
A growing cluster served by locally founded charging operators rather than by the two-city swap network, in a region where motorcycle transport carries a high share of all trips. Riders here depend on owned batteries and overnight charging, which suits the roughly 1,050 kWh annual consumption of a commercial machine on a domestic connection.
Central Highlands and the Rift Valley
Agricultural and small-town riding with longer average trip distances and the thinnest charging provision, which is why these counties sit outside the near-term addressable market despite contributing materially to the 241,763 motorcycles registered in 2025. Grid reach rather than rider economics is the limiting factor.
How Competition Is Evolving
This market is contested on three capabilities and only one of them is the motorcycle. Vehicle supply is about to become the least differentiated layer, with more than ten manufacturers preparing entry into a market of roughly 18,500 annual units, while credit origination and energy access remain scarce and defensible.
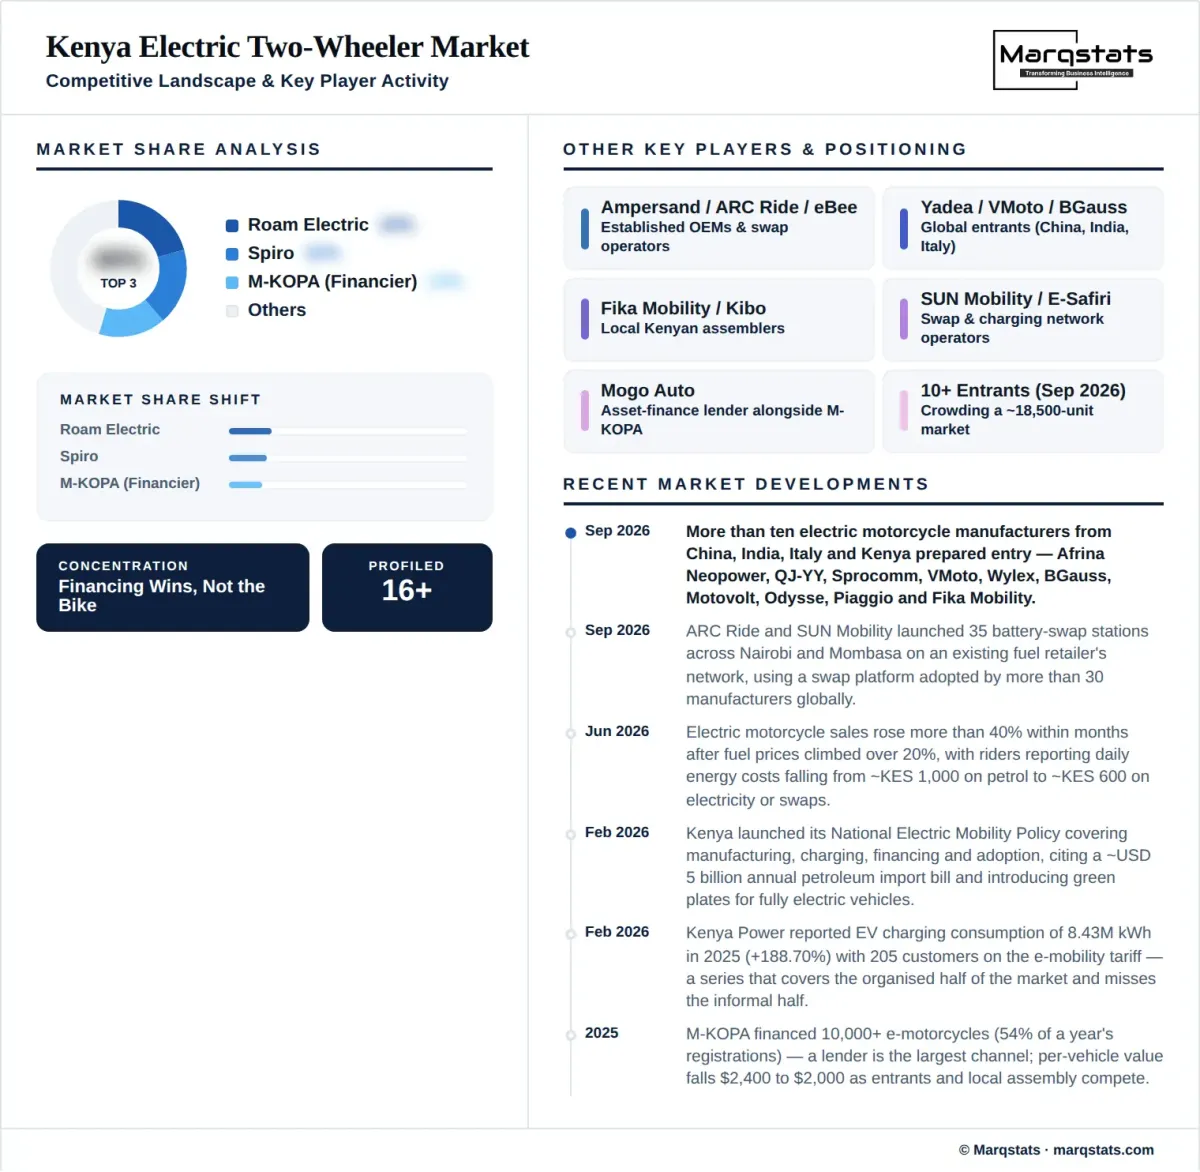
Among incumbents, Roam has built around local assembly and bundled financing, reporting 36% local content in its Air Gen 2 and launching a programme of more than 600 machines with a daily-payment lender. Spiro competes on manufacturing scale with a Nairobi facility reported capable of hundreds of units a day, and Ampersand has built regionally around battery swapping with a target of 13,000 machines across East Africa.
ARC Ride has taken the infrastructure route, pairing with a global swap technology provider and a major fuel retailer to launch 35 stations across two cities, and separately with Yadea to bring the world's largest electric two-wheeler manufacturer into the market. That is a distribution position built on energy rather than on product.
The financiers are principals in this market rather than channels, and any competitive map that treats them otherwise is wrong. A lender with more than 10,000 machines financed controls a share of origination comparable to the manufacturers whose product it moves, and it chooses which machines its riders can afford.
For an entrant the practical judgement is which layer to buy into. Assembly capacity already exceeds demand, vehicle specifications are converging, and the two assets that cannot be replicated quickly are a swap network on secured urban sites and a credit book with proven collection performance among riders who have no documented income.
Companies Covered
The report profiles 15+ companies with full strategy and financials analysis, including:
Recent Market Activity
Table of Contents
Coverage & Segmentation
This analysis measures annual sales and registrations of battery-electric motorcycles and motorised two-wheelers in Kenya from 2021 to 2031, with 2025 as the base year and 2026 to 2031 as the forecast period. Three-wheelers are excluded entirely. Both locally assembled and imported complete units are counted, because the buyer experiences them identically and the policy framework increasingly does not.
Coverage spans four applications, two battery models, three acquisition routes, two supply routes and three charging and swap infrastructure classes, with four regional clusters analysed on rider density, swap coverage and grid reach rather than quantified share. Market value is carried as a reference series in USD on a disclosed per-vehicle convention that falls rather than rises across the forecast. Fifteen entities are profiled across manufacturers, swap and charging operators and financiers.