Market Snapshot
Key Takeaways
Market Overview & Analysis
Report Summary
Indonesia's electric commercial vehicle market is the smallest panel in this catalogue and the one where the gap between installed capacity and delivered volume is widest. A plant inaugurated by the President targets 10,000 units a year against a national segment that sold an estimated 195 units in 2025. The forecast is therefore a question about conversion rather than about capability.
The measure is the retail value of new electric bus, truck, van and light commercial vehicle sales in Indonesia, covering vehicles whose primary purpose is carrying goods or fare-paying passengers. Electric passenger cars operating in ride-hailing fleets are excluded and counted in the passenger car panel, which matters here because the largest published Indonesian electric fleet figure, more than 14,000 vehicles across one platform ecosystem, is overwhelmingly passenger cars rather than commercial vehicles.
The analysis is written for assemblers weighing capacity commitments against a segment at 0.10% penetration, transport operators and municipalities sizing procurement against local content thresholds, logistics operators for whom the van rather than the bus is the relevant vehicle, and investors who need the distinction between a fleet count, a cumulative parc and an annual sales figure stated before any number is read.
Indonesia Electric Commercial Vehicle Market Size and Forecast
Electric commercial vehicle retail value is estimated at USD 32.04 million in 2025 and USD 273.12 million by 2030, an increase of USD 241.08 million on 3,305 additional units. Volume moves from 195 to 3,500 units at 78.16%, while average transaction value falls from IDR 2,760 million to IDR 1,311 million, or USD 164,286 to USD 78,036 at a constant IDR 16,800 per USD.
Value compounds 24.65 points below volume at 53.51% against 78.16%, the widest inversion in this catalogue by a wide margin. The cause is not pricing but vehicle mix: buses were an estimated 82.05% of units in 2025 at roughly IDR 3,200 million each, and vans and light commercial vehicles reach an estimated 58.57% of units by 2030 at roughly IDR 640 million each. The unit series and the value series describe different vehicles.
Electrification stood at 0.10% of an estimated 195,000 commercial vehicles sold in 2025, reaching an estimated 1.46% of a forecast 240,000 by 2030. The commercial vehicle base is carried from the Indonesian passenger car reconciliation, where commercial vehicles are an estimated 24.26% of the 803,687 unit association headline total, and it is stated here because published Indonesian vehicle shares almost always use that combined total.
A band of 1,800 to 6,500 units is published for 2030, and the width reflects a delivery record rather than analyst caution. The transport operator's stated ambition of 10,000 electric buses by 2029 and the assembler's 10,000 unit annual capacity target are both capacity and intent rather than demonstrated conversion, and Indonesian vehicle electrification targets have a documented history of being met at a small fraction. The lower bound assumes procurement continues at roughly the current municipal rate.
The Gap Between Capacity and Volume Is the Whole Story
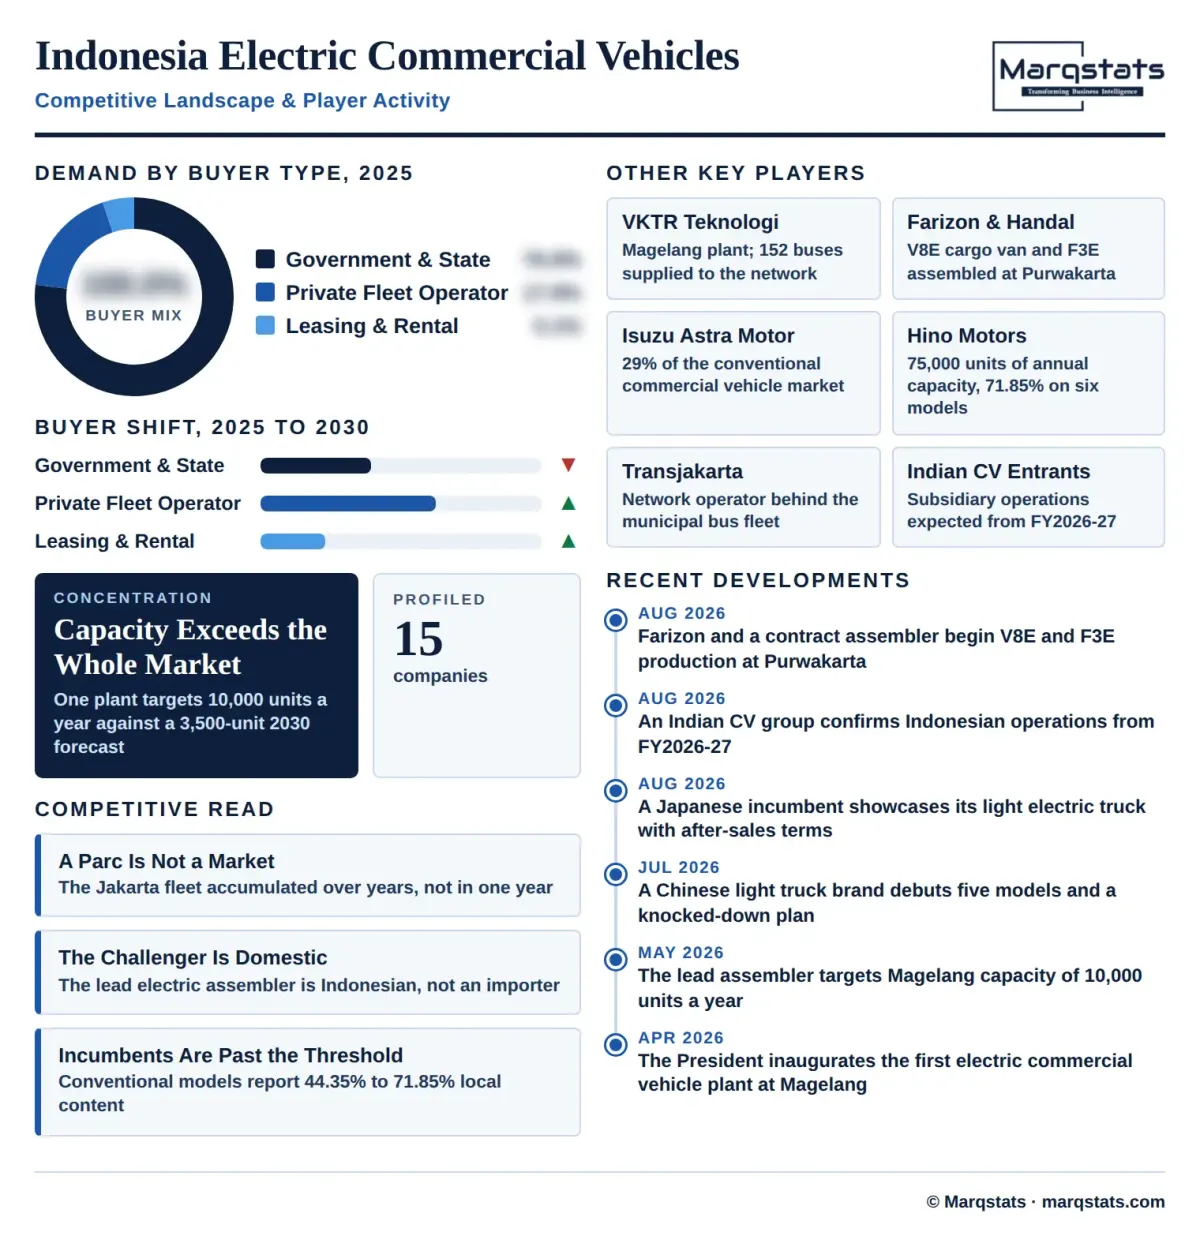
Installed and announced capacity already exceeds any plausible 2030 demand. The Magelang plant targets growth from roughly 3,000 to 10,000 units a year on its own, against a national segment estimated at 195 units in 2025 and forecast at 3,500 in 2030. Farizon began assembling the V8E cargo van and F3E at Purwakarta in August 2026, and a further entrant announced a knocked-down project in July 2026 alongside its five-model debut including a new-energy light truck.
The demand side is thinner than the supply side by an order of magnitude. An estimated 507 electric buses were in operation across the Jakarta network by the middle of 2026, and that is a cumulative parc built over several years rather than an annual sales figure. One assembler had supplied 152 of them, approximately 30% of the total, and delivered 30 twelve-metre buses to a network operator in the first half of 2026.
Reading a parc as a market is the error this segment invites most often. A fleet of 507 vehicles accumulated since the programme began, a platform ecosystem operating more than 14,000 electric vehicles that are mostly passenger cars, and a cooperative order for 70,000 conventional pickups and trucks are three different things, and none of them is the annual electric commercial vehicle sales figure this panel measures.
The conversion question is therefore specific and answerable. Capacity exists, product exists, and local assembly has started; what has not yet been demonstrated is a procurement channel outside municipal bus tenders large enough to absorb it. The van and light commercial vehicle segment is where that channel would appear, which is why it carries an estimated 58.57% of 2030 units against an estimated 12.82% in 2025.
Local Content Is the Policy Lever, Not Purchase Subsidy
Unlike the passenger car and two-wheeler segments, this one is not waiting on a consumer subsidy. The lever is local content, and the lead electric assembler reports over 40% on buses and 30% on trucks today, targeting 80% by 2028 and 60% to 80% by 2030. Those targets sit on a plant inaugurated in April 2026 on an investment of about IDR 5 trillion.
The conventional incumbents are already past those thresholds, which reframes the competition. One reports local content of 44.35% to 57.26% across its range, rising to 71.85% on six models of one series, on an investment of approximately USD 112.5 million and annual capacity of 75,000 units with about 1,547 employees. Another reports 46.45% on its light pickup, 33.04% on its light truck and 38.07% on its heavy truck, with cumulative production of 300,000 units since 2015.
The electric entrant therefore has to reach local content parity while operating at a fraction of the volume that makes localisation economic. Vehicles above 60% local content move from an estimated 7.69% of segment units in 2025 to an estimated 40.00% by 2030, and no compound rate is published for that series because a base of 15 units makes the rate a property of the denominator.
Two large cooperative orders announced in February 2026 show what the policy is competing against. One covers 70,000 vehicles, split between 35,000 pickups and 35,000 light trucks, and another 35,000 single-cab light commercial vehicles for 2026, both to the same state agricultural entity and both conventional and import-based. A single conventional order of that size is twenty times the entire 2030 electric forecast.
Buses Built the Market and Vans Will Carry It
Electric buses accounted for an estimated 160 units in 2025, 82.05% of segment volume, and the segment exists today essentially because of municipal transport procurement. Public transport applications took an estimated 82.05% of units and government and state transport operators an estimated 76.92%, which makes this the most policy-dependent demand profile of any Indonesian vehicle panel.
That concentration reverses across the window. Vans and light commercial vehicles move from an estimated 25 units and 12.82% of volume to an estimated 2,050 units and 58.57%, and logistics and last-mile delivery from an estimated 11.28% of units to an estimated 54.29%. Private fleet operators move from an estimated 17.95% of units to an estimated 50.00%. No compound rates are published for those series because each starts from a base below 50 units.
The vehicles behind the shift are already in the market. The Farizon V8E cargo van and F3E entered local assembly at Purwakarta in August 2026, a new-energy light truck debuted in July 2026 alongside a knocked-down assembly announcement, and an established Japanese incumbent showcased its light electric truck at the same event with after-sales commitments attached.
Charging follows the same split. Depot charging accounted for an estimated 92.31% of units in 2025 because a bus fleet returns to a depot every night, and it remains an estimated 82.86% by 2030. Opportunity and public charging moves from an estimated 7.69% to an estimated 17.14% as vans operating variable urban routes enter, and it is the segment that connects this panel to public charging infrastructure rather than to depot electrification.
Market Dynamics
Key Drivers
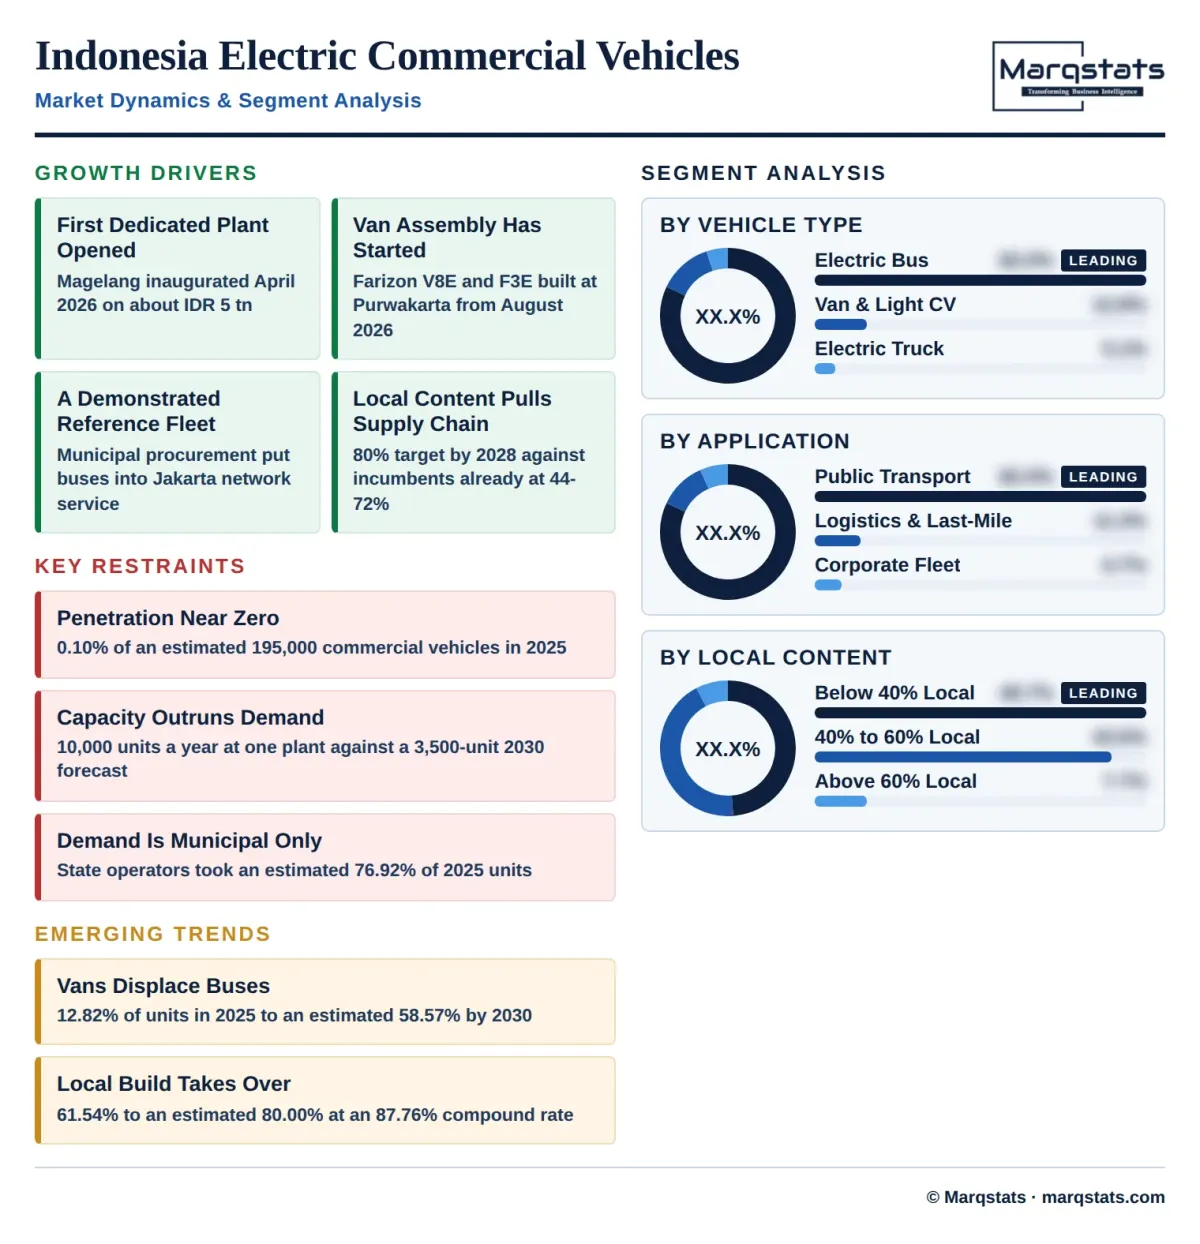
- The first dedicated electric commercial vehicle assembly plant was inaugurated in April 2026 on about IDR 5 trillion, targeting capacity from roughly 3,000 to 10,000 units a year.
- Local assembly of electric cargo vans began at Purwakarta in August 2026, and a further entrant announced a knocked-down assembly project in July 2026.
- Municipal transport procurement has already put an estimated 507 electric buses into Jakarta network operation, giving assemblers a demonstrated reference fleet.
- Local content targets of 80% by 2028 create a domestic supply chain incentive that conventional incumbents at 44.35% to 71.85% have already shown to be achievable.
- Fleet electrification commitments are being signed ahead of volume, including supply agreements covering 20,000 electric vehicles by 2028 across two operators.
Key Restraints
- Commercial vehicle electrification remained below 0.1% as of May 2026, an estimated 195 units against a commercial vehicle base of roughly 195,000.
- Announced capacity of 10,000 units a year at a single plant exceeds the entire 2030 national forecast of 3,500 units by nearly three times.
- Demand outside municipal bus tenders is unproven, with government and state operators taking an estimated 76.92% of 2025 units.
- Conventional procurement continues at scale, including February 2026 cooperative orders for 70,000 and 35,000 vehicles, both import-based.
Key Trends
- Vans and light commercial vehicles move from an estimated 12.82% of units to an estimated 58.57% by 2030, displacing buses as the volume vehicle.
- Locally assembled units rise from an estimated 61.54% to an estimated 80.00% at an 87.76% compound rate as Magelang and Purwakarta output scales.
- Vehicles above 60% local content move from an estimated 7.69% of units to an estimated 40.00% as the 2028 threshold approaches.
- Private fleet operators move from an estimated 17.95% of units to an estimated 50.00%, ending the municipal concentration that defines the base year.
Market Segmentation
Electric buses accounted for an estimated 160 units in 2025, 82.05% of volume, reaching an estimated 900 units or 25.71% by 2030 at a 41.26% compound rate. An estimated 507 were in Jakarta network operation by mid-2026 on a cumulative basis, of which one assembler supplied 152, and that assembler delivered 30 twelve-metre buses to a network operator in the first half of 2026.
Electric vans and light commercial vehicles accounted for an estimated 25 units in 2025, 12.82% of volume, reaching an estimated 2,050 units or 58.57% by 2030 and becoming the largest vehicle type. No compound rate is published because a base of 25 units makes the rate a property of the denominator. Local assembly of the Farizon V8E cargo van and F3E began at Purwakarta in August 2026.
Electric trucks accounted for an estimated 10 units in 2025, 5.13% of volume and the smallest type, reaching an estimated 550 units or 15.71% by 2030, with no compound rate published on a base of 10 units. A new-energy light truck debuted in July 2026 alongside a knocked-down assembly announcement, and an established incumbent showcased its light electric truck in August 2026.
Public transport accounted for an estimated 160 units in 2025, 82.05% of volume, reaching an estimated 950 units or 27.14% by 2030 at a 42.80% compound rate. The application built the segment through municipal bus procurement and remains the only channel with a demonstrated multi-year order history, but it loses its majority as commercial applications enter.
Logistics and last-mile delivery accounted for an estimated 22 units in 2025, 11.28% of volume, reaching an estimated 1,900 units or 54.29% by 2030 and becoming the largest application. No compound rate is published on a base of 22 units. Cargo van assembly starting at Purwakarta in August 2026 is the supply-side event that makes the shift possible.
Corporate and industrial fleets accounted for an estimated 13 units in 2025, 6.67% of volume, reaching an estimated 650 units or 18.57% by 2030, with no compound rate published on a base of 13 units. Deliveries to a logistics operator in Malang and to industrial group entities in the first half of 2026 are the reference transactions for this application.
Locally assembled units accounted for an estimated 120 units in 2025, 61.54% of volume, reaching an estimated 2,800 units or 80.00% by 2030 at an 87.76% compound rate. Capacity is committed rather than planned, across the Magelang plant targeting roughly 3,000 to 10,000 units a year and the Purwakarta line assembling cargo vans from August 2026.
Imported complete built up units accounted for an estimated 75 units in 2025, 38.46% of volume, reaching an estimated 700 units or 20.00% by 2030 at a 56.32% compound rate. The category covers bus bodies and light electric trucks supplied ahead of local lines, and it halves in share as local content thresholds tighten toward the 2028 target.
Vehicles below 40% local content accounted for an estimated 95 units in 2025, 48.72% of volume, reaching an estimated 600 units or 17.14% by 2030 at a 44.57% compound rate. The band covers imported and early locally assembled product, and it loses two thirds of its share as the 80% target for 2028 approaches.
Vehicles at 40% to 60% local content accounted for an estimated 85 units in 2025, 43.59% of volume, reaching an estimated 1,500 units or 42.86% by 2030 at a 77.56% compound rate, holding its share almost exactly. The lead electric assembler sits here today at over 40% on buses, as do several conventional incumbent models at 44.35% and 46.45%.
Vehicles above 60% local content accounted for an estimated 15 units in 2025, 7.69% of volume, reaching an estimated 1,400 units or 40.00% by 2030, with no compound rate published on a base of 15 units. Conventional incumbents already reach 71.85% on six models of one series, which establishes the level as achievable rather than aspirational.
Government and state transport operators accounted for an estimated 150 units in 2025, 76.92% of volume, reaching an estimated 1,100 units or 31.43% by 2030 at a 48.96% compound rate. Municipal bus procurement built the segment, and the network operator has stated an ambition of 10,000 battery-powered buses by 2029, which is treated here as intent rather than as a volume input.
Private fleet operators accounted for an estimated 35 units in 2025, 17.95% of volume, reaching an estimated 1,750 units or 50.00% by 2030 and becoming the largest buyer type. No compound rate is published on a base of 35 units. Supply agreements covering 20,000 electric vehicles by 2028 across two operators indicate the intended scale of this channel.
Leasing and rental companies accounted for an estimated 10 units in 2025, 5.13% of volume, reaching an estimated 650 units or 18.57% by 2030, with no compound rate published on a base of 10 units. The channel matters disproportionately because it converts a high purchase price into an operating cost, which is the barrier a 52.52% fall in average transaction value only partly removes.
Depot charging served an estimated 180 units in 2025, 92.31% of volume, reaching an estimated 2,900 units or 82.86% by 2030 at a 74.35% compound rate. A bus fleet returning to a depot nightly needs no public infrastructure, which is why the segment grew at all while national public charging remained thin.
Opportunity and public charging served an estimated 15 units in 2025, 7.69% of volume, reaching an estimated 600 units or 17.14% by 2030, with no compound rate published on a base of 15 units. A charging hub at Kemayoran in central Jakarta opens in October 2026 with 36 vehicle charging units on an 8,747 square metre site, and toll-corridor charging is planned at 29 Trans-Sumatra rest areas.
By Geography
Jakarta and Greater Jabodetabek
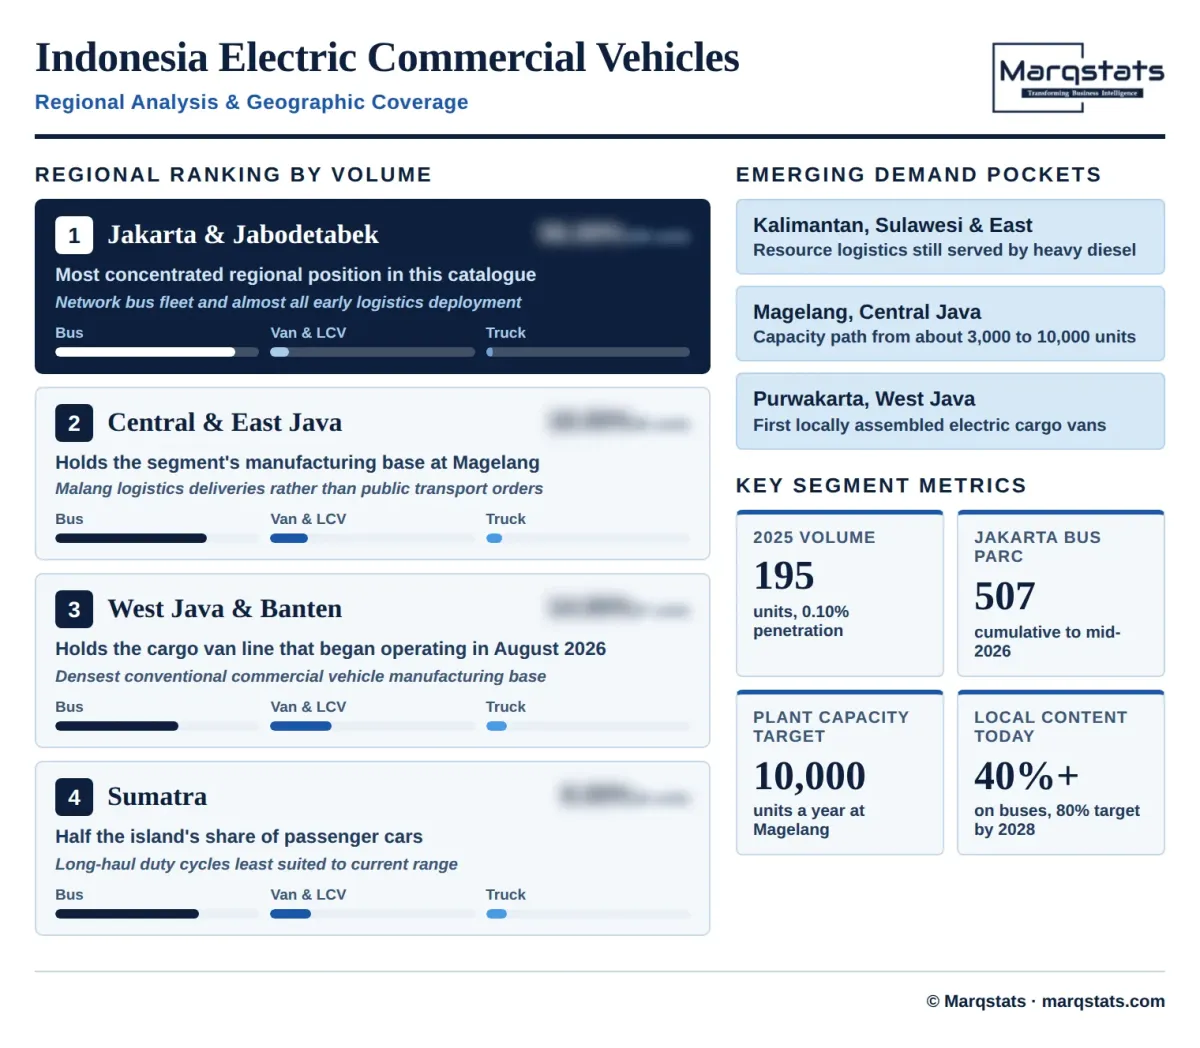
Jakarta and the surrounding metropolitan area account for an estimated 109 registrations in 2025, 56.00% of national electric commercial vehicle volume, twenty-six points above the region's 30.00% share of passenger cars and the most concentrated regional position in this catalogue. The network bus fleet, the charging hub opening in October 2026 and almost all early logistics deployment sit here.
Central and East Java
Central and East Java account for an estimated 35 registrations, 18.00% of volume, and hold the segment's manufacturing base at the Magelang plant inaugurated in April 2026. Deliveries to a logistics operator in Malang in the first half of 2026 are the region's reference commercial transactions rather than public transport orders.
West Java and Banten
West Java and Banten account for an estimated 27 registrations, 14.00% of volume, and hold the cargo van assembly line at Purwakarta that began operating in August 2026. The region also carries the densest conventional commercial vehicle manufacturing base, including the Karawang plant with cumulative production of 300,000 units since 2015.
Sumatra
Sumatra accounts for an estimated 16 registrations, 8.00% of volume, half the island's share of passenger cars. Long-haul freight duty cycles are the least suited to current battery electric range, and the only committed inter-city infrastructure is charging planned at 29 rest areas along the Trans-Sumatra toll road.
Kalimantan, Sulawesi and Eastern Indonesia
Kalimantan, Sulawesi and eastern Indonesia account for an estimated 8 registrations, 4.00% of volume, the smallest regional position. Resource-sector logistics dominate commercial vehicle demand here and are served by heavy conventional trucks, though the new capital city authority has been named as a target customer for electric fleet supply.
How Competition Is Evolving
The conventional incumbents hold this market and are not yet being displaced. One held 29% of the commercial vehicle market in 2025, with its light pickup supplying 47.5% of its own volume, its light truck 23.7% and its heavy truck 18.2%, and exported more than 8,000 vehicles to 25 destinations. Another operates 75,000 units of annual capacity on approximately USD 112.5 million of investment with about 1,547 employees. A third supplied 29,099 pickups and 14,698 minibuses of one model family between January and July 2026, 51% of its own retail of 84,959 units, itself up 9%, with July alone at 12,750 units and up 13.6%. That model family ran 6,694 units in June, 53% of the brand's retail that month, split 4,338 pickups and 2,356 minibuses.
The electric challenge is domestic rather than imported, which is unusual in Indonesia. The lead electric assembler is Indonesian, operates the Magelang plant inaugurated by the President in April 2026, has supplied 152 buses to the Jakarta network and reported first-half 2026 net sales of IDR 647 billion, up 56%, with operating profit of IDR 16 billion. Its strategy is stated as factory-to-ecosystem rather than vehicle supply alone.
Behind it the entrant field is broad and early. Farizon began local van assembly at Purwakarta in August 2026 with a distributor and a contract manufacturer, a Chinese light truck brand debuted with five models and a knocked-down assembly plan in July 2026, an Indian commercial vehicle group confirmed its Indonesian subsidiary would begin operations in the 2026-27 financial year, and an established Japanese incumbent showcased its light electric truck in August 2026. Another Indian manufacturer signed a February 2026 agreement with a state defence manufacturer for joint electric bus development.
Companies Covered
The report profiles 15+ companies with full strategy and financials analysis, including:
Recent Market Activity
Table of Contents
Coverage & Segmentation
The analysis measures the retail value of new electric bus, truck, van and light commercial vehicle sales in Indonesia from 2021 to 2030, with 2025 as the base year and 2026 to 2030 as the forecast period, covering vehicle type, application, assembly origin, local content band, buyer type and charging configuration, together with the assembly capacity and local content framework that govern the supply path. Electric passenger cars are excluded at 103,931 units in 2025 and are counted in the passenger car panel, including those operating in ride-hailing fleets. Electric two-wheelers are excluded at 55,059 units, and conventional commercial vehicles at an estimated 195,000 units. Vehicle export flows, reported at 123,455 complete built up units in the first quarter of 2026 alongside 18,972 knocked down sets and more than 44 million component pieces, are sized on the Indonesian automotive export panel rather than here, as is component manufacturing investment such as the USD 251.44 million tyre plant at Demak rated at 600,000 truck and bus radial and 3.6 million passenger car radial tyres a year. Values are expressed in USD at a disclosed constant IDR 16,800 per USD.
Coverage spans three vehicle types, three applications, two assembly origins, three local content bands, three buyer types and two charging configurations, with five regional clusters analysed on registration volume. Segment volume is carried as the unit series at 195 in 2025 and average transaction value as a derived series at IDR 2,760 million, and both are published alongside the value panel because average transaction value falls 52.52% while units multiply seventeen times. Fifteen entities are profiled across electric assemblers, conventional incumbents, contract manufacturers, entrants and fleet operators.