Market Snapshot
Key Takeaways
Market Overview & Analysis
Report Summary
Indonesia assembles more vehicles than it sells and exports the difference, which makes this a manufacturing market rather than a demand market. Output of an estimated 1,180,000 vehicles in 2025 sat against domestic wholesales of 803,691, with 518,212 complete built up units shipped abroad. The question the page addresses is not whether Indonesia can absorb more vehicles but whether it can capture more value from each one it builds.
The measure is assembly value added: the value created by vehicle assembly operations in Indonesia across manufacturer-owned plants and third-party contract assemblers, covering full-process manufacturing, complete knocked down and semi knocked down work. It is deliberately not vehicle retail value, which is sized separately at USD 10.33 billion for passenger cars alone, and it is not component manufacturing value. Knocked down sets exported for assembly elsewhere are excluded from the vehicle count at 63,263 sets in 2025 and treated separately.
The analysis is written for manufacturers deciding where to place Southeast Asian capacity as one government actively bids for a regional hub, contract assemblers whose order books now depend on Chinese entrants rather than on legacy franchises, component suppliers whose addressable content rises with each local content step, and investors who need assembly value added kept distinct from the vehicle value it sits inside.
Indonesia Automotive Local Assembly Market Size and Forecast
Assembly value added is estimated at USD 1,947.00 million in 2025 and USD 3,877.50 million by 2030, an increase of USD 1,930.50 million on 470,000 additional vehicles. Output moves from 1,180,000 to 1,650,000 vehicles at 6.94%, while assembly value added per vehicle rises from an estimated USD 1,650 to USD 2,350, a gain of 42.42%.
Value compounds 7.83 points ahead of volume at 14.77% against 6.94%, which reverses the pattern across the rest of this Indonesian cluster. The hybrid, plug-in hybrid, electric commercial vehicle and battery panels all grow faster in units than in money. This one does the opposite because local content requirements force more of each vehicle to be made in Indonesia rather than fitted in Indonesia.
The distinction between assembly value added and vehicle value is the panel's most important boundary. An estimated USD 1,650 of value added per vehicle sits inside an average vehicle whose retail transaction value was IDR 285 million, or roughly USD 16,964, on the passenger car panel. Assembly is therefore a low single-digit to low double-digit percentage of the vehicle it produces, and summing this panel with the vehicle market would count the same vehicle twice.
Output is measured as vehicles assembled in Indonesia rather than vehicles sold there, and the two diverge sharply. An estimated 661,788 vehicles were produced for the domestic market against 518,212 exported, while 803,691 were wholesaled domestically including roughly 85,000 imports. The residual of an estimated 56,899 units is a stock drawdown, consistent with a year in which domestic sales fell 7.2%.
A Government Bidding for Another Country's Production Base
In August 2026 the Finance Minister told the national automotive conference that Indonesia is prepared to offer investment incentives and regulatory concessions to persuade Toyota to shift its principal Southeast Asian production base from Thailand to Indonesia. No comparable statement appears in any other market covered in this programme.
The incumbent position that would move is substantial. Toyota reports cumulative Indonesian investment above IDR 100 trillion across five factories with 90% local production for domestic sales, and has separately committed IDR 1.3 trillion to move from battery pack assembly into cell and module production. A group already at that depth of localisation is being asked to deepen it further rather than to start.
The supporting conditions are being assembled in parallel rather than promised. Development finance is flowing to Japanese manufacturing here, with a loan of up to USD 72 million agreed in March 2026 to one Japanese manufacturer's Indonesian operation within a co-financing package of about USD 143 million. Another Japanese group reports 88% of models sold in 2025 produced locally on sales above 64,000 units.
Whether the bid succeeds is outside the forecast window's certainty, and the panel does not assume it. The 2030 output figure of 1,650,000 vehicles is built from announced and operating capacity rather than from a relocation that has been proposed and not agreed. If it were to happen, it would sit above the published range rather than inside it.
Contract Assemblers Became the Entry Route
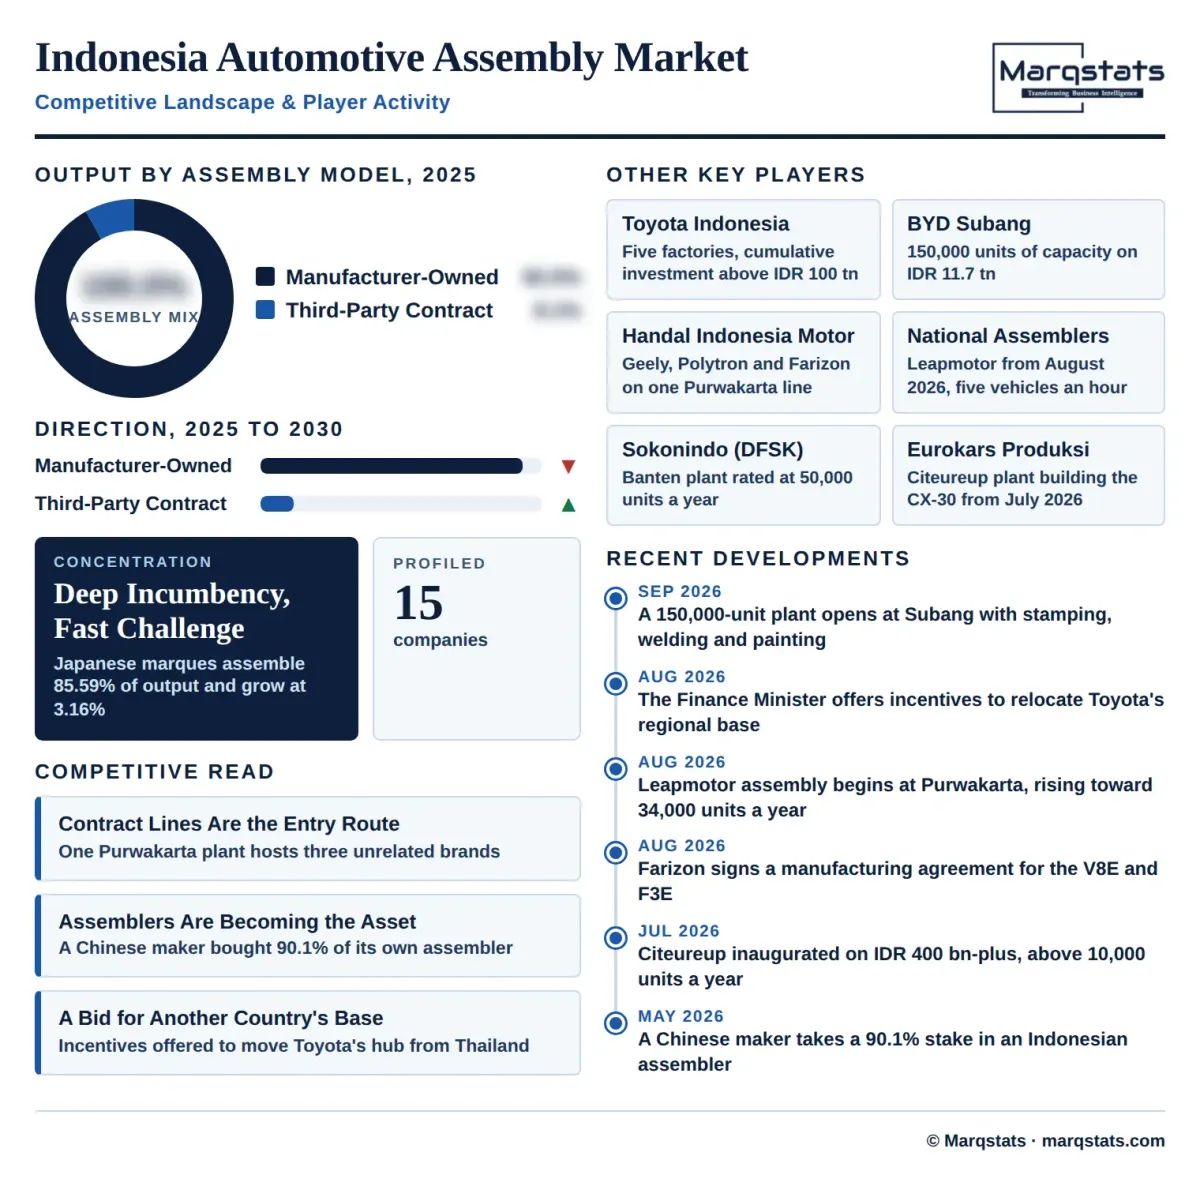
Third-party contract assembly is the fastest-growing part of this market, moving from an estimated 95,000 vehicles and 8.05% of output in 2025 to an estimated 185,000 and 11.21% by 2030 at 14.26%, against 6.19% for manufacturer-owned plants. The reason is that a Chinese entrant can reach local content thresholds without building a plant.
One Purwakarta assembler illustrates the model. It builds the Geely EX2, which reports 46.5% local content and drew more than 1,500 order forms, alongside Polytron output of 531 units in 2025 and 154 units in January 2026, and from August 2026 the Farizon V8E cargo van and F3E under a manufacturing agreement signed with the brand and its distributor. Three unrelated brands share one line.
A second Purwakarta site began assembling two Leapmotor models in August 2026 at five vehicles an hour, roughly 10,000 units a year, with a planned rise to 17 an hour or about 34,000 units. A Banten plant rated at 50,000 units a year builds DFSK product, and a Citeureup plant inaugurated on 28 July 2026 on more than IDR 400 billion across nearly 65,000 square metres builds the Mazda CX-30 at above 10,000 units a year on two shifts.
Ownership of the contract assembler is itself becoming strategic. In May 2026 one Chinese manufacturer acquired 90.1% of an Indonesian electric vehicle assembler, with the previous owner retaining 9.9%, having already produced and delivered more than 1,000 vehicles locally across two models. That converts a contract relationship into a captive plant without greenfield construction.
The Local Content Ladders Converge on the Same Two Dates
Three separate ladders arrive at 60% in 2027 and 80% by 2028 to 2030. The Subang operator reports above 40% today with 60% committed from January 2027 and 80% by 2030, another entrant targets up to 60% by 2027 through knocked down assembly, and the electric commercial vehicle plant at Magelang targets 80% by 2028 on about IDR 5 trillion of investment with capacity moving from roughly 3,000 to 10,000 units a year.
The Japanese commercial vehicle incumbents are already inside that range and publish by model. One reports 44.35% to 57.26% across its range and 71.85% on six models of one series, on about USD 112.5 million of investment with 75,000 units of annual capacity and roughly 1,547 workers. Another reports 46.45% on its light pickup, 33.04% on its light truck and 38.07% on its heavy truck, with cumulative production of 300,000 units since 2015.
Output above 60% local content moves from an estimated 410,000 vehicles and 34.75% of the total to an estimated 980,000 and 59.39% at a 19.04% compound rate. Output below 40% declines in absolute terms at a negative 6.51% rate, and output in the 40% to 60% band also declines slightly at a negative 1.47% rate as vehicles graduate upward rather than enter.
This is what lifts value above volume. Each step up the ladder moves work that was previously done abroad into an Indonesian plant, so the same vehicle carries more Indonesian value added. The forecast rise of 42.42% in value added per vehicle is the ladder expressed in money.
Market Dynamics
Key Drivers
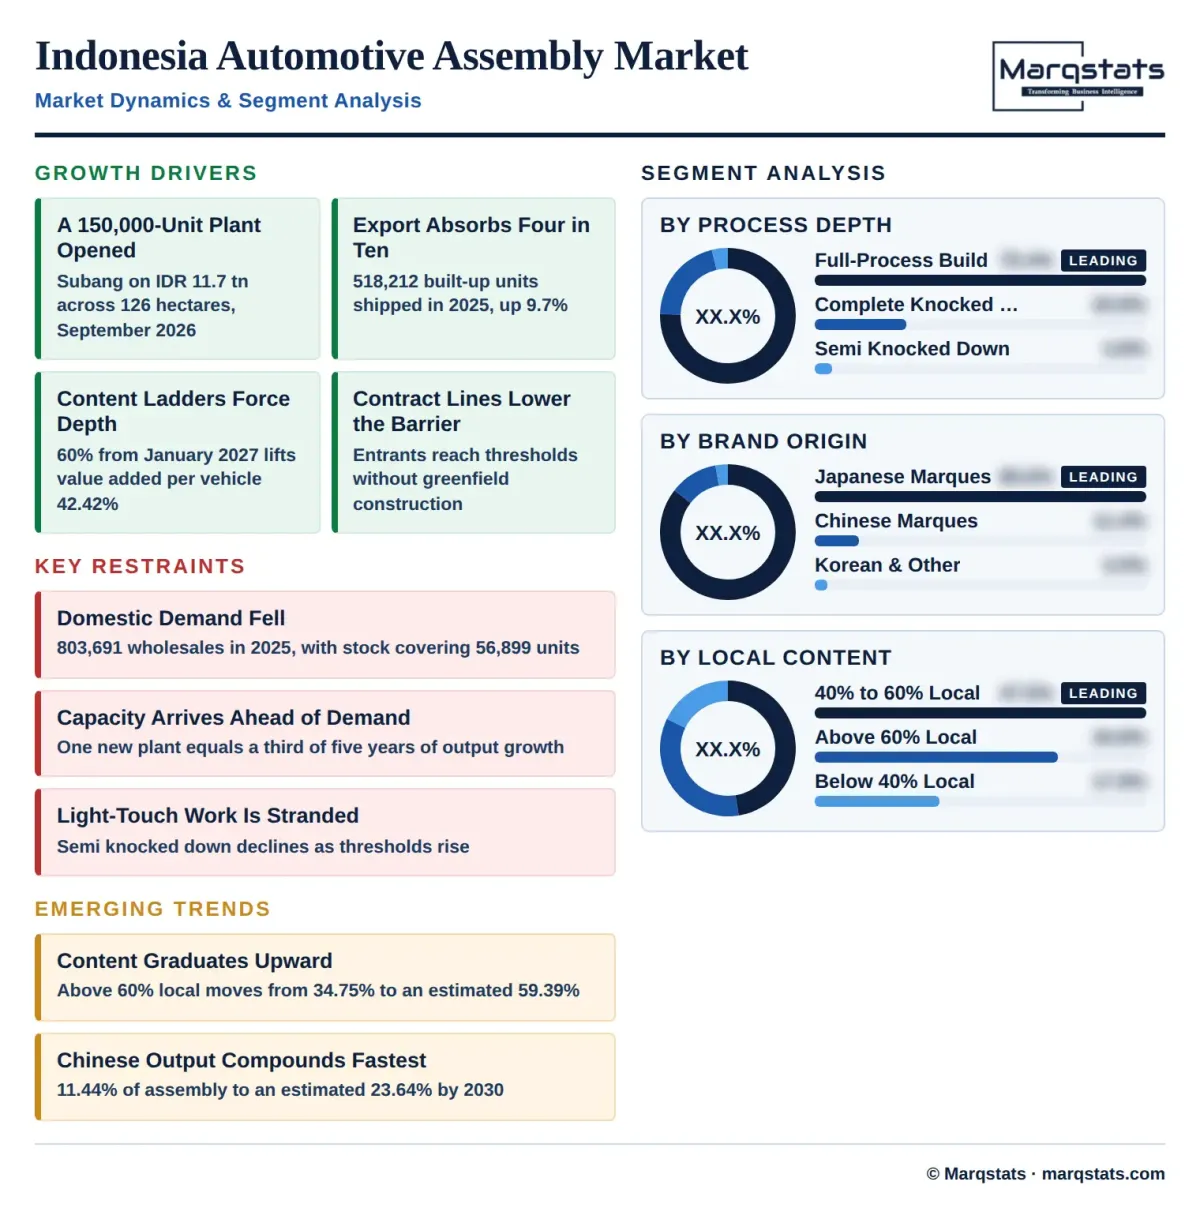
- A 150,000 unit plant opened at Subang on 3 September 2026 on IDR 11.7 trillion across 126 hectares, with more than 5,000 employees and over 20,000 jobs projected at full capacity.
- Export demand absorbs 43.92% of output, with 518,212 complete built up vehicles shipped in 2025, up 9.7%, alongside 63,263 knocked down sets, up more than 36%.
- Local content thresholds reaching 60% in January 2027 force assembly work into the country rather than rewarding it, lifting value added per vehicle 42.42%.
- Contract assemblers let entrants reach those thresholds without greenfield construction, growing at 14.26% against 6.19% for manufacturer-owned plants.
- Development finance supports incumbent expansion, including a loan of up to USD 72 million agreed in March 2026 within a package of about USD 143 million.
Key Restraints
- Domestic demand fell 7.2% in 2025 to 803,691 wholesales, and an estimated 56,899 units of that came from stock rather than from current production.
- Announced capacity is arriving faster than domestic demand, with one new plant alone rated at 150,000 units against national output growth of 470,000 vehicles across five years.
- Semi knocked down assembly declines at a negative 2.33% rate as thresholds rise, stranding the lightest-touch operations.
- The proposal to attract a regional production base from Thailand remains an offer rather than an agreement, and is excluded from the forecast.
Key Trends
- Output above 60% local content rises from an estimated 34.75% of vehicles to an estimated 59.39% at a 19.04% compound rate.
- Chinese marques move from an estimated 11.44% of assembled output to an estimated 23.64% at a 23.64% compound rate, the fastest origin group.
- Full-process manufacturing rises from an estimated 75.42% to an estimated 78.18% of output as stamping, welding and painting displace kit fitting.
- Contract assemblers host multiple unrelated brands on one line, with a single Purwakarta plant building Geely, Polytron and Farizon product.
Market Segmentation
Manufacturer-owned plants assembled an estimated 1,085,000 vehicles in 2025, 91.95% of output, reaching an estimated 1,465,000 or 88.79% by 2030 at a 6.19% compound rate. The category spans five Toyota factories, 75,000 units of Hino capacity, the Isuzu plant at Karawang with 300,000 cumulative units since 2015, and new greenfield sites at Subang.
Third-party contract assemblers handled an estimated 95,000 vehicles in 2025, 8.05% of output, reaching an estimated 185,000 or 11.21% by 2030 at a 14.26% compound rate, more than twice the manufacturer-owned rate. One Purwakarta plant alone builds Geely, Polytron and Farizon product, and a Banten plant is rated at 50,000 units a year.
Full-process manufacturing accounted for an estimated 890,000 vehicles in 2025, 75.42% of output, reaching an estimated 1,290,000 or 78.18% by 2030 at a 7.71% compound rate. The Subang plant opened in September 2026 runs stamping, welding, painting and assembly rather than kit fitting, which is what distinguishes this category from knocked down work.
Complete knocked down assembly accounted for an estimated 245,000 vehicles in 2025, 20.76% of output, reaching an estimated 320,000 or 19.39% by 2030 at a 5.49% compound rate. It remains the entry route for new brands, with one target of up to 60% local content by 2027 set explicitly on a knocked down basis.
Semi knocked down assembly accounted for an estimated 45,000 vehicles in 2025, 3.81% of output, falling to an estimated 40,000 or 2.42% by 2030 at a negative 2.33% compound rate, the only declining process depth. Rising local content thresholds strand the lightest-touch operations, since a semi knocked down vehicle cannot reach 60% Indonesian content.
Japanese marques assembled an estimated 1,010,000 vehicles in 2025, 85.59% of output, reaching an estimated 1,180,000 or 71.52% by 2030 at a 3.16% compound rate, the slowest origin group. The position is deep rather than fast, resting on cumulative investment above IDR 100 trillion, five factories and 90% local production for domestic sales at one group alone, and 88% at another.
Chinese marques assembled an estimated 135,000 vehicles in 2025, 11.44% of output, reaching an estimated 390,000 or 23.64% by 2030 at a 23.64% compound rate, the fastest origin group. The cohort spans the Subang plant at 150,000 units of capacity, contract-assembled Geely and Leapmotor product, a 50,000 unit Banten plant, and cumulative Wuling output of 200,000 vehicles since 2017 including 10,000 exported. Chinese brands supply most battery electric output, which ran 5,334 units in February 2026 against 4,218 in January, while the hybrid base built by Japanese marques ran 8,131 and 8,058 units and plug-in hybrid output was 185 and 224 units.
Korean, Western and other marques assembled an estimated 35,000 vehicles in 2025, 2.97% of output, reaching an estimated 80,000 or 4.85% by 2030 at a 17.98% compound rate. The category includes the Citeureup plant inaugurated in July 2026 on more than IDR 400 billion, and a 171 hectare Vietnamese-owned site at Subang with planned investment above USD 1 billion across five models.
Output below 40% local content accounted for an estimated 210,000 vehicles in 2025, 17.80% of the total, falling to an estimated 150,000 or 9.09% by 2030 at a negative 6.51% compound rate. It is the position the January 2027 threshold is designed to end, and the lowest published model-level figure in the market sits here at 33.04%.
Output at 40% to 60% local content accounted for an estimated 560,000 vehicles in 2025, 47.46% of the total and the largest band, easing to an estimated 520,000 or 31.52% by 2030 at a negative 1.47% compound rate. The Geely EX2 at 46.5%, one light pickup at 46.45% and a range reported at 44.35% to 57.26% all sit here, and the band shrinks because vehicles graduate upward.
Output above 60% local content accounted for an estimated 410,000 vehicles in 2025, 34.75% of the total, reaching an estimated 980,000 or 59.39% by 2030 at a 19.04% compound rate, the fastest band. Six models of one commercial vehicle series already reach 71.85%, which establishes the level as achievable rather than aspirational.
Vehicles assembled for the domestic market accounted for an estimated 661,788 units in 2025, 56.08% of output, reaching an estimated 1,040,000 or 63.03% by 2030 at a 9.46% compound rate. Domestic wholesales of 803,691 exceeded this figure because roughly 85,000 vehicles were imported and an estimated 56,899 units came out of stock.
Complete built up exports accounted for 518,212 vehicles in 2025, 43.92% of output and up 9.7%, reaching an estimated 610,000 or 36.97% by 2030 at a 3.32% compound rate. Export share falls as domestic absorption grows faster, but export volume continues rising and remains the reason Indonesian assembly capacity exceeds Indonesian demand.
Passenger cars accounted for an estimated 905,000 assembled vehicles in 2025, 76.69% of output, reaching an estimated 1,275,000 or 77.27% by 2030 at a 7.10% compound rate. The category carries almost all new entrant capacity, including the Subang plants and every contract-assembled Chinese model.
Commercial vehicles accounted for an estimated 275,000 assembled vehicles in 2025, 23.31% of output, reaching an estimated 375,000 or 22.73% by 2030 at a 6.40% compound rate. The category is the most deeply localised part of the market, with published local content between 33.04% and 71.85%, and it includes the sole dedicated electric commercial vehicle plant at 3,000 to 10,000 units a year.
By Geography
West Java and Banten
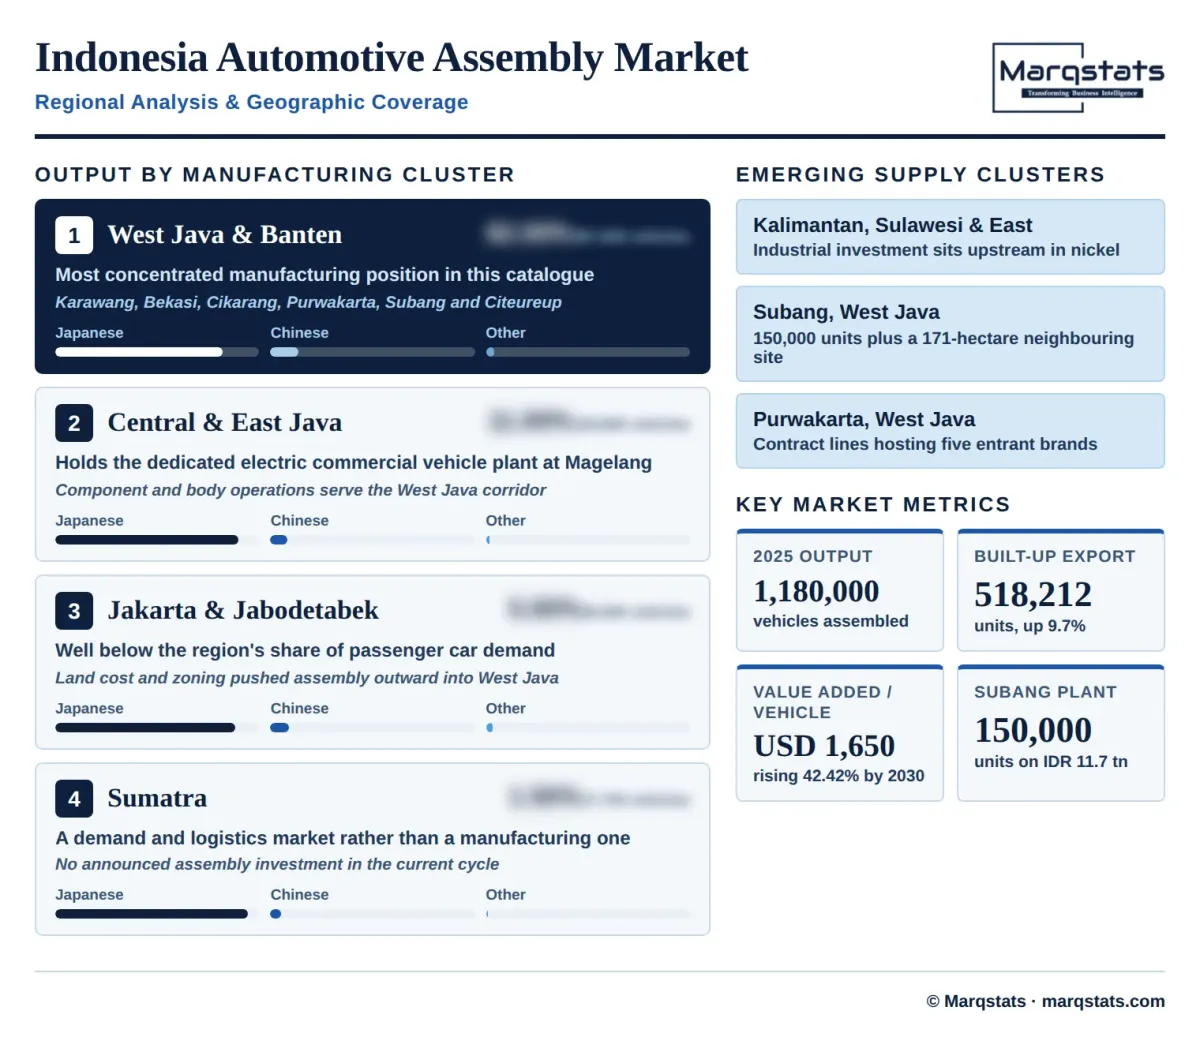
West Java and Banten account for an estimated 967,600 assembled vehicles in 2025, 82.00% of national output, the most concentrated manufacturing position in this catalogue. Karawang, Bekasi, Cikarang, Purwakarta, Subang and Citeureup all sit here, including the 150,000 unit plant opened in September 2026 and the 171 hectare site alongside it.
Central and East Java
Central and East Java account for an estimated 129,800 assembled vehicles, 11.00% of output. The cluster holds the dedicated electric commercial vehicle plant at Magelang, targeting 80% local content by 2028 on about IDR 5 trillion, alongside established component and body operations serving the West Java assembly corridor.
Jakarta and Greater Jabodetabek
Jakarta and the immediate metropolitan area account for an estimated 59,000 assembled vehicles, 5.00% of output, well below the region's 30.00% share of passenger car demand. Land cost and zoning have pushed assembly outward into West Java, leaving corporate, distribution and policy functions rather than production.
Sumatra
Sumatra accounts for an estimated 17,700 assembled vehicles, 1.50% of output. The island is a demand and logistics market rather than a manufacturing one, and no announced assembly investment in the current cycle is located here despite its share of national vehicle demand.
Kalimantan, Sulawesi and Eastern Indonesia
Kalimantan, Sulawesi and eastern Indonesia account for an estimated 5,900 assembled vehicles, 0.50% of output and the smallest manufacturing position. The region's industrial investment is concentrated in nickel processing rather than vehicle assembly, which places it upstream of this panel rather than inside it.
How Competition Is Evolving
The incumbent Japanese position is deep and slow-growing rather than threatened. Toyota reports cumulative Indonesian investment above IDR 100 trillion across five factories with 90% local production for domestic sales, Hino operates 75,000 units of capacity on about USD 112.5 million with roughly 1,547 workers, Isuzu has produced 300,000 units at Karawang since 2015, and Suzuki built 88% of what it sold in 2025 locally on sales above 64,000 units. Japanese marques hold an estimated 85.59% of assembled output and grow at 3.16%.
The Chinese challenge arrived through two routes at once. The first is greenfield: a 126 hectare plant at Subang opened on 3 September 2026 on IDR 11.7 trillion with 150,000 units of capacity, more than 5,000 employees and cumulative Indonesian sales approaching 100,000 units against a target of 200,000 by 2027. The second is contract assembly, where Geely, Leapmotor, Polytron, Farizon and DFSK product is built in plants they do not own.
The contract assemblers themselves are becoming the contested asset. One Purwakarta plant hosts three unrelated brands on one line, a second began Leapmotor assembly in August 2026 at five vehicles an hour rising to seventeen, and in May 2026 a Chinese manufacturer bought 90.1% of an Indonesian electric vehicle assembler outright, with the seller retaining 9.9%. Owning the assembler converts a flexible arrangement into captive capacity without greenfield cost or delay.
Companies Covered
The report profiles 15+ companies with full strategy and financials analysis, including:
Recent Market Activity
Table of Contents
Coverage & Segmentation
The analysis measures assembly value added by vehicle assembly operations in Indonesia from 2021 to 2030, with 2025 as the base year and 2026 to 2030 as the forecast period, covering manufacturer-owned plants and third-party contract assemblers, full-process manufacturing, complete knocked down and semi knocked down work, local content bands, output destination and vehicle type, together with the local content framework that governs process depth. Vehicle retail value is excluded and sized separately at USD 10.33 billion for passenger cars alone, as is component manufacturing value, because assembly value added sits inside the vehicle rather than alongside it. Knocked down sets exported for assembly elsewhere are excluded from the vehicle count at 63,263 sets in 2025. Values are expressed in USD at a disclosed constant IDR 16,800 per USD.
Coverage spans two assembly models, three process depths, three brand origin groups, three local content bands, two output destinations and two vehicle types, with five regional clusters analysed on assembled volume. Output is carried as the unit series at 1,180,000 vehicles in 2025 and assembly value added per vehicle as a derived series at USD 1,650, and both are published alongside the value panel because value rises faster than volume and a single rate would conceal why. Fifteen entities are profiled across manufacturer-owned assemblers, contract assemblers and entrants.