Market Snapshot
Middle bar: base-year value × (1 + CAGR), rounded to two decimals. This is a calculated illustration, not a separately researched annual estimate.
The India smart mobility market reached USD 28.80 billion in 2025 and is projected to reach USD 58.50 billion by 2030, expanding at a CAGR of 15.20% across the forecast period. This consolidated valuation combines app-based shared transportation, connected passenger telematics, and intelligent transport system (ITS) infrastructure into a single, software-driven transportation system. Growth is attributed to rapid urbanization, near-universal smartphone-led transit dispatch, and the enforcement of commercial-fleet safety mandates across the country.
The ride-hailing and shared mobility segment anchored the market at approximately USD 22.25 billion in 2025, supported by the expansion of digital payments and Unified Payments Interface (UPI) penetration. Embedded connectivity, real-time diagnostics, and digital infotainment expanded the connected vehicle and telematics segment to roughly USD 5.16 billion, as manufacturers standardized factory-fitted connectivity to capture premium consumer demand. The balance of the market is held by smart-city ITS deployments, automated tolling, and unified public-transit ticketing systems.
Demand is increasing owing to the rollout of high-speed 5G connectivity, electric-vehicle shared-fleet expansion, and automated vehicle-location-tracking infrastructure. The market is moderately fragmented, with ride-hailing platforms, telematics hardware suppliers, and ITS integrators competing across overlapping value pools. West and North India, anchored by Delhi-NCR and Maharashtra, formed the largest regional cluster in 2025, while South India, led by Bengaluru, Hyderabad, and Chennai, recorded the fastest growth.
The supply pipeline for embedded smart-mobility solutions is reinforced by sustained new passenger-vehicle registrations, which ranged between roughly 320,000 and 557,000 units per month across the latest reporting cycle. Each new connected-ready vehicle expands the addressable base for factory-fitted telematics, over-the-air diagnostics, and subscription connectivity services. This physical inflow, combined with mandatory tracking hardware on commercial fleets, underpins the structural expansion of the connected-vehicle layer through the forecast period.
Key Takeaways
Market Overview & Analysis
Report Summary
The India smart mobility market represents the convergence of high-speed telecommunications, digital payments, and next-generation urban planning into a unified transportation system. The sector has matured from standalone portable GPS units into a deeply integrated Internet-of-Things ecosystem, supported by a mobile subscription base exceeding 1.14 billion active cellular connections. This scale of digital infrastructure provides the connectivity backbone on which ride-hailing dispatch, fleet telematics, and adaptive traffic management operate.
Public investment under the central Smart Cities Mission has reinforced this transition. By the close of 2024, more than 1,100 smart-mobility projects worth approximately USD 14.73 billion had been completed, with several hundred more in advanced execution. These projects, combined with real-time UPI transaction volumes and Vahan registration data, establish a digital framework that enables city authorities to deploy adaptive signals, smart-parking management, and integrated transit networks across Tier-1 and Tier-2 hubs.
Demand-side momentum aligns with the NITI Aayog transport roadmap, which targets a sizeable increase in the share of public and shared mobility across urban passenger miles by 2030. Growth is attributed to urban congestion, the high capital cost of vehicle acquisition, and a structural consumer shift from asset-heavy private ownership toward on-demand, platform-led access. Online ride-hailing alone accounted for an estimated 5.9 million daily rides in 2025, reflecting the depth of smartphone-led transit adoption.
Financing and digital integration represent the most significant areas of margin expansion for smart-mobility operators. Where legacy lenders maintained a conservative stance on underwriting shared assets owing to depreciation risk, non-banking financial companies and fintech platforms have captured a substantial share of used and shared-vehicle financing, using real-time telematics and positioning telemetry to monitor utilization and adjust loan-to-value ratios. In parallel, open-network models such as the Open Network for Digital Commerce and allied municipal platforms are reshaping aggregator economics by eliminating the commissions typically charged by legacy platforms, allowing drivers to retain a far larger share of fares while lowering consumer-facing prices.
Unified fare collection forms the third pillar of the ecosystem. The National Common Mobility Card, launched in 2019 under the Ministry of Housing and Urban Affairs and the National Payments Corporation of India, applies a contactless, dual-interface standard across metro, bus, toll, and retail use cases. Progressive rollout across transit operators is consolidating fragmented closed-loop systems, moreover the standard's open-loop design positions it as the backbone for inter-modal ticketing as acceptance widens.
The market's structural maturity reflects a decade-long shift from standalone digital experiments toward an integrated transport system, framed at the policy level around objectives of common, connected, convenient, congestion-free, charged, clean, and cutting-edge mobility. This framing links ride-hailing, telematics, electrification, and ITS under a single national agenda, furthermore it aligns private-platform investment with public infrastructure spending. The result is a reinforcing cycle in which connectivity, payments, and registration data compound to lower the cost of deploying new mobility services across urban hubs. As 5G coverage deepens and electric shared fleets expand, the data and infrastructure base established through 2025 is positioned to support accelerating service rollout through 2030.
Market Dynamics
Key Drivers
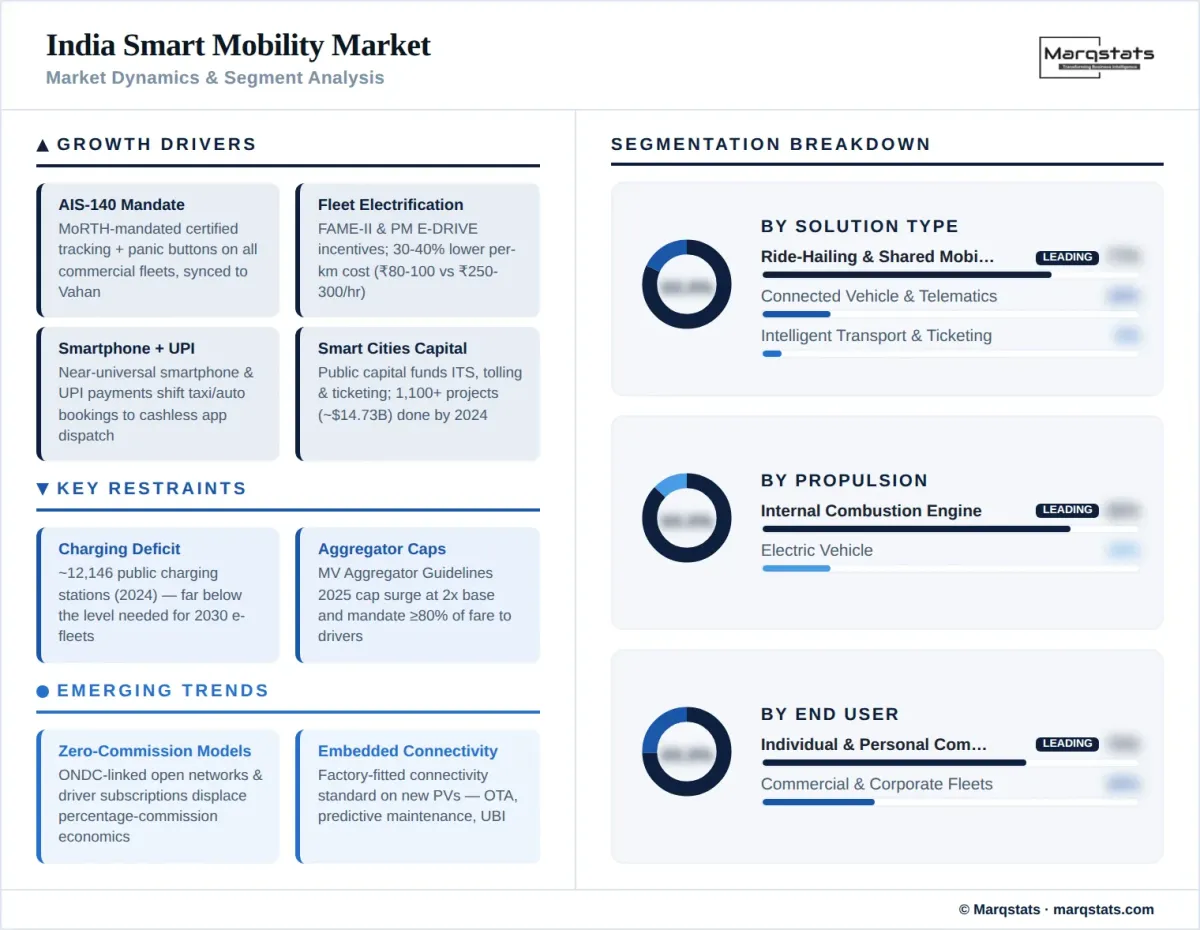
Mandatory AIS-140 compliance enforced by the Ministry of Road Transport and Highways requires certified vehicle location tracking devices across all commercial transport vehicles, creating a recurring telematics hardware and subscription base.
- Central electric-vehicle incentives under FAME-II and the PM E-DRIVE scheme accelerate conversion of corporate and ride-hailing fleets to electric powertrains, owing to operating-cost savings of 30%-40% over a four-year lifecycle, with electricity costs of roughly INR 80-100 per hour against INR 250-300 per hour for fossil-fuel propulsion.
- Near-universal smartphone penetration and UPI-led digital payments lower transaction friction, supporting the migration of taxi and auto bookings to app-based dispatch and enabling instant, cashless fare settlement at scale across metropolitan and emerging markets.
- Public capital deployed through the Smart Cities Mission funds ITS, automated tolling, and unified ticketing, expanding the addressable infrastructure base for smart-mobility solutions and crowding in private investment around adaptive signalling, command centres, and transit digitization.
- A mobile subscription base exceeding 1.14 billion connections supplies the connectivity layer for embedded telematics, real-time tracking, and connected-vehicle services.
Key Restraints
- A severe deficit in public charging infrastructure constrains shared-fleet electrification; the installed base of roughly 12,146 public charging stations in 2024 remains far below the level required to support projected electric fleets by 2030.
- The Motor Vehicle Aggregator Guidelines 2025 cap surge pricing at twice the base fare and require drivers to receive at least 80% of the applicable fare, compressing platform take-rates and limiting cash-burn-led expansion across competitive urban corridors.
- Regulatory uncertainty around bike-taxi operations across states, including court-ordered suspensions, introduces operating-model risk for last-mile platforms and complicates multi-state expansion planning.
- Fragmented inter-modal interoperability and inconsistent NCMC acceptance across transit operators slow the unification of urban ticketing.
Key Trends
- Driver-subscription and zero-commission models, including open-network platforms such as ONDC-linked services, are displacing percentage-commission economics and reshaping aggregator margins, with incumbents adopting fixed daily access fees to retain driver supply.
- Embedded factory-fitted connectivity is becoming standard on new passenger vehicles, expanding the connected-vehicle base that feeds the telematics segment and enabling over-the-air updates, predictive maintenance, and usage-based insurance.
- Dual-constellation positioning combining GPS with India's indigenous NavIC system is being integrated into AIS-140 hardware for higher location accuracy.
- Non-banking financial companies and fintech lenders increasingly underwrite shared and used vehicles using real-time telematics, capturing a sizeable share of shared-vehicle financing and dynamically adjusting loan-to-value ratios.
Market Segmentation
This segment commanded the largest share of market value in 2025, anchored by app-based cab, auto, and bike-taxi dispatch. Growth is driven by urban congestion, affordability relative to private ownership, and the expansion of digital payments. Online bookings captured the majority of taxi transactions, while bike taxis emerged as the fastest-scaling sub-category for last-mile connectivity. Corporate and enterprise contract mobility, peer-to-peer carpooling, and micro-mobility form adjacent sub-pools that broaden the segment beyond conventional cab hailing.
Pricing structure within the segment is being reset by the migration from percentage commissions toward fixed daily driver subscriptions, a shift that improves driver take-home earnings and lowers consumer fares. Metro stations and bus stops define the core last-mile demand corridor, where short trips are too far to walk and uneconomic for full cab fares, positioning autos and bike taxis as the dominant access mode. The combined effect is a deepening of transaction frequency rather than ticket size, supporting volume-led expansion across the forecast period.
Embedded connectivity, real-time diagnostics, and infotainment expanded this segment as manufacturers standardized factory-fitted modules, feeding the adjacent India telematics and fleet safety systems market. Commercial-fleet telematics, reinforced by AIS-140 mandates, sustains a recurring subscription base across taxis, buses, and goods carriers. Demand is increasing owing to insurance-telematics and fleet-optimization use cases. Embedded eSIM connectivity and integrated 4G or LTE interfaces now reach a substantial share of the active connected-vehicle base, providing the data layer for remote diagnostics, geofencing, and driver-behaviour scoring.
Funded substantially through the Smart Cities Mission, this segment covers adaptive traffic signals, automated tolling, smart parking, and unified ticketing. The RuPay qSPARC NCMC underpins interoperable fare collection across metro, bus, and toll networks. Growth is attributed to public capital deployment and digitized fare-collection mandates. Integration with Vahan registration data and municipal command-and-control centres allows authorities to coordinate signal timing, enforcement, and transit scheduling from a single data layer.
Internal combustion engine vehicles retained the majority of the shared and commercial fleet base in 2025, reflecting the installed vehicle pool and charging-infrastructure constraints. The segment's share is contracting as fleet operators prioritize lifecycle-cost reductions and emission compliance. ICE vehicles continue to dominate intercity and rural routes, where charging density is thin and range predictability remains a procurement consideration for operators.
Electric shared fleets are the fastest-growing propulsion sub-segment, supported by FAME-II and PM E-DRIVE incentives and lower per-kilometre operating costs. Dedicated all-electric operators and corporate fleet conversions anchor demand, however the pace of scaling is governed by public charging availability. State-level aggregator electrification targets, introduced under the 2025 guidelines, add a regulatory pull factor that reinforces the commercial case for fleet conversion in metropolitan corridors.
Personal commuters represent the bulk of ride-hailing and ticketing transaction volume, served by app-based cabs, autos, bike taxis, and NCMC-enabled public transit. Demand is driven by affordability and last-mile convenience across metropolitan corridors. This cohort is the primary adopter of subscription pricing and open-network platforms, where lower fares and transparent commissions shape repeat usage.
Corporate mobility contracts, employee-shuttle services, and goods carriers anchor telematics and AIS-140 hardware demand. Growth is attributed to compliance mandates, fleet-electrification programs, and total-cost-of-ownership optimization. Commercial operators increasingly procure bundled connectivity, tracking, and fleet-management software as a single subscription, deepening the recurring-revenue component of the connected-vehicle segment.
By Geography
West and North India
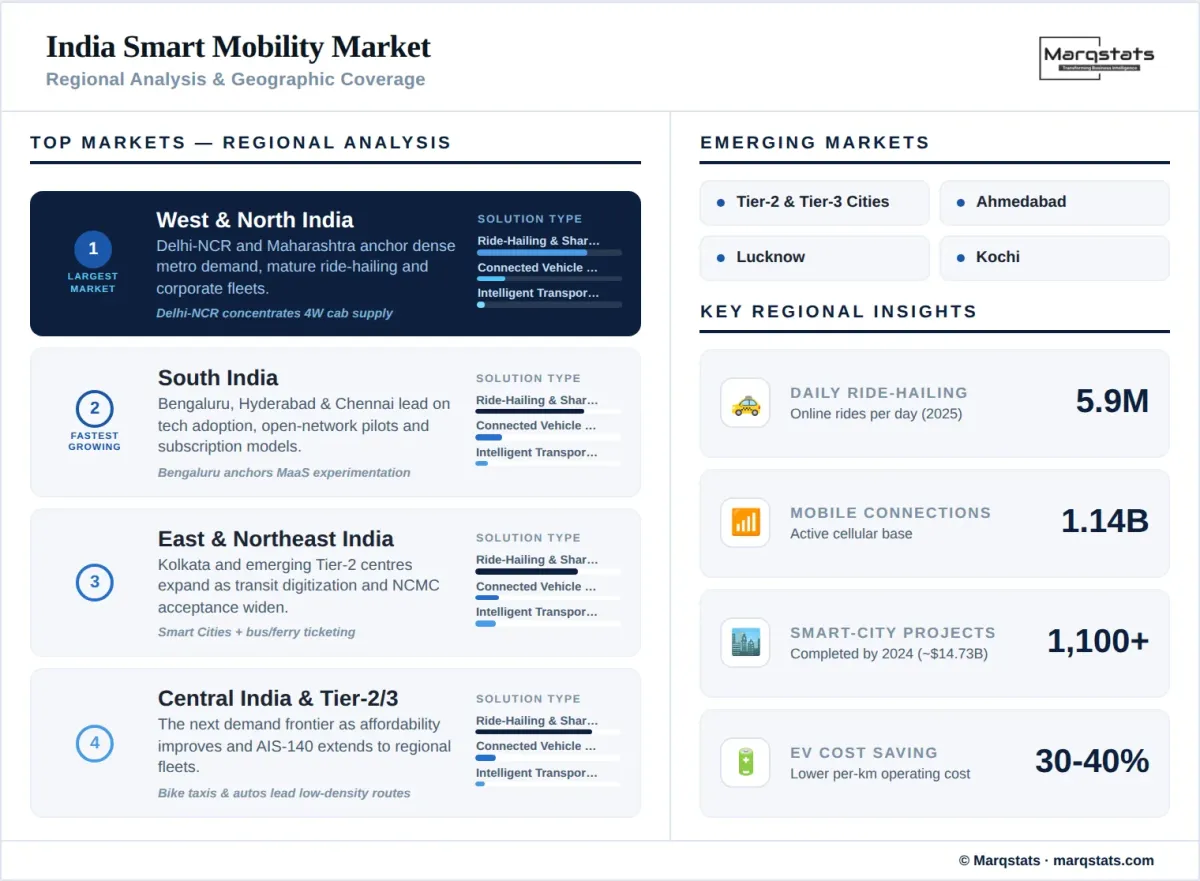
Anchored by Delhi-NCR and Maharashtra, this cluster formed the largest regional market in 2025. Dense metropolitan demand, mature ride-hailing penetration, and concentrated corporate-fleet activity sustain the region's position. Delhi-NCR also concentrates a significant share of four-wheeler cab supply, reinforcing its role as the primary demand pool. Maharashtra contributes through Mumbai and Pune, where employee-shuttle contracts and commercial-fleet telematics adoption run ahead of the national average.
South India
Comprising Bengaluru, Hyderabad, and Chennai, South India is the fastest-growing region, supported by a technology-oriented population, open-network mobility pilots, and high adoption of subscription and zero-commission platforms. Bengaluru anchors much of the country's mobility-as-a-service and open-mobility experimentation.
East and Northeast India
Anchored by Kolkata and emerging Tier-2 centres, the eastern region is expanding from a smaller base as public-transit digitization and NCMC acceptance widen. Growth is attributed to Smart Cities Mission deployments and rising smartphone-led dispatch across regional hubs. Bus-network digitization and ferry-and-metro ticketing integration represent near-term expansion vectors as municipal authorities extend cashless fare collection.
Central India and Tier-2 and Tier-3 Cities
Central India and smaller urban centres represent the next demand frontier, with ride-hailing and connected-vehicle penetration rising as affordability improves and AIS-140 compliance extends to regional commercial fleets. New passenger-vehicle registrations in these markets supply a widening pool of connected-ready vehicles. Bike taxis and autos lead adoption in lower-density corridors, where four-wheeler cab economics remain less competitive than in metropolitan markets.
How Competition Is Evolving
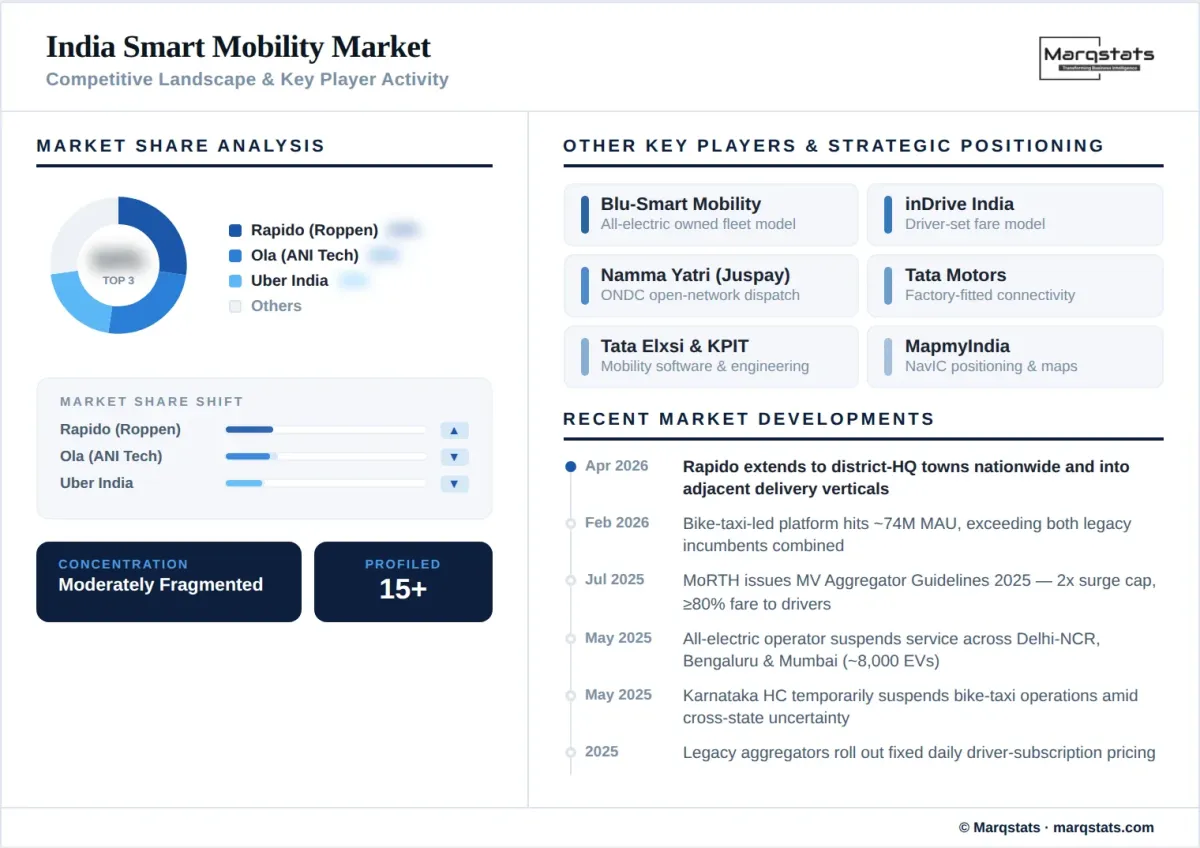
The India smart mobility market is moderately fragmented, with distinct competitive pools across ride-hailing, telematics hardware, and ITS integration. In app-based mobility, the historical duopoly has given way to a three-way contest, as a bike-taxi-led challenger overtook the incumbents in monthly active users during early 2026. Competition centres on driver economics, with subscription and zero-commission models pressuring percentage-commission structures.
Companies compete through fleet electrification, geographic expansion into Tier-2 and Tier-3 cities, and platform diversification into food delivery and adjacent services. In the connected-vehicle and telematics pool, automotive component suppliers, navigation specialists, and engineering-services firms supply AIS-140 hardware, NavIC-enabled positioning, and embedded connectivity stacks to manufacturers and fleet operators.
The financing layer is increasingly contested by non-banking financial companies and fintech lenders, which use telematics telemetry to underwrite shared and used vehicles and to manage credit risk. Open-network models backed by public digital infrastructure are reshaping aggregator economics by lowering distribution costs and improving driver retention, while incumbents respond with fixed daily driver-subscription pricing.
Within ride-hailing, ANI Technologies and Uber India Systems retain deep four-wheeler cab networks and national coverage, while Roppen Transportation Services has scaled rapidly through bike-taxi and subscription economics and Blu-Smart Mobility pursued an all-electric, owned-fleet model. Juspay Technologies anchors open-network dispatch through municipal and ONDC-linked platforms. In the connected-vehicle and telematics pool, Tata Motors and Mahindra & Mahindra embed factory-fitted connectivity, Tata Elxsi and KPIT Technologies supply software and engineering services, and UNO Minda, Bosch, Continental, and C.E. Info Systems provide hardware, sensing, and NavIC-enabled positioning. Public-transit technology providers such as Chalo Mobility extend the ITS and ticketing layer into bus networks.
Competitive intensity is shaped by funding cycles, platform consolidation, and the migration of driver supply between models. The exit of an all-electric operator during 2025 redistributed users toward incumbents and emerging players, while subscription-led platforms attracted driver loyalty through higher take-home economics. Vertical expansion into food and parcel delivery extends platform monetization beyond mobility, and partnerships across original equipment manufacturers, telematics suppliers, and financiers are deepening as fleet electrification and compliance hardware become standard procurement requirements.
Companies Covered
Companies covered in the report include:
Recent Market Activity
Table of Contents
Coverage & Segmentation
This report analyzes the structural dynamics of the India smart mobility market, providing value-based forecasts spanning 2026 through 2030, with a 2025 base year and a 2021-2025 historical period. The study covers ride-hailing and shared mobility, connected vehicle and telematics, and intelligent transport systems and smart ticketing, segmented further by propulsion and by end user. Regional coverage spans West and North India, South India, East and Northeast India, and Central India together with Tier-2 and Tier-3 city clusters.
The analysis draws on certified registration and dispatch data from the Ministry of Road Transport and Highways (Vahan), retail registration statistics from automobile dealer associations, Smart Cities Mission project disclosures, and digital-payment transaction data. Findings were validated through 40+ primary interviews with ride-hailing executives, telematics hardware manufacturers, municipal smart-city project managers, and digital-payment providers. The report quantifies market size and growth across solution, propulsion, and end-user dimensions, profiles the competitive structure, and maps the regulatory framework governing aggregators, commercial-fleet tracking, and interoperable ticketing.