Market Snapshot
Middle bar: base-year value × (1 + CAGR), rounded to two decimals. This is a calculated illustration, not a separately researched annual estimate.
The Europe electric inland shipping market is estimated at USD 53.1 million in 2025 and is projected to reach USD 252.6 million by 2030, at a CAGR of 36.60%. Vessel deliveries rise from 8 a year to 32, and battery container deliveries from 10 to 66. In euros the market grows from 48.5 million to 215.9 million, a CAGR of 34.81%. Battery systems and charging infrastructure together account for 47.5% of the 2030 figure.
Market size and forecast figures are generated using Marqstats' proprietary estimation framework, updated as of September 2026.
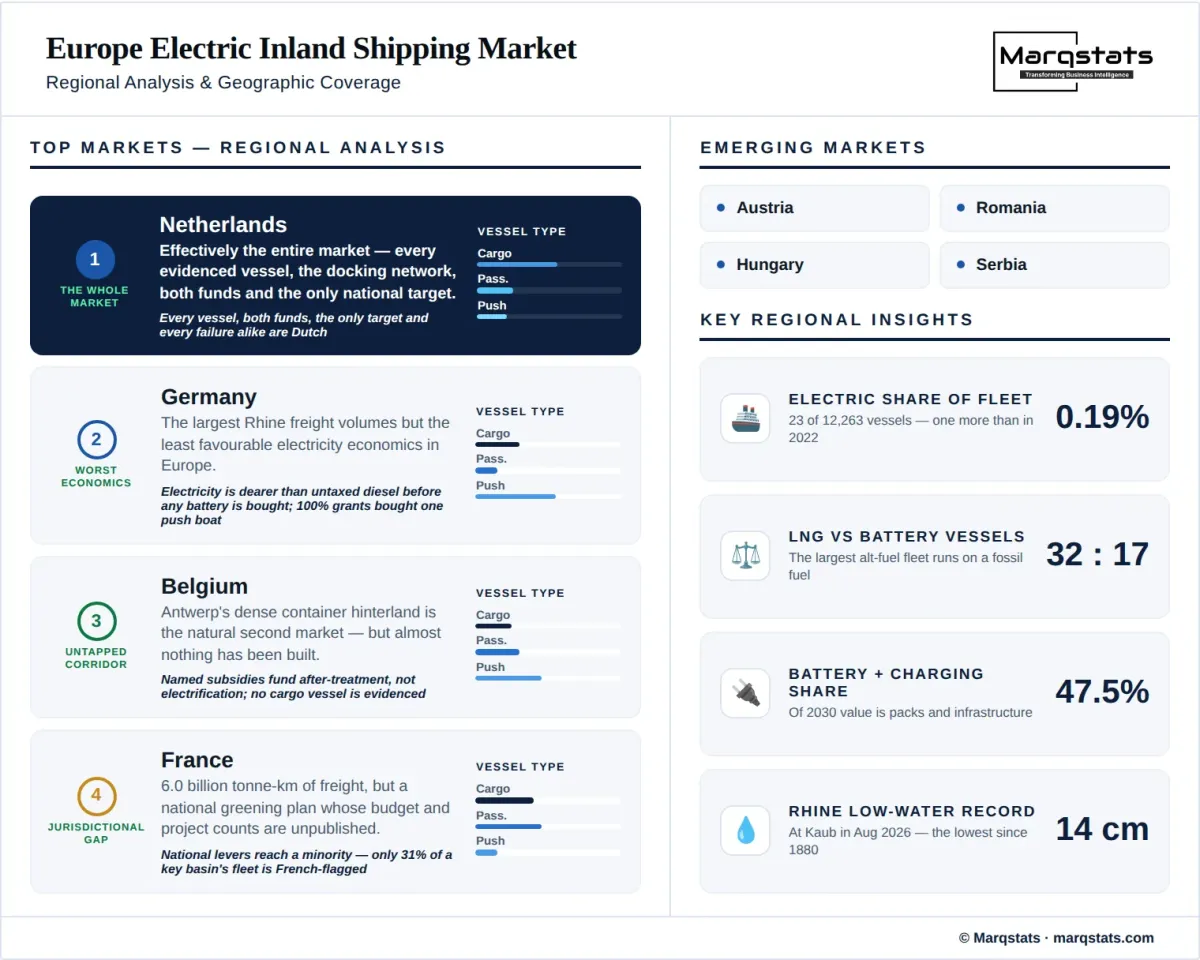
The scale needs stating before anything else. Europe's inland waterway fleet holds 13,392 vessels on a register basis and 12,263 on the operating basis the sector's own financing work uses. Of those, 17 are battery-only and 6 are diesel-battery hybrids — 23 vessels, or 0.19% of the operating fleet. The comparable 2022 count was 16 battery-electric propulsion systems, on a definition close but not identical, so roughly three years of announcements produced a net increase of one vessel. There are 32 LNG vessels in service, nearly double the 17 battery-only vessels and running on a fossil fuel. Readers should note that the delivery volumes forecast here exceed identified activity: the evidence base carries two freight and work hulls entering European battery-electric service in 2025 against this report's modelled 8, the difference being ferry, passenger and push-boat deliveries for which no published series exists. This report covers inland waterway vessels holding a Rhine Vessel Inspection Certificate or a Union certificate, together with the battery systems, swappable battery containers, shore charging and docking infrastructure serving them. Seagoing and short-sea vessels are excluded.
Two structural facts explain why the number is so small, and neither is technological. The first is that inland bunker gasoil is exempt from excise duty, and the exemption is not merely a policy choice: it is optional under the EU Energy Taxation Directive but mandatory under the 1952 Strasbourg Agreement, which a state may leave only on a year's notice. Untaxed gasoil delivers shaft work at roughly EUR 0.275 per kilowatt-hour. European industrial electricity delivers it at about EUR 0.224 on the EU average and EUR 0.276 in Germany — line-ball with diesel and about 0.4% dearer on these assumptions, meaning German shore power buys no operating advantage at all before a battery is purchased. The second is that FuelEU Maritime explicitly excludes inland waterways, and the EU Emissions Trading System excludes them through its 5,000 gross tonnage threshold. The binding carbon price on a European inland vessel is ETS2 from 2027, in the Netherlands alone, by national opt-in, at around 13 cents a litre.
Key Takeaways
Market Overview & Analysis
Report Summary
This report sizes the Europe electric inland shipping market — battery-electric and hybrid-electric vessels operating on European rivers and canals under a Rhine Vessel Inspection Certificate or a Union certificate, together with the battery systems, swappable battery containers, shore charging points and swap docking stations that serve them. Coverage spans dry cargo vessels, tankers, container vessels, push boats, ferries and passenger vessels. Seagoing and short-sea shipping is excluded. The boundary matters because the two markets differ in vessel economics, regulatory exposure and, critically, in who owns the battery: a seagoing vessel carries its own, while a large share of the inland fleet's installed energy belongs to an energy provider rather than to the ship.
The commissioning premise for this study was that battery-container vessels are statistically invisible, because the batteries are not owned by the vessel and therefore appear in no vessel-electrification count. Testing it produced a more precise and more useful answer. The vessels themselves are counted: they hold Union certificates and are battery-propelled, so the river commission's propulsion census records them. What is invisible is the battery, the capital and the revenue. From 1 January 2026 the European technical standard requires a fixed lithium-ion battery's manufacturer, serial number, type and installation date to be entered on the vessel certificate; a swapped container triggers none of that, and the same revision defines a swappable tank for hydrogen only. The European statistical series for inland waterway transport carries no propulsion dimension at all, for any fuel.
That has a direct consequence for sizing. In the swap model the larger half of the capital sits on a leasing company's balance sheet rather than a ship's, so any market built from vessel investment, newbuild registration or shipyard order books misses it. This report prices it explicitly: battery containers are 22.0% of 2030 market value, and charging and docking infrastructure a further 25.5%. Dutch policy compounded the effect rather than correcting it: the EUR 15.1 million electrification scheme now expiring was written around the swappable container and expressly excluded fixed batteries, so public money paid for the one architecture the vessel certificate cannot record. Its EUR 230 million successor has broad eligibility and carries no such restriction.
Market Dynamics
Key Drivers
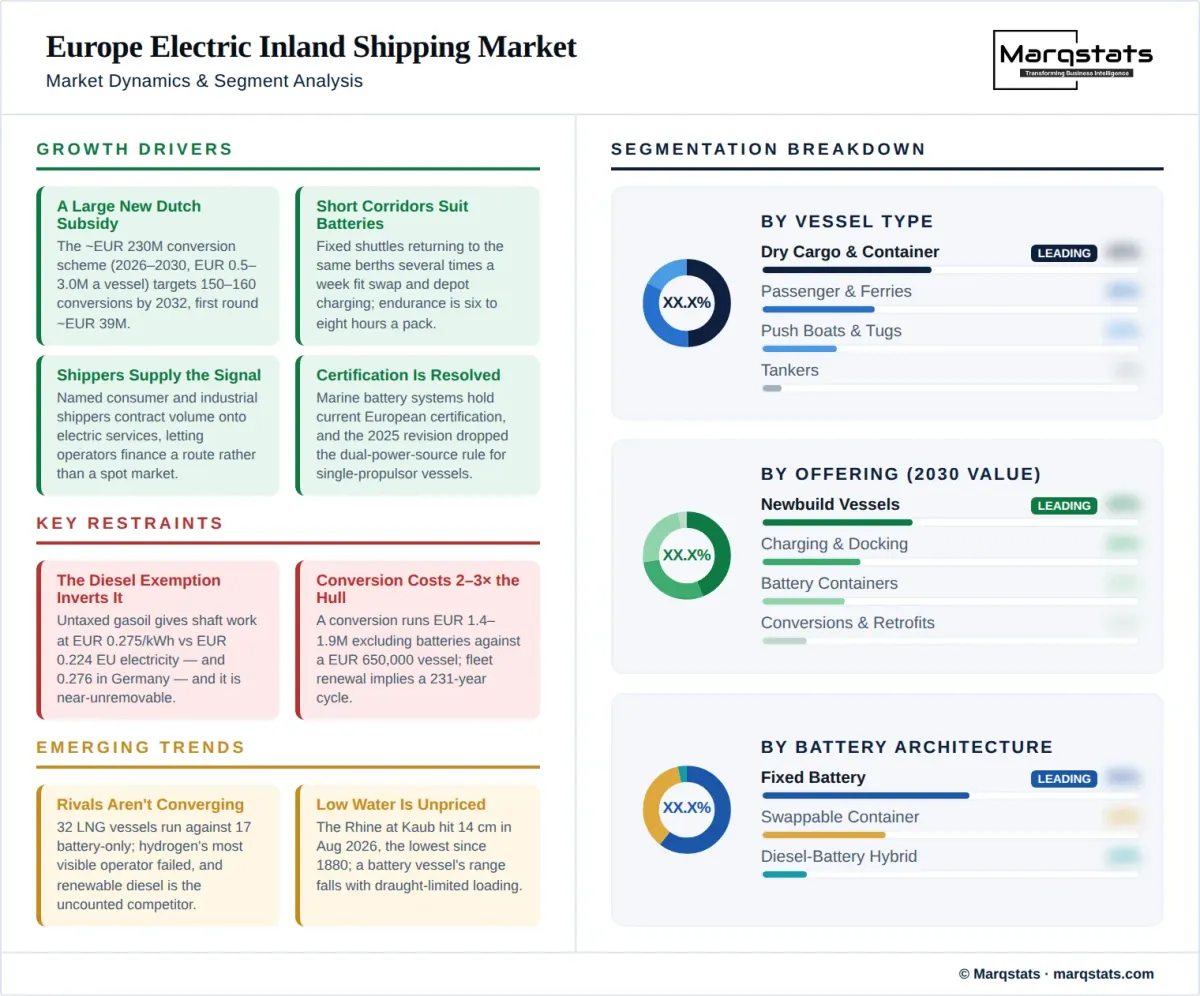
A large new national subsidy is the single identifiable driver of the forecast. The Dutch propulsion-conversion scheme runs to roughly EUR 230 million across 2026 to 2030, at EUR 0.5 to 3.0 million per vessel, with a first round near EUR 39 million in summer 2026 and a stated target of 150 to 160 vessels converted by 2032. It covers battery-electric, hydrogen fuel cell, hydrogen combustion, methanol and hybrid conversions, and shore charging may be included in collaborative applications.
Duty cycles on the shorter inland corridors genuinely suit battery propulsion. Vessels on fixed short shuttles between a port and an inland terminal return to the same berths several times a week, which is the operating pattern battery swapping and depot charging are designed around. Published endurance on the swap model is six to eight hours per pack with a roughly three-hour recharge.
Shipper commitments are supplying the demand signal that freight rates do not. Named consumer and industrial shippers have contracted volume onto electric inland services, and those commitments are what allow an operator to finance a vessel against a route rather than a spot market. What the shipper buys is a volume commitment; a disclosed price premium is not visible in any published contract Marqstats could retrieve.
The technical and certification barriers are now largely resolved. Marine battery systems from established European suppliers hold current certification under the European technical standard, and the 2025 revision quietly removed the dual-power-source requirement for single-propulsor electric vessels — a genuine cost reduction that received almost no trade coverage.
Grants are available at unusually high intervention rates. The Dutch scheme pays a substantial share of eligible conversion cost, and German federal support for zero-emission inland newbuilds reaches up to 100% — though the German programme runs only to the end of 2026 and its award count is not published. Capital availability is not the constraint on this market, which is precisely why the low delivery counts are diagnostic rather than incidental.
Key Restraints
★ The excise exemption on inland bunker gasoil removes the operating-cost case and cannot easily be withdrawn. It is optional under the EU Energy Taxation Directive but mandatory under the 1952 Strasbourg Agreement, and the river commission's own legal opinion is that it cannot be removed unilaterally. Untaxed gasoil delivers shaft work at about EUR 0.275 per kilowatt-hour against EUR 0.224 for EU-average industrial electricity and EUR 0.276 in Germany. On the German figure, electricity is already the more expensive fuel before a single battery is purchased.
Conversion economics fail against hull values across most of the addressable fleet. At EUR 1.4 to 1.9 million excluding batteries, a conversion is 215% to 292% of the asking price of a typical older vessel. More than EUR 11 million of a EUR 15.1 million Dutch electrification grant was still unspent going into 2025 — on a scheme whose eligibility was restricted to the swappable-container architecture, so uptake failure and eligibility narrowness are both live explanations and neither is a subsidy-rate story.
Grid connection is a hard physical constraint at exactly the ports where demand would concentrate. The Rotterdam region carries a connection queue measured in the thousands of megawatts with no new capacity available until the early 2030s, and megawatt-scale vessel charging competes for that capacity against every other electrification project in the same grid.
Supplier fragility runs through the whole value chain. Ebusco Holding N.V. is both a 40% shareholder in Zero Emission Services and the sole manufacturer of its current-generation pack, and is close to insolvency; Leclanché is carrying negative equity; ENGIE sold its stake eleven months after commissioning the first docking station. A market with this few vessels cannot absorb the failure of a single supplier.
Key Trends
Competing fuels are not converging on electricity. There are 32 LNG vessels in service against 17 battery-only vessels, so the largest alternative-fuel fleet in European inland shipping runs on a fossil fuel and is a dead end against the sector's own 2050 objective. Hydrogen has attracted more announced vessels than its delivery record supports, and its most visible operator has failed.
Renewable diesel is the abatement pathway nobody is counting, and it competes directly with electrification. A vessel running on hydrotreated vegetable oil is statistically identical to a diesel vessel — there is no propulsion or fuel dimension in the European inland transport series in which it could appear — and the Dutch instrument after the mandatory emission label was dropped is a blending obligation rather than a vessel mandate.
Battery capacity per vessel is rising faster than vessel count. Marqstats models annual battery deliveries rising from 35 megawatt-hours in 2025 to 215 megawatt-hours in 2030, a 43.83% CAGR against 31.95% for vessel deliveries, as swap-model vessels carry multiple packs and newbuilds specify larger fixed systems.
Low water is the demand risk the sector does not price. August 2026 recorded the Rhine at Kaub at 14 centimetres with a forecast of 9, the lowest since records began in 1880 and below the 25 centimetres of 2018. The two worst years for EU inland waterway transport in a decade were 2018 at minus 10.9% and 2022 at minus 9.8%, both worse than the pandemic year. No programme or national policy document reviewed contains a low-water sensitivity analysis, and a battery vessel's range falls with draught-limited loading.
Market Segmentation
The largest value segment and the smallest unit count. Marqstats models 3 deliveries in 2025 rising to 12 in 2030, at 40.0% of 2030 market value. No published newbuild price pair exists for an electric against a conventional inland vessel, so vessel values here are Marqstats estimates. ★ Note the basis: newbuilds are counted at whole-vessel supply price while conversions are counted at electrification content only, so the two segments are not on the same footing and should not be compared. Most of this segment's value is hull, steel and outfitting rather than electric content — the sector's published figures put a diesel engine installation at about EUR 20,000 against an electrification base cost of EUR 350,000 to 850,000.
The segment the new Dutch subsidy is aimed at, and the one whose economics are worst. Marqstats models 5 conversions in 2025 rising to 20 in 2030, a cumulative 61 across the subsidy window, at 12.5% of 2030 market value. Conversion runs EUR 1.4 to 1.9 million excluding batteries — derived from the EUR 550,000 to 750,000 per-vessel caps of the expiring 2025 electrification scheme at its 40% grant rate, and cross-checked against published electrification base costs. It is not a quoted price, and the successor scheme's EUR 3.0 million ceiling implies materially higher costs on the largest conversions, so the band should be read as a lower bound for the segment average.
The off-balance-sheet half of the market, and the reason conventional vessel-based sizing understates it. Marqstats models 10 container-equivalent packs in 2025 rising to 66 in 2030, at 22.0% of 2030 market value, on a published unit cost near EUR 1 million per pack, at a nameplate 2.9 megawatt-hours against roughly 2.6 megawatt-hours usable on the manufacturer's own product page. In the swap architecture this asset belongs to the energy provider, so it appears in no shipowner's capital expenditure and on no shipyard's order book. No operator, shareholder or funder publishes a pack count anywhere: the evidenced European fleet is roughly twenty second-generation packs ordered plus at least two first-generation units, and ordered is not in service. This series carries no published anchor in any year.
Modelled at EUR 7 million in 2025 rising to EUR 55 million in 2030, or 25.5% of the market. No published per-installation cost exists for an inland charging point or swap docking station; the one European figure available, near EUR 4.6 million per connection point, is for seagoing container terminals and is not transferable to an inland berth. This segment is a Marqstats construction and should be read as an order of magnitude.
The core of the addressable market and the location of every flagship project. These are the vessels running fixed inland shuttles between deep-sea ports and hinterland terminals, and the ones the swap-container model was designed for. They are also the vessels whose hulls are oldest and whose conversion economics are worst.
A small but technically favourable segment. Push boats operate on short, repetitive, high-power duty cycles from fixed bases, which suits containerised battery power, and several of the evidenced European electric units are of this type. Fleet numbers are small enough that a handful of deliveries moves the segment materially.
The segment with the most operating electric units relative to its size, because short fixed crossings and municipal ownership remove both the range problem and the payback problem. Public operators buy against service obligations and air-quality commitments rather than freight economics, which insulates this segment from the fuel-tax inversion that governs cargo.
The least feasible segment on published technical assessment, and effectively absent from the electric fleet. Large liquid cargo vessels run long routes at high installed power, which is the duty cycle battery propulsion serves worst, and their regulatory and safety requirements add further cost to any conversion.
By Geography
Netherlands
Effectively the whole market. Every evidenced battery-container vessel, the docking station network, the EUR 50.2 million growth-fund award and the EUR 230 million conversion scheme are Dutch, as is the only national zero-emission vessel target and the only national ETS2 opt-in covering inland shipping from 2027. It is also where the failures are: the hydrogen operator's bankruptcy and the electric-barge venture's seven-year non-delivery are both Dutch.
Germany
The largest inland freight volumes on the Rhine and the least favourable electricity economics in Europe. German industrial electricity delivers shaft work at roughly EUR 0.276 per kilowatt-hour against EUR 0.275 for untaxed gasoil, which makes the operating case neutral to negative before capital. Federal support reaches up to 100% for zero-emission newbuilds, but the programme runs only from 2024 to the end of 2026, its award count is not published, and no German battery-electric inland cargo vessel appears in the European census. German federal money did deliver one vessel — roughly EUR 8 million of a EUR 13 million project for a single 20-metre push boat — which is a fair measure of what 100% intervention has bought.
Belgium
The Antwerp hinterland is among Europe's densest inland container corridors and the natural second market for fixed-shuttle electrification, but almost nothing has been built. Flanders' named greening subsidy funds exhaust after-treatment — particulate filters and selective catalytic reduction — rather than electrification, and no Belgian battery-electric inland cargo vessel is evidenced. The port authority's electric harbour tug and its 1.5 megawatt charger are the only evidenced electric assets, and neither is an inland freight vessel. No national target comparable to the Dutch one exists.
France
French inland freight ran 6.0 billion tonne-kilometres in 2024, about 4.9% of EU transport performance, and the national greening instrument is the fleet modernisation and innovation plan run by the waterway authority. Its budget, grant rates and project counts are not published, and no French battery-electric inland vessel appears in the evidence base. The structural obstacle is jurisdictional as much as financial: on the Nord-Pas-de-Calais basin the operating fleet fell 25% to 711 vessels in 2024 while tonnage rose 5.2%, and only 31% of the vessels using that basin are French-flagged, so national policy levers reach a minority of the traffic.
Danube Countries and Rest of Europe
Austria, Hungary, Romania, Bulgaria and Serbia carry the second of Europe's two great corridors and none of its electric fleet. Marqstats could locate no electric inland vessel anywhere on the Danube, and no Danube country operates a national vessel-electrification programme comparable to the Dutch or German instruments. The published Danube fleet type-split dates from 2017 and no current age, hull-value or port grid-capacity data is available, so this segment cannot be sized beyond the vessel count — which is zero.
How Competition Is Evolving
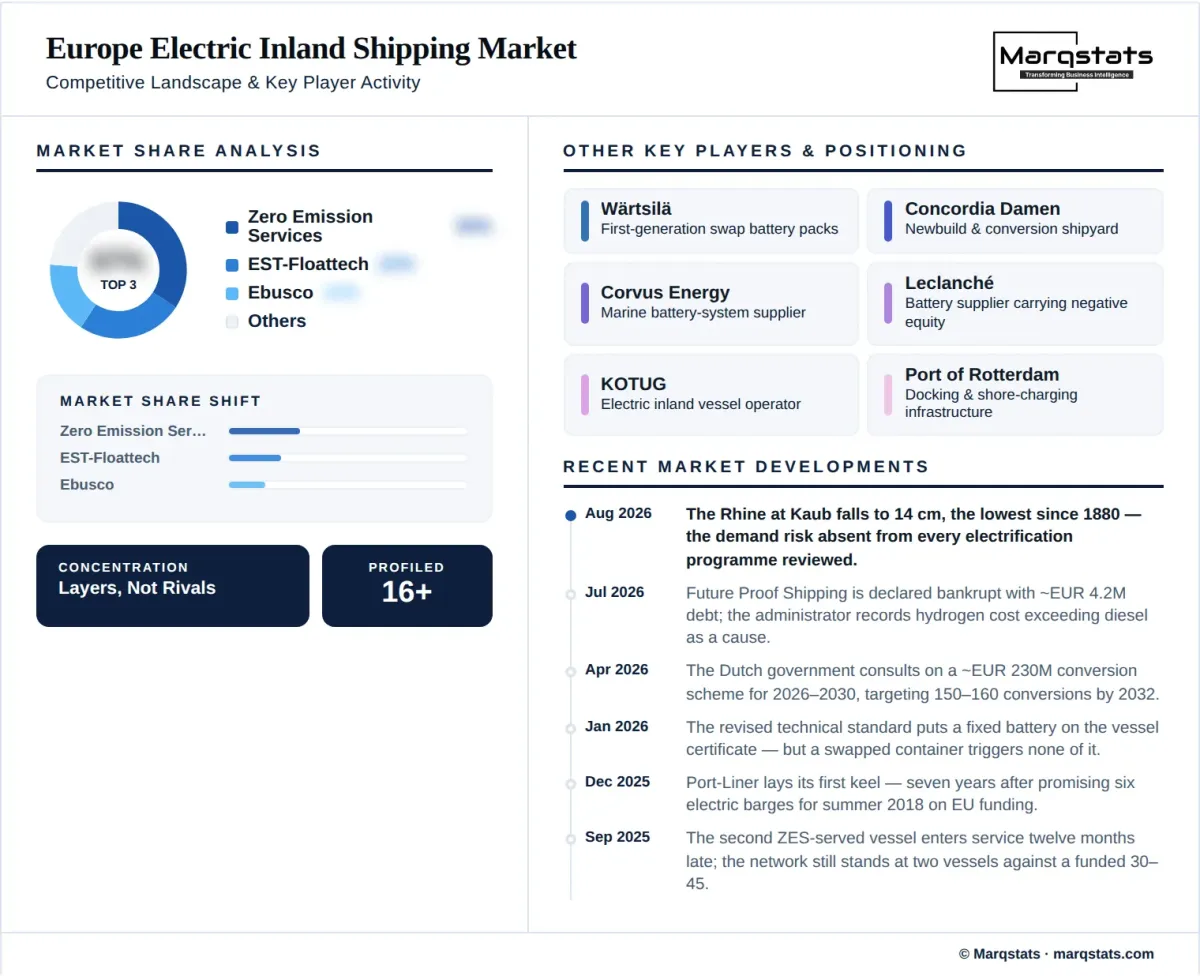
This is a market of layers rather than of competing vessel manufacturers, and the layers matter more than the rankings because a single electric inland vessel typically involves four separate companies. The shipowner holds the hull, drivetrain, switchboards and container foundations. A shipyard performs the newbuild or conversion. A system integrator supplies the propulsion, drives and power management. An energy provider owns the battery container and sells the energy as a service. Attributing a vessel to any one of them, as trade coverage routinely does, produces a count that double-counts across layers and understates the number of parties whose commercial survival the vessel depends on.
Supplier concentration is severe enough to be a systemic risk in its own right. On the evidence assembled, EST-Floattech is the most frequently referenced battery-system provider to European inland vessels specifically, and Zero Emission Services depends for its current-generation packs on Ebusco Holding N.V., a 40% shareholder that is close to insolvency. Leclanché is carrying negative equity, ENGIE exited eleven months after the first docking station opened, and a further storage venture has been dismantled. With 23 battery and hybrid vessels in the entire European inland fleet, the failure of any one supplier removes a material share of the market's delivery capacity.
Public money sits on three of the four balance sheets in a typical transaction, which is the clearest statement of the market's maturity. The growth fund financed the batteries, the national conversion schemes finance the shipowner's drivetrain, and ETS2 is intended to close the operating gap. The only party contributing purely commercial capital is the shipper, and what the shipper contracts for is a volume commitment rather than a disclosed price premium. Against roughly EUR 300 million of identified public commitment across the Dutch, German and EU instruments, the evidenced private capital at risk amounts to a small number of converted vessels and push boats.
Companies Covered
Companies covered in the report include:
Recent Market Activity
Table of Contents
Coverage & Segmentation
This study covers battery-electric and hybrid-electric inland waterway vessels in Europe holding a Rhine Vessel Inspection Certificate or a Union certificate — dry cargo, container, tanker, push and passenger vessels — together with the battery systems, swappable battery containers, shore charging points and swap docking stations built to serve them. Seagoing and short-sea vessels are excluded. Vessels running on hydrogen, methanol or renewable diesel are outside the market value but are covered in the analysis, because they compete for the same subsidy budgets and the same hulls.
Market value is measured at vessel, system and installation supply price in euros and converted to United States dollars at annual average exchange rates for historical years and assumed rates thereafter, with both series reported because they diverge by 1.80 percentage points across the forecast. The base year is 2025, the historical period 2021 to 2025 and the forecast period 2026 to 2030. Readers should treat this as a subsidy-dependent rather than a demand-dependent forecast: the conversion segment is driven almost entirely by one national scheme. That scheme's target implies roughly 28 Dutch conversions a year against an observed pan-European rate near one, and this forecast does not model that rate being reached. The conversion series here is pan-European and should not be divided by a national target.