Market Snapshot
Middle bar: base-year value × (1 + CAGR), rounded to two decimals. This is a calculated illustration, not a separately researched annual estimate.
Market Size (2025, Base Year): USD 1,402.17 Million (Wholesale, Ex-Distributor)
Estimated Value (2026): USD 1,456.60 Million
Forecast Value (2030): USD 1,679.37 Million
CAGR: 3.67% | Forecast Period: 2026 – 2030
Growth — Absolute: USD 277.20 Million
Physical Volume: 299.40 ML (2025) to 318.50 ML (2030), Volume CAGR 1.24%
Largest Market: New South Wales & ACT (29.50% of 2025 volume)
Fastest Growing: Light Commercial Vehicles (17.00% to 17.50% share, 2025-2030)
Dominant Segment: Independent Mechanical Workshops (52.80% of 2025 volume)
Market Concentration: Moderately Concentrated (Oil Majors and Independent Blenders)
Base Year: 2025 | Historical Period: 2021 – 2025 | Forecast Period: 2026 – 2030
Units Considered: Value (USD Million) and Volume (Megalitres)
Segments Covered: 3 | Regions Covered: 7 | Companies Profiled: 14
Report Pages: 170 | Deliverables: PDF, Excel, PPT
Key Takeaways
Market Overview & Analysis
Report Summary
Australia's lubricants aftermarket is a mature volume market being repriced from above. Vehicles are being serviced less often, but each service now uses a costlier oil. Volume grows at 1.24% a year; value grows at 3.67%.
The analysis measures the wholesale value of engine oils, drivetrain fluids, gear oils and greases consumed in servicing on-road vehicles after factory delivery: USD 1,402.17 million in 2025. It excludes first-fill oils on imported vehicles, since Australian passenger vehicle assembly ended in 2017, and it excludes about 200 megalitres of mining-equipment lubricants that sit under separate bulk contracts.
The analysis is written for four readers: a domestic blender securing Group III supply, a trade distributor pricing workshop bundles, an independent workshop owner choosing bulk storage, and an investor tracking how policy moves value per litre.
A Fuel-Efficiency Law That Needs an Oil Australia Cannot Make
Most lubricant markets are shaped by demand-side rules or by supply-side refining economics. Australia's is shaped by a demand-side rule that runs straight into a supply-side gap.
The New Vehicle Efficiency Standard took effect on 1 January 2025. To meet its carbon dioxide limits, manufacturers are fitting downsized turbocharged engines and hybrids, and they specify ultra-low-viscosity oils, SAE 0W-16 and 0W-20, to cut friction. Those grades need polyalphaolefin or highly hydroprocessed Group III base stock, which costs 45% to 70% more than Group II mineral oil. Australia refines none of it. Lubricant refining at Kurnell and Geelong has closed, so blenders import Group I, II and III stock by sea: 52.6% from Singapore, 23.0% from South Korea, 5.2% from Malaysia. Re-refined domestic oil exists, at more than 320 megalitres of used oil collected a year, but OEM approval rules keep it out of premium passenger car oils. The policy therefore raises the value of each litre and leaves the supply of the key input offshore.
Longer Intervals, Older Cars: Two Forces That Nearly Cancel
Registrations and oil sales should move together. They have not, and the gap shows two opposing mechanisms at work.
Light vehicle registrations grew 2.1% a year between 2021 and 2025. Passenger car motor oil grew 0.95%. That 1.15 point gap is the effect of longer service intervals: modern powertrains are serviced every 15,000 km or 12 months, where pre-2015 models needed 7,500 km or 6 months. Pulling the other way, the average vehicle is now 10.8 years old and heading toward 11.36 by 2028. Past eight years, piston rings, valve seals and turbocharger bearings wear, oil burn rises and mid-interval top-ups increase. Older cars also leave dealerships for independent workshops, which flush fluids more often. The result is volume growth of 1.24% a year, modest but positive.
Why Under 5% of Registrations Buys a Third of the Oil
The fleet is dominated by passenger cars, but the oil is not.
Heavy commercial vehicles are fewer than 5% of registered vehicles and use 32.00% of aftermarket volume. An articulated truck covering 200,000 km a year uses about 190 litres of engine oil including top-ups. A private SUV uses 5 to 7 litres. Because interstate freight cannot be electrified soon, given the distances and payloads, this segment lifts its share from 32.00% to 33.00% by 2030 and anchors demand while passenger car oil share slips.
A Price Floor Set by Levy and Freight
Entry-grade oil in Australia cannot fall below a floor that has little to do with demand. Two costs set it, and neither is negotiable.
The first is the Commonwealth stewardship levy, 14.2 cents per litre since July 2023, up from 8.5 cents. Blenders and importers pay it at the customs border or the production gate, so it enters every price as cost of goods. It raises roughly AUD 70 to 75 million a year and funds the collection of more than 320 megalitres of used oil. The second is ocean freight and refining margin on imported base stock. Together they explain why the blended price is projected to rise from AUD 7.15 to AUD 8.05 per litre even with flat demand, and why a levy rise to 18.0 cents is the trigger for the Extended ICE Retention case.
Data Access Is Moving Volume Out of Dealerships
Channel share in this market follows who can reset the oil life monitor.
Before the Motor Vehicle Information Scheme, manufacturers could withhold reset codes and diagnostics, which kept late-model cars in franchised service departments. The scheme, under Part IVD of the Competition and Consumer Act 2010, obliges them to supply service and software data to independent workshops at fair prices. Australia's 30,000 independent workshops and 150,000 certified technicians have since extended their reach to three-to-seven-year-old vehicles. Independent workshops handle 52.80% of volume today, and the research projects 54.50% by 2030 while dealerships fall from 26.00% to 24.00%.
What the Evidence Does and Does Not Show
The sizing is transparent, but not every layer is equally well supported.
Published statistical series corroborate 62.4% of headline demand, through DCCEEW customs and excise data and NEVDIS vehicle counts. The other 37.6% is derived from workshop channel allocations, top-up rates and distributor margins calibrated to industry benchmarks. Workshop service compliance is assumed at 88.5%, and each point of movement shifts volume by 2.99 ML and value by USD 14.02 million. The source gives no regional value split and does not reconcile its vehicle-class parc of 21.09 million to the national 22.30 million. These gaps do not change the volume partitions, but they limit how finely the figures should be read.
Market Dynamics
Key Drivers
- Australian passenger vehicle assembly ended in 2017, so first-fill oil arrives on imported vehicles and every litre used in later servicing is bought in the aftermarket, which concentrates demand in the channels the analysis measures.
- Fleet ageing changes where oil is bought: vehicles older than eight years leave dealerships for independent workshops, where drivetrain and differential fluid services are sold more routinely.
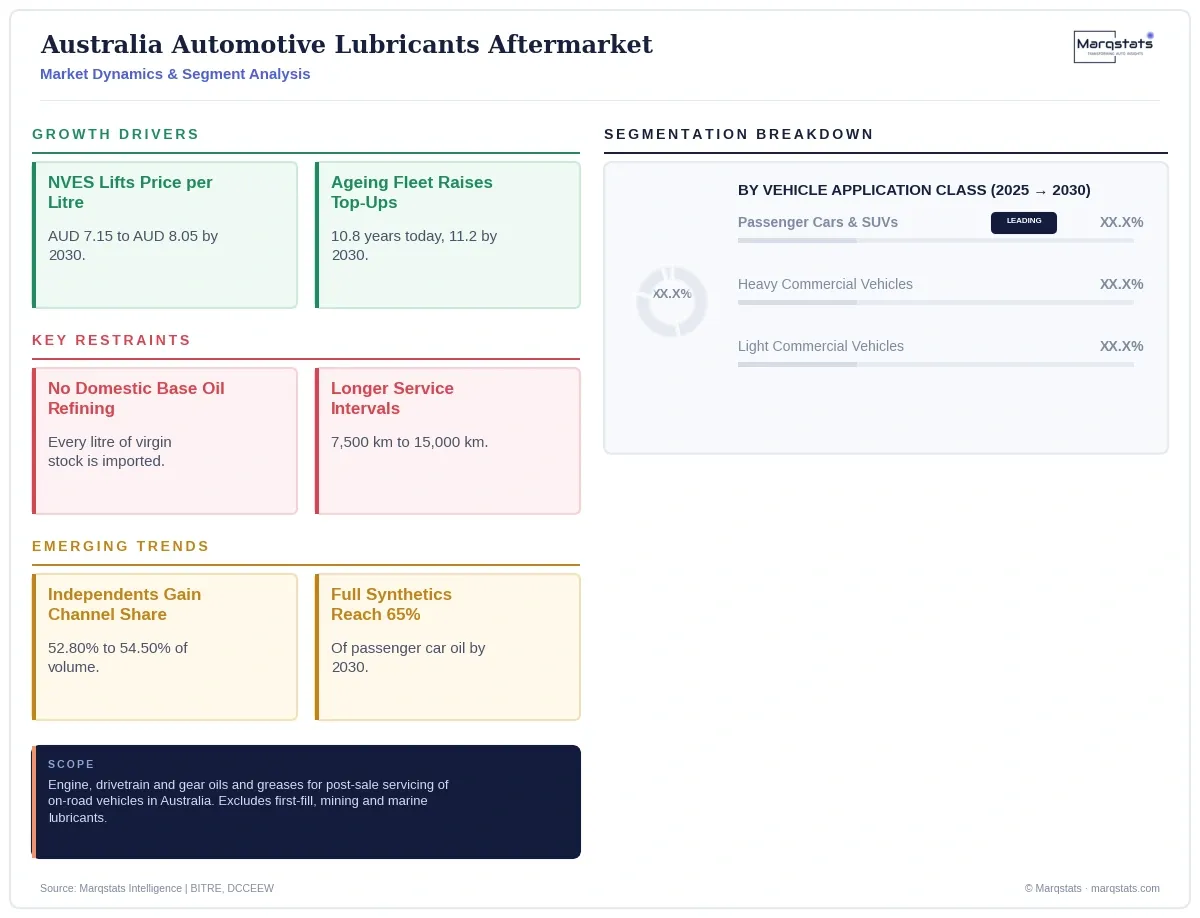
- The operating fleet grew from 21.80 million vehicles in 2024 to 22.30 million in 2025, and more than 97% of it still runs on internal combustion, which keeps recurring oil demand in place.
- The New Vehicle Efficiency Standard is moving new-vehicle servicing to 0W-16 and 0W-20 synthetics, lifting blended wholesale price from AUD 7.15 to AUD 8.05 per litre by 2030.
- An ageing fleet, 10.8 years today and 11.2 by 2030 in the Base Case, raises oil burn and top-up frequency and moves vehicles into independent workshops.
- Growth in the national freight task keeps heavy-duty motor oil at 33.00% of volume by 2030 and lifts light commercial vehicles to 55.74 ML, driven by trade utes and courier fleets.
- The Motor Vehicle Information Scheme obliges manufacturers to supply service and software data to independent workshops, which expands their reach over three-to-seven-year-old vehicles.
Key Restraints
- The research does not give brand-level volume shares or regional values, so competitive position and regional revenue must be read from ML and channel data rather than from audited share figures.
- Re-refined base oil is limited to Category 1 and 2 grades for industrial, hydraulic and heavy-duty use, because OEM approval rules keep it out of premium passenger car synthetics.
- Extended OEM service intervals, now 15,000 km or 12 months, cut the number of oil changes per vehicle and hold passenger car oil volume growth below fleet growth.
- Australia has no virgin base oil refining, which leaves blenders exposed to Asian freight, exchange rates and refining margins on every premium grade.
- The 14.2 cents per litre stewardship levy, raised from 8.5 cents in July 2023, is a non-negotiable cost passed down the chain and sets a permanent price floor for entry-grade oils.
- Battery electric vehicles reach 22.0% of new light vehicle sales by 2030 in the Base Case. They remain only 7.5% of the parc, but they reduce passenger car oil share from 48.00% to 47.00%.
Key Trends
- Brand owners are competing on approvals rather than price: the Australian Lubricant Association's July 2025 determination on non-compliant ACEA C3 claims raised the cost of entering the synthetic workshop range without candidate test data.
- Independent workshops are gaining share, from 52.80% to 54.50% of volume, while franchised dealerships slip from 26.00% to 24.00%.
- Premium full synthetics reach an estimated 65% of passenger car engine oil demand by 2030 in the Base Case.
- Trade distribution is consolidating: Bapcor is reorganising Burson Auto Parts under new leadership, and Ampol is absorbing more than 500 EG Australia retail sites.
- Amotiv is bundling Nulon oils with Ryco filters in unified commercial workshop contracts, and distributors are moving to registration-lookup catalogues that match oil to the vehicle.
Strategic Implications
- Fleet operators should model heavy-duty oil at roughly 190 litres per articulated unit per year and budget for shorter drain intervals in hot, high-load corridors such as Perth to the Pilbara, where oxidation is faster.
- Investors and analysts should track the levy decision and the Group III price spread between Singapore and South Korea, which together separate the two 2030 scenarios.
- Distributors should watch retail consolidation, since Ampol's absorption of EG sites and Viva's Liberty integration move captive volume away from independent forecourt supply.
- Domestic blenders should sign index-linked Group III and III+ supply contracts with Singapore and South Korean refiners and hold at least 60 days of terminal storage.
- Blenders should invest in candidate testing and OEM homologation, since certified approvals protect workshop warranty compliance against imported finished brands.
- Wholesalers should bundle synthetic oil with filters, sump washers and drain plugs and link catalogues to vehicle registration to prevent misapplication.
- Independent workshops should replace the single 205-litre drum with multi-tank bulk dispensing for 0W-20, 0W-16 and low-SAPS 5W-30, and use MVIS data rights to reset oil life monitors.
Outlook
The underlying research presents two scenarios tied to named policy and economic triggers, not a default three-way spread. Both 2030 endpoints are stated in the source.
Under the Base Case, New Vehicle Efficiency Standard enforcement continues to 2030, the stewardship levy stays at 14.2 cents per litre and the Motor Vehicle Information Scheme keeps operating. Battery electric vehicles reach 22.0% of new light vehicle sales but only 7.5% of the parc, and average fleet age rises to 11.2 years. Full synthetics reach 65% of passenger car oil demand. Volume reaches 318.50 ML and value reaches USD 1,679.37 million (AUD 2,563.93 million), a 3.67% CAGR, at a blended AUD 8.05 per litre.
Under the Extended ICE Retention scenario, the levy rises to 18.0 cents per litre, Singapore and South Korean refining constraints lift Group III prices, and weak new-car sales push average fleet age to 11.8 years. Battery electric vehicles reach only 4.8% of the parc. Volume reaches 326.80 ML and value reaches USD 1,798.05 million (AUD 2,745.12 million) at AUD 8.40 per litre. The 5.10% value CAGR is Marqstats arithmetic from the stated endpoints.
Market Segmentation
143.70 ML (48.00% share) in 2025, moving to 149.69 ML (47.00% share) by 2030. Anchored by Castrol, Penrite and Valvoline; share slips one point as battery electric vehicles enter new sales.
98.80 ML (33.00% share) in 2025, moving to 108.29 ML (34.00% share) by 2030. Anchored by Mobil Delvac through Ampol and Shell Rimula through Viva; gains share on interstate freight.
38.92 ML (13.00% share) in 2025, moving to 41.41 ML (13.00% share) by 2030. Covers ATF, DCT, CVT and hypoid axle fluids, with lower change frequency and higher realisation per litre.
17.98 ML (6.00% share) in 2025, moving to 19.11 ML (6.00% share) by 2030. Anchored by Penrite and Nulon specialty ranges.
140.72 ML (47.00% share) in 2025, moving to 144.92 ML (45.50% share) by 2030. About 16.06 million vehicles; volume driven by fleet ageing and the 0W-20 transition.
50.90 ML (17.00% share) in 2025, moving to 55.74 ML (17.50% share) by 2030. The fastest-growing class, led by trade utes and courier fleets.
95.81 ML (32.00% share) in 2025, moving to 105.10 ML (33.00% share) by 2030. About 984,000 rigid and articulated units, under 5% of registrations but 32.00% of volume.
11.97 ML (4.00% share) in 2025, moving to 12.74 ML (4.00% share) by 2030. About 134,000 units across urban routes and regional coaches.
158.08 ML (52.80% share) in 2025, moving to 173.58 ML (54.50% share) by 2030. Supplied through Bapcor (Burson), Repco and Capricorn Society; the largest and fastest-growing channel.
77.85 ML (26.00% share) in 2025, moving to 76.44 ML (24.00% share) by 2030. Focused on vehicles inside warranty; losing share to independents under MVIS data access.
38.92 ML (13.00% share) in 2025, moving to 43.00 ML (13.50% share) by 2030. Anchored by Linfox, Toll and direct commercial supply from Ampol and Viva.
24.55 ML (8.20% share) in 2025, moving to 25.48 ML (8.00% share) by 2030. Limited by vehicle complexity, reset requirements and used-oil disposal rules.
By Geography
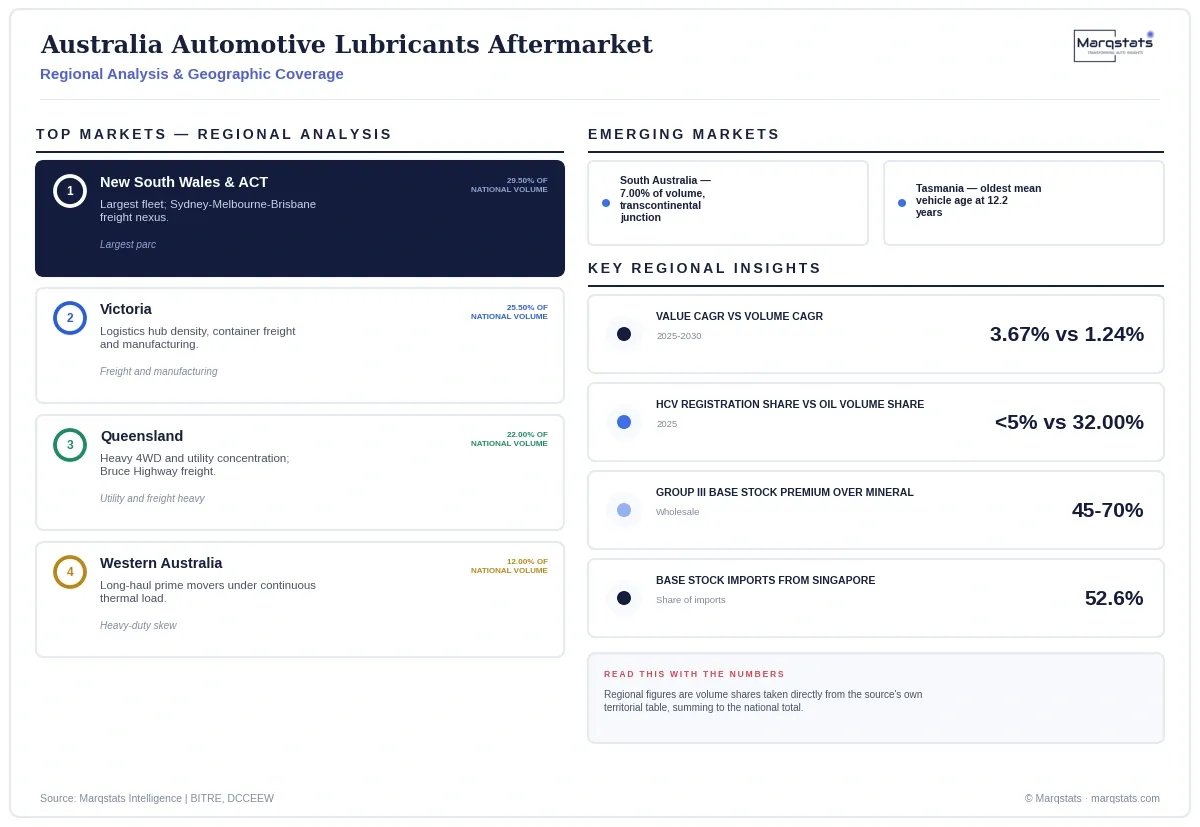
New South Wales & ACT
88.32 ML, 29.50% of national volume, on a 6.58 million vehicle parc. The largest fleet and the Sydney-Melbourne-Brisbane freight axis.
Victoria
76.35 ML, 25.50% of volume, on a 5.69 million vehicle parc. High logistics hub density, container freight and manufacturing.
Queensland
65.87 ML, 22.00% of volume, on a 4.91 million vehicle parc. Heavy 4WD and utility concentration and the Bruce Highway freight corridor.
Western Australia
35.93 ML, 12.00% of volume, on a 2.68 million vehicle parc. Perth-to-Pilbara prime movers run under continuous thermal load, which shortens oil life.
South Australia
20.96 ML, 7.00% of volume, on a 1.56 million vehicle parc. The transcontinental junction for east-west transport.
Tasmania
7.48 ML, 2.50% of volume, on a 558,000 vehicle parc. The oldest mean vehicle age nationally at 12.2 years.
Northern Territory
4.49 ML, 1.50% of volume, on a 337,000 vehicle parc. Triple and quad road-train line-haul under severe duty.
Registration Clustering and Regional Consumption Skew
Registration clustering affects New South Wales and Victoria, because national fleet managers register corporate vehicles at their headquarters even when the vehicles operate in regional territories. Western Australia and Queensland consume more heavy engine oil and heavy drivetrain lubricant than their vehicle counts suggest, because of long-haul and mining-support freight.
How Competition Is Evolving
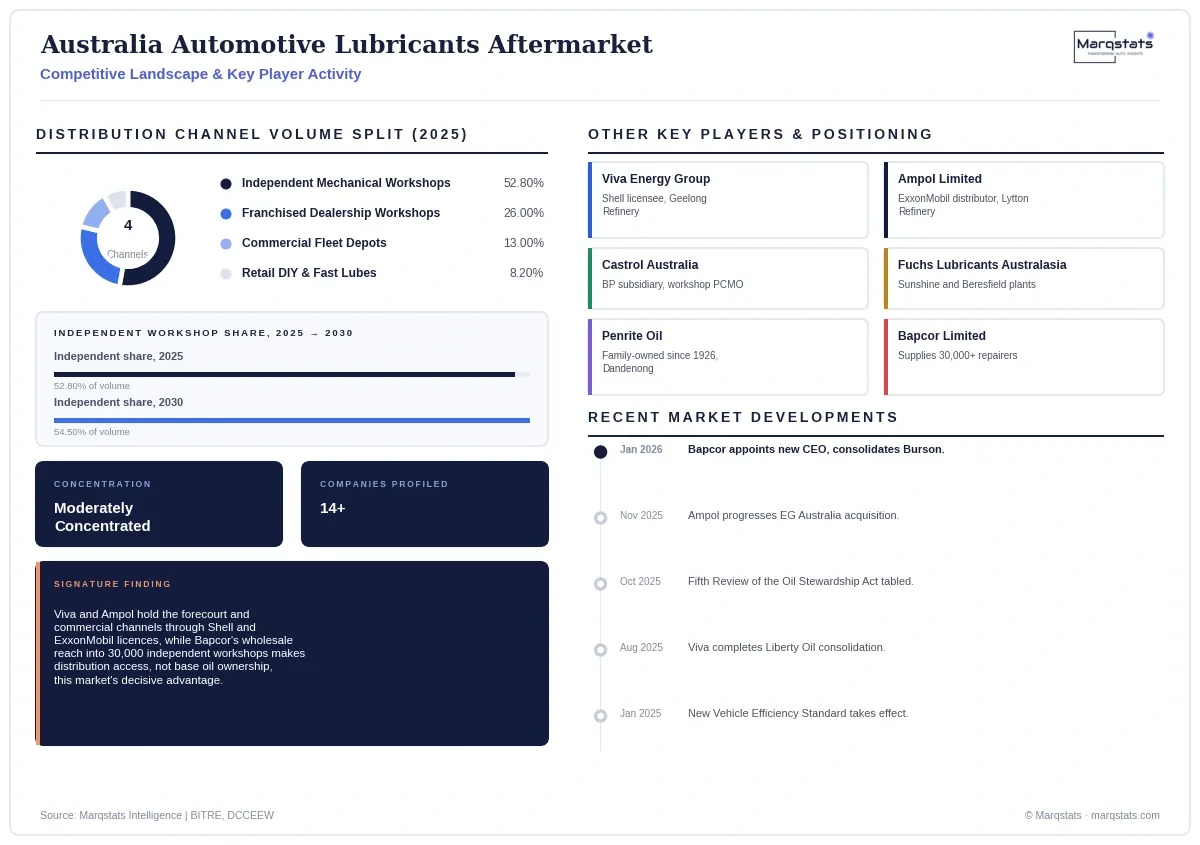
Market concentration is moderate. Two listed oil majors, Viva and Ampol, control the commercial and forecourt channels through Shell and ExxonMobil licences, while Castrol, Fuchs, Penrite, Gulf Western, Nulon and Valvoline compete for workshop trade. The research does not publish brand-level volume shares, so no share figures are asserted here. That gap matters for anyone sizing a single brand, and it is disclosed rather than estimated.
Ownership of the base oil is not the source of competitive strength here, since no participant refines it. Strength comes from import logistics, terminal storage, OEM approvals and access to the wholesale channel. Viva runs 24 bulk import terminals, and Ampol runs a national terminal network, which gives both a supply-security advantage over blenders that rely on contract shipments of Group III stock.
Competition spans oil-major marketing platforms, global lubricant specialists, Australian blenders and one dominant trade wholesaler. Viva Energy is the exclusive Shell licensee through 31 December 2029, runs the 120,000 barrel-a-day Geelong Refinery and 1,287 service stations, and reported 2025 revenue of AUD 28,528.7 million. Ampol, with the 109,000 barrel-a-day Lytton Refinery and more than 1,800 sites, is the exclusive ExxonMobil lubricants distributor and earned AUD 947.0 million of replacement cost EBIT in 2025.
Castrol, a BP subsidiary, leads passenger car oil in trade workshops and supplies by contract blending and imports from Singapore. Fuchs Lubricants Australasia blends at Sunshine in Victoria and Beresfield in New South Wales and reported AUD 435.61 million of 2024 Australian revenue. Penrite, family-owned since 1926, blends at Dandenong. Gulf Western Oil runs an automated plant at St Marys, and Amotiv's Nulon blends at Moorebank.
Bapcor does not blend, but its Burson and Precision networks supply packaged oil to more than 30,000 independent repairers and it reported AUD 1,943.5 million of FY2025 revenue. That makes wholesale access, not brand ownership, the gate to the largest channel. Southern Oil Refining re-refines more than 150 ML of used oil a year at Wagga Wagga and Gladstone, but only into industrial and heavy-duty grades.
Companies Covered
Companies covered in the report include:
Recent Market Activity
Table of Contents
Coverage & Segmentation
The analysis measures replacement and top-up engine oils, transmission and drivetrain fluids, gear oils and greases consumed in servicing and repairing registered on-road vehicles in Australia after factory delivery, for a 2025 base year and a 2026 to 2030 forecast, in United States dollars at 0.6550 per Australian dollar. Values are ex-distributor, exclude the 10% GST and include the 14.2 cents per litre stewardship levy. First-fill, mining, agricultural, marine, rail and aviation lubricants are excluded.
The analysis covers three segmentation dimensions, product formulation, vehicle class and distribution channel, seven states and territories and 14 profiled entities. Volumes in each dimension partition to the national total in both 2025 and 2030.