Market Snapshot
The US refrigerated truck market is valued at USD 4.27 billion in 2025 and is forecast to reach USD 6.04 billion by 2030, a CAGR of 7.18%. Volume rises from 44,500 to 54,400 new refrigerated units, a 4.10% CAGR. Price does more of the work than volume: the average reefer van trailer assembly climbs from about USD 108,000 to USD 123,500 as fleets replace the oldest refrigerated fleet on record.
Marqstats sizes the market at one level of the stack: the refrigerated equipment that turns a truck into a refrigerated truck. That is the insulated van trailer or straight-truck body plus its factory-fitted transport refrigeration unit (TRU), valued ex-factory. Truck chassis and tractors are excluded, because adding them would count a separate market. The value is a Marqstats construction of units times assembly price, calibrated to Wabash National Corporation filings, Trailer/Body Builders output data and the transport refrigeration disclosures of Carrier Global Corporation and Trane Technologies plc. The figure is most sensitive to reefer trailer units; every 1,000 trailers moves 2025 value by about USD 108 million.
2025 was a reset year. Output fell hard. Marqstats estimates reefer van trailer output at about 30,500 units, 29.07% below the 43,000 built in 2023, while Hyundai Translead, Great Dane and Wabash each reported total trailer output down 29% to 32%. Trailer/Body Builders reported in July 2026 that reefer production had fallen below economically derived demand and that trailer production overall was running below scrappage.
The regulatory pull that once anchored electrification forecasts has weakened. On 13 January 2025 the California Air Resources Board (CARB) withdrew its request for US Environmental Protection Agency (EPA) authorization of the zero-emission truck TRU turnover in its 2022 TRU amendments. CARB confirmed in June 2025 that truck TRU owners are not required to turn their fleets over to zero-emission units. Electrification now rides on fleet economics and a new CARB rulemaking still at the workshop stage.
Key Takeaways
Market Overview & Analysis
Report Summary
The market covered here is new refrigerated transport equipment sold in the United States: 53-foot and 48-foot reefer van trailers pulled by Class 8 tractors, and insulated refrigerated bodies mounted on Class 4 to 7 straight trucks, each counted with the TRU fitted before first delivery. Marqstats values the market at USD 4.27 billion in 2025 on 44,500 units, rising to USD 6.04 billion on 54,400 units in 2030.
The central question is how fast the replacement backlog clears. Public carriers ran trailer fleets averaging 6.53 years in 2026, the oldest since 2014, and Transport Topics reported in September 2026 that the reefer fleet is the oldest it has ever been. Against that, carriers held close to four trailers per tractor and diverted capital to Class 8 tractors ahead of the EPA 2027 NOx standard. Marqstats expects the deferral to unwind from 2027, and treats the electrification share as a fleet-economics decision now that California no longer forces truck TRU turnover.
Coverage runs across three segment dimensions (equipment type, value component and TRU power architecture), four US Census regions, the trailer and body builders, the two dominant TRU makers, and the federal and California rules that shape what fleets can buy. Every value is a Marqstats estimate in 2025 US dollars at ex-factory prices, with 2021 to 2025 history and a 2026 to 2030 forecast.
US Refrigerated Truck Market Size and Forecast
Marqstats estimates the market at USD 3.66 billion in 2021, USD 4.88 billion in 2022, USD 5.55 billion in 2023 and USD 5.06 billion in 2024, before a drop to USD 4.27 billion in 2025. The forecast path runs USD 4.24 billion in 2026, USD 5.07 billion in 2027, USD 5.53 billion in 2028, USD 5.81 billion in 2029 and USD 6.04 billion in 2030. Units follow the same arc: 46,000 in 2021, 58,500 at the 2023 peak, 44,500 in 2025, 42,700 in the 2026 trough and 54,400 in 2030.
The 2026 value is not on the smooth CAGR line, and it should not be. A 7.18% path from 2025 would put 2026 near USD 4.58 billion; Marqstats places it at USD 4.24 billion, 0.70% below 2025, because trailer capacity was booked behind tractor pre-buys for most of the year. The rebound is concentrated in 2027, when reefer trailers rise from 29,000 to 34,500 units. After that the curve flattens, as the oldest trailers have been replaced and growth shifts toward price and specification.
Price matters more than volume. It explains about 3 percentage points of the annual value growth. Marqstats builds the average reefer van trailer assembly at USD 108,000 in 2025 (about USD 72,000 for the insulated trailer and USD 36,000 for a diesel trailer TRU) and USD 123,500 in 2030. The straight-truck assembly moves from USD 70,000 (about USD 48,000 body and USD 22,000 truck TRU) to USD 81,000. Utility Trailer Manufacturing Company told Transport Topics in September 2026 that year-on-year cost increases on some reefer configurations exceeded USD 10,000, so the 2026 step is a floor rather than a stretch.
Replacement, Not Regulation, Now Sets the Pace
The reefer fleet is old. Carriers know it. Trailer/Body Builders reported on 3 July 2026 that public-carrier trailers averaged 6.53 years, the highest since 2014, and that trailer production was running below the scrappage rate, a gap that historically opens only in severe recessions. The same report said reefer production had fallen below economically derived demand, mainly because carrier profits were too thin to fund replacement.
Two forces held orders back. First, carriers were long on trailers, holding close to four per tractor, so they could stretch replacement without losing capacity. Second, the EPA 2027 NOx standard, which cuts allowable NOx from 200 mg to 35 mg per horsepower-hour from 1 January 2027, is expected to add USD 10,000 to USD 30,000 to a new truck, and fleets spent first on tractors. EPA kept the 2027 date, and its July 2026 proposal to ease warranty and useful-life terms had no legal effect by the end of September 2026.
The signs of release are already visible. Wabash National Corporation reported a backlog of about USD 956 million at 30 June 2026, up from about USD 705 million at the end of 2025, and Transport Topics reported that the US trailer backlog rose 13% year on year to 78,400 units by July 2026. Premier Trailer Leasing told the same publication that reefer utilization rose 20 points in a year. Marqstats reads these as the start of a catch-up that peaks in 2027 and 2028.
California Withdrew the Mandate, So Electrification Must Pay for Itself
The 2022 amendments to the CARB TRU Airborne Toxic Control Measure (Title 13, California Code of Regulations, section 2477) required truck TRU fleets to turn over at least 15% a year to zero-emission units. EPA authorized the rest of the amendments on 3 January 2025 but did not act on that requirement. On 13 January 2025 CARB Executive Officer Steven Cliff withdrew the request for it. CARB told owners in June 2025 that they are not required to turn over truck TRUs, that TRU operating fees are not being collected at this time, and that new diesel truck TRUs may be sold if the refrigerant GWP is 2,200 or lower.
The requirement is deferred. It is not dead. CARB said the truck zero-emission requirement would be folded into a new TRU rulemaking, held a workshop on 9 July 2025, and ran its first concepts workshop for that rule on 14 July 2026. No Board hearing date had been set by the cutoff. Marqstats therefore does not model a California-driven step change before 2030, and puts hybrid and electric assemblies at 14.07% of 2030 value rather than the near-total California turnover implied by the 2022 text.
What remains is economics. Diesel still wins on cost for long hauls. All-electric and battery-hybrid units cut diesel use and noise at docks, and Carrier Transicold launched the engineless Vector 8200 in the US in August 2026 for stationary trailer cold storage at facilities. Those are the duty cycles where electrification pays first. Long-haul 53-foot reefers stay mostly diesel through 2030 in the Marqstats base, because battery weight and shore-power availability still limit the trade-off on interstate routes.
Market Dynamics
Key Drivers
Four drivers lift value faster than units, and each rests on a dated instrument or a reported figure.
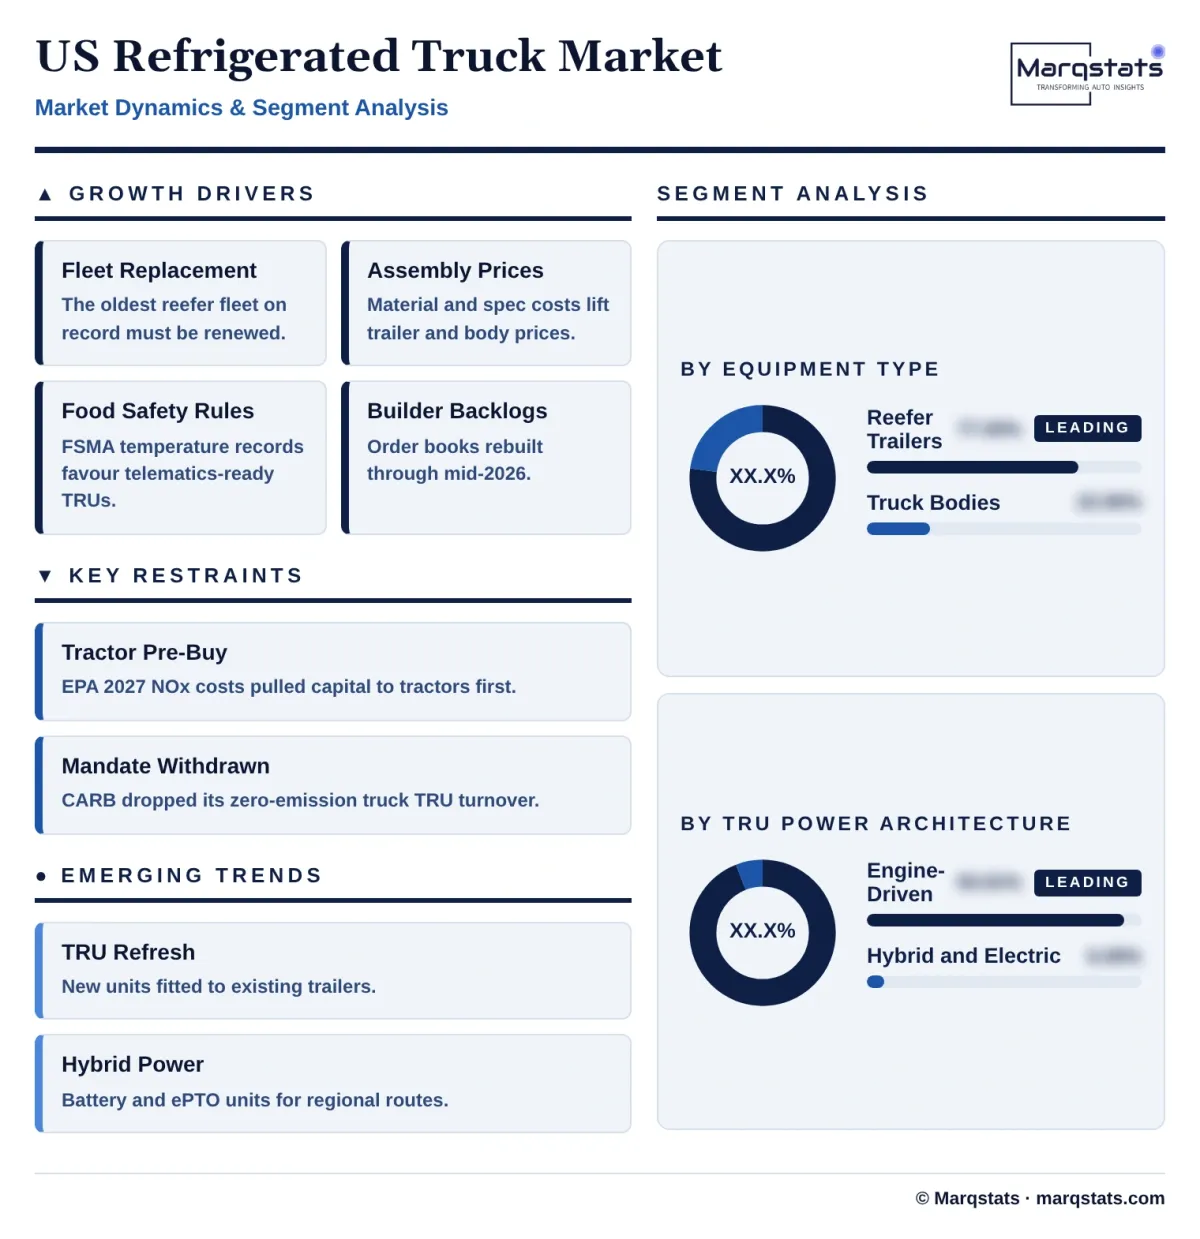
- Deferred replacement of an old fleet: public-carrier trailers averaged 6.53 years in 2026, the highest since 2014, and trailer production ran below scrappage, so Marqstats expects reefer trailer units to rise from 29,000 in 2026 to 38,500 in 2030.
- Assembly price inflation: Utility Trailer Manufacturing Company reported cost increases above USD 10,000 on some reefer configurations year on year by September 2026, and Marqstats lifts the trailer assembly price from USD 108,000 in 2025 to USD 123,500 in 2030.
- Food-safety and cold-chain discipline: the US Food and Drug Administration (FDA) Sanitary Transportation of Human and Animal Food rule under the Food Safety Modernization Act (FSMA) requires documented temperature control, which pushes fleets toward telematics-equipped TRUs and keeps reefer specifications rising.
- Backlog recovery at the builders: Wabash National Corporation backlog rose from about USD 705 million at end-2025 to about USD 956 million at 30 June 2026, and the US trailer backlog stood 13% higher year on year in July 2026.
Key Restraints
Three restraints cap the pace of recovery and the share of electrified units.
- Tractor pre-buy ahead of EPA 2027: the 35 mg NOx standard from 1 January 2027 is expected to add USD 10,000 to USD 30,000 per truck, and fleets have spent on tractors first, keeping 2026 reefer output near 29,000 trailers.
- Withdrawn California turnover: CARB withdrew its request for authorization of the 15%-a-year zero-emission truck TRU turnover on 13 January 2025, removing the only binding US mandate for electric TRUs until a new rule is adopted.
- Carrier margins and trailer surplus: carriers held close to four trailers per tractor in 2026, so equipment can be stretched, and Trailer/Body Builders linked low reefer production directly to poor carrier profitability.
Key Trends
Three trends change what a reefer assembly contains, not only how many are sold.
- TRU replacement instead of trailer replacement: Carrier Transicold launched its Fleet Refresh program in July 2026 to swap aging X4 and Vector units on existing trailers, with Lynx Fleet telematics, which shifts part of the spend into aftermarket units outside the new-equipment count.
- Hybrid and electric power: Utility Trailer Manufacturing Company launched the Cargobull 625+ and 655MT+ hybrid TRUs for its 3000R trailer in March 2026, with an optional electric power take-off from compatible electric tractors.
- Lower-GWP refrigerants: CARB conditions new diesel truck TRU sales on refrigerant GWP of 2,200 or lower, and both TRU makers are moving trailer units to R-454A, which Thermo King says cuts refrigerant GWP by more than 90% against R-452A.
Strategic Implications
- For entrants: sell into the replacement cycle, not the mandate. The money in 2026 to 2028 sits in reefer trailers and TRUs replacing 2015 to 2018 equipment, and the electrified opportunity is strongest in regional and dock-side duty cycles where Carrier Transicold and Thermo King already compete.
- For incumbents: protect price while the backlog rebuilds. With assembly prices rising from USD 108,000 to USD 123,500, builders that hold lead times through the 2027 rebound capture most of the USD 1.77 billion of growth; TRU makers should treat refresh programs as a hedge against slow trailer orders.
- For suppliers and investors: price the electrified slice as a fleet-economics bet, not a compliance certainty. At 14.07% of 2030 value it is worth about USD 0.85 billion, and any acceleration depends on the CARB TRU rule still in workshop, not on the withdrawn 2022 text.
Market Segmentation
Reefer van trailers are the market, in value terms, at USD 3.29 billion or 77.05% of 2025 value, rising to USD 4.75 billion and 78.64% in 2030 at a 7.62% CAGR. Marqstats estimates about 30,500 units in 2025 at an assembly price near USD 108,000.
The segment carries the cycle. It swings hardest. Units fell from about 43,000 in 2023 to 30,500 in 2025 as fleets deferred, and Marqstats has them recovering to 38,500 by 2030. Utility Trailer Manufacturing Company, Great Dane LLC, Hyundai Translead, Wabash National Corporation and Vanguard National Trailer Corporation build most US reefer vans; Utility reported 2025 output flat to down 5% while Great Dane fell 32% across all trailer types.
Class 4 to 7 refrigerated straight-truck bodies account for USD 0.98 billion or 22.95% of 2025 value on about 14,000 units, rising to USD 1.29 billion in 2030 at a 5.65% CAGR. The assembly price is lower, near USD 70,000, because the body is shorter and many truck units are smaller or vehicle-powered.
This segment moves less with freight cycles and more with food distribution, foodservice and grocery delivery. Wabash shipped 1,380 truck bodies in the second quarter of 2026 against 3,188 a year earlier, a sign that dry and refrigerated body demand was soft too. Marqstats has units recovering from 13,700 in 2026 to 15,900 in 2030. The straight-truck slice is also where electric TRUs fit most easily, because routes are short and depots can charge overnight.
The insulated structure, meaning the trailer or body shell, floor, doors, insulation and refrigeration-ready fittings, is worth USD 2.87 billion or 67.21% of 2025 value, rising to USD 4.12 billion (68.21%) in 2030 at a 7.50% CAGR. Within it, reefer trailer structures account for USD 2.20 billion (51.52% of total market value) and straight-truck bodies for USD 0.67 billion (15.69%).
Thermal performance is the specification fight here. Better foam, composite walls and tighter door seals cut the cooling load the TRU must carry, which is why builders sell insulation as a fuel-saving feature. Marqstats lifts the structural price faster than the TRU price because steel, aluminum and foam inputs drove most of the 2026 cost increases fleets reported.
Factory-fitted TRUs are worth USD 1.40 billion or 32.79% of 2025 value, rising to USD 1.92 billion (31.79%) in 2030 at a 6.52% CAGR. Marqstats prices a diesel trailer TRU at about USD 36,000 and a truck TRU at about USD 22,000 in 2025.
Two groups dominate. They are Carrier Transicold, part of Carrier Global Corporation, and Thermo King, part of Trane Technologies plc. Replacement TRUs fitted to existing trailers sit outside this segment, so the Carrier Transicold Fleet Refresh program from July 2026 lifts TRU maker revenue without adding to the new-equipment count.
Assemblies fitted with diesel engine-driven or truck-engine-driven TRUs are worth USD 4.01 billion or 93.91% of 2025 value, rising to USD 5.19 billion (85.93%) in 2030 at a 5.29% CAGR. They still win on long-haul 53-foot routes, where weight, range and refuelling time favour diesel.
The diesel share falls because the electrified slice grows faster, not because diesel shrinks. CARB still permits sale of new diesel truck TRUs that meet its other requirements and use refrigerant with GWP of 2,200 or lower, and no federal rule requires electric TRUs.
Assemblies with battery-hybrid, electric power take-off, e-axle or all-electric TRUs are worth an estimated USD 0.26 billion or 6.09% of 2025 value (about 2,100 assemblies), rising to USD 0.85 billion or 14.07% (about 6,100 assemblies) in 2030, a 26.73% CAGR.
Growth comes from regional distribution, grocery and foodservice fleets that can plug in at docks, and from builders bundling hybrid units, as Utility did with the Cargobull 625+ and 655MT+ in March 2026. The 2030 share would be higher under the original CARB turnover; Marqstats keeps it at 14.07% because that requirement was withdrawn in January 2025 and its replacement rule is still in development.
By Geography
South
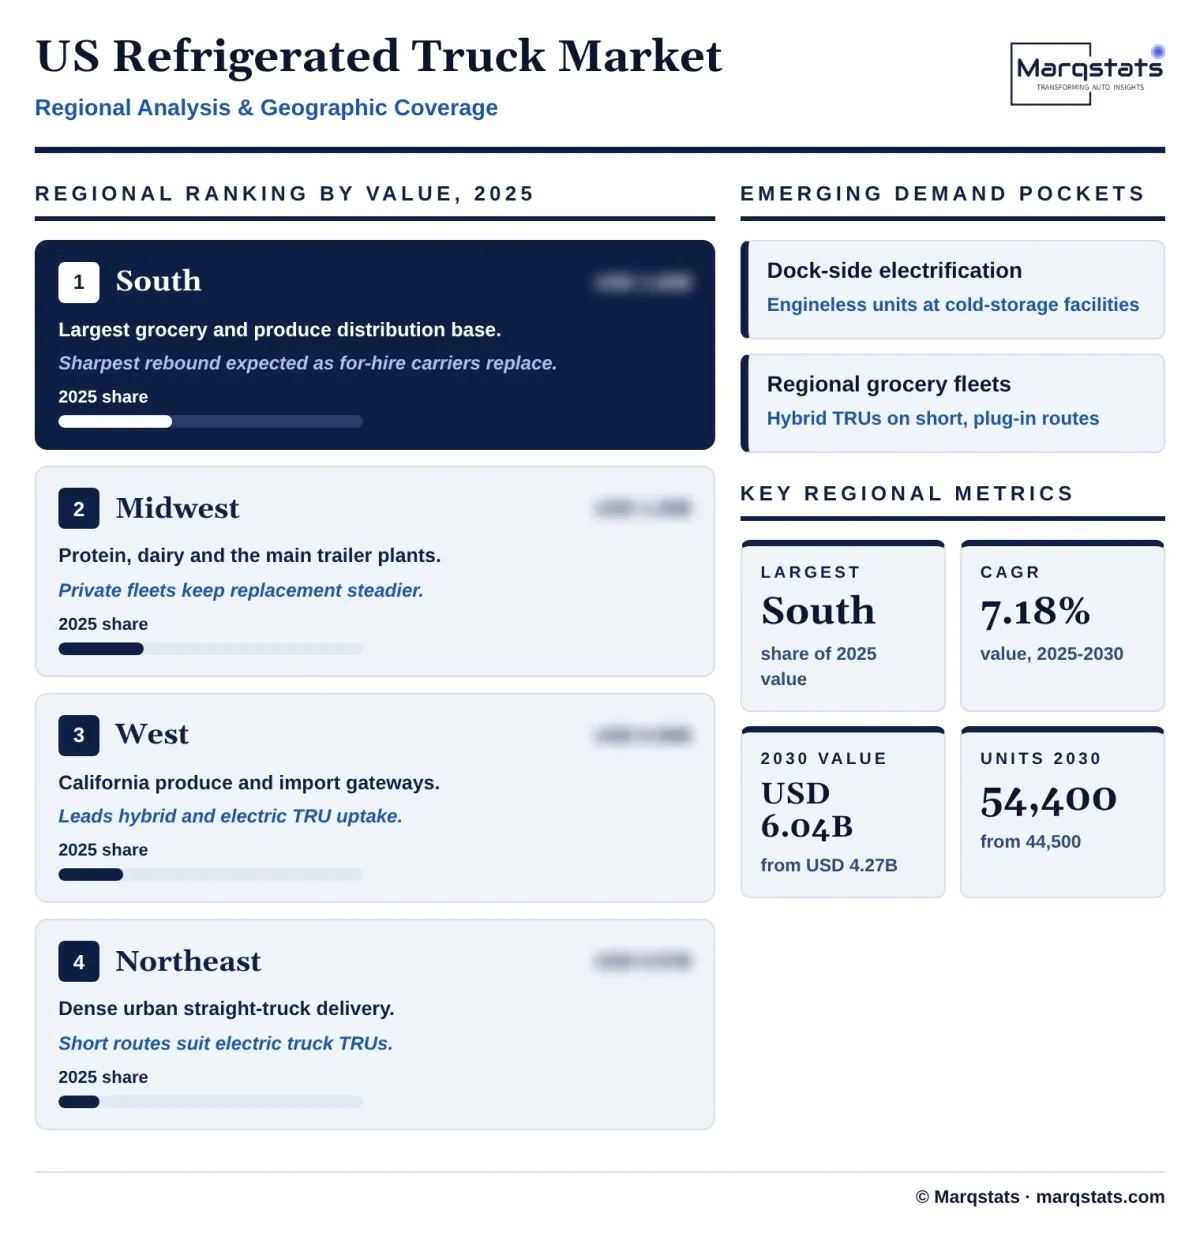
The South is the largest region at USD 1.60 billion or 37.47% of 2025 value. Texas, Georgia and Florida host dense produce, protein and grocery distribution networks, and Mexican produce crossing at Laredo and Pharr in Texas feeds southern distribution centers.
Marqstats allocates value by state of first delivery. The South also carries a large share of the for-hire reefer carriers that drove the 2025 deferral, so it should see the sharpest unit rebound in 2027.
Midwest
The Midwest accounts for USD 1.20 billion or 28.10% of 2025 value. It combines protein and dairy processing with the heaviest concentration of reefer trailer manufacturing, including Great Dane LLC in Wayne, Nebraska, Wabash National Corporation in Lafayette, Indiana, and Stoughton Trailers LLC in Wisconsin.
Meat packers and dairy cooperatives run private refrigerated fleets with predictable replacement cycles, which made Midwest demand steadier than the South in 2025.
West
The West holds USD 0.90 billion or 21.08% of 2025 value, led by California produce and its large import gateways. California is also where TRU rules bite first: CARB requires TRU registration and compliance labels and is drafting a new TRU rule.
California sets the pace. The West takes the largest share of hybrid and electric assemblies because fleets serving Southern California facilities face local air-quality programs such as the South Coast Air Quality Management District (SCAQMD) Rule 2305 warehouse indirect source rule, even without the withdrawn statewide turnover.
Northeast
The Northeast is the smallest region at USD 0.57 billion or 13.35% of 2025 value. Dense urban delivery makes it the most straight-truck-heavy region, with refrigerated bodies serving grocery, foodservice and pharmaceutical routes into New York, Boston and Philadelphia.
Short routes and depot parking make the Northeast a natural market for electric truck TRUs, though Marqstats keeps regional forecasts qualitative and publishes base-year regional values only.
How Competition Is Evolving
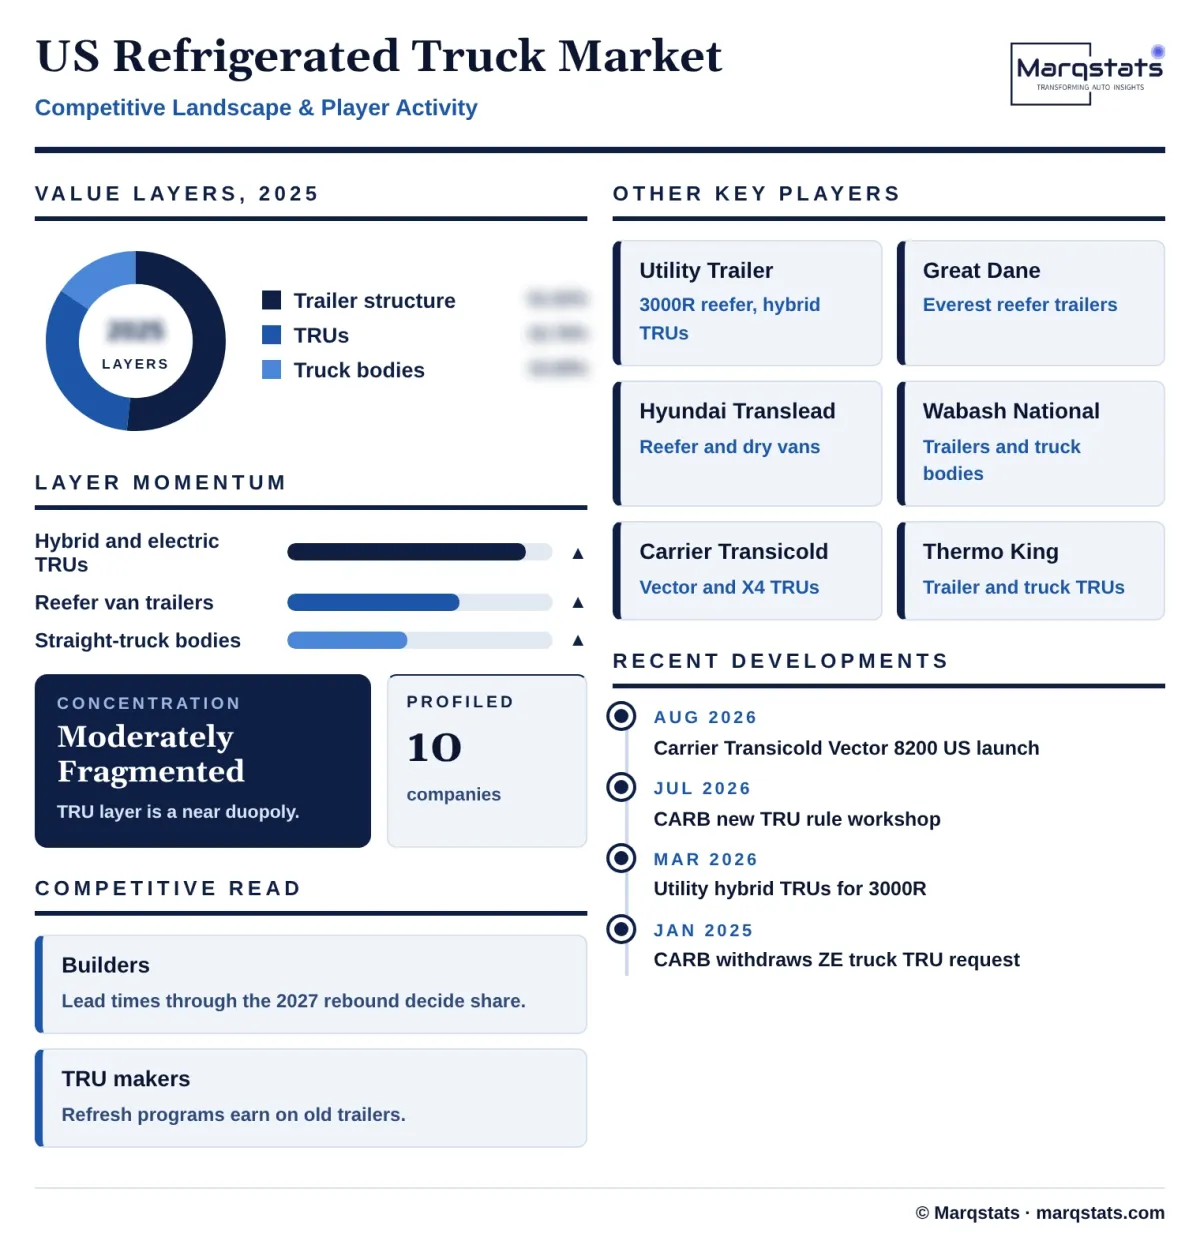
The market has two layers that compete differently. The structure layer, worth USD 2.87 billion in 2025, is moderately fragmented among trailer and body builders: Utility Trailer Manufacturing Company, Great Dane LLC, Hyundai Translead, Wabash National Corporation, Vanguard National Trailer Corporation and Stoughton Trailers LLC on the trailer side, and Morgan Truck Body, owned by JB Poindexter & Co., Inc., and Wabash National Corporation on the straight-truck side. Private builders do not publish reefer volumes, and Utility declined to report 2025 output because of the US trailer import investigation, so Marqstats does not publish company shares.
The TRU layer, worth USD 1.40 billion, is a near duopoly between Carrier Transicold (Carrier Global Corporation) and Thermo King (Trane Technologies plc), with Utility now offering Cargobull hybrid units developed with Schmitz Cargobull AG on its 3000R. Both TRU makers outperformed the 2025 trailer slump: Trane said Americas transport refrigeration revenue fell only low single digits in the fourth quarter of 2025 against transport markets down more than 20%, and Carrier said fourth-quarter global truck and trailer sales were flat.
Competition through 2028 turns on lead times, price discipline and the refresh business. Builders with order books ready for the 2027 rebound gain share, and TRU makers can earn on old trailers through replacement programs while new trailer orders lag.
Companies Covered
Companies covered in the report include:
Recent Market Activity
Table of Contents
Coverage & Segmentation
Included: new refrigerated van trailers (53-foot and 48-foot, single- and multi-temperature) and new insulated refrigerated bodies on Class 4 to 7 straight trucks delivered in the United States, each with the TRU fitted before first delivery, valued at ex-factory price in US dollars. Units count one assembly per trailer or body.
Excluded: truck chassis and tractors; Class 1 to 3 cargo-van refrigeration conversions; aftermarket and replacement TRUs fitted to existing trailers; intermodal reefer containers and their gensets; cold-storage warehousing; freight services; parts and service. Truck chassis value is a different level of the stack and would double count if added.
Sibling boundaries, do not add: the refrigerated and specialty conversions end use of the Marqstats US Commercial Van Upfitting Market (USD 418.81 million in 2025) covers cargo-van refrigeration work and sits outside this market. The cargo bodies segment of the Marqstats North America Work Truck Upfitting Market (USD 4.53 billion in 2025) includes refrigerated van bodies on Class 4 to 7 chassis; the insulated straight-truck body value here, about USD 0.67 billion, is a refrigerated US slice of that wider category and must not be added to it.