Market Snapshot
The Tanzania truck market size is estimated at USD 392.16 million in 2025 and is projected to reach USD 617.71 million by 2030, growing at a CAGR of 9.51% over 2026 – 2030. Annual additions rise from about 10,200 to 14,000 trucks, a 6.54% annual rate, while the average value per truck climbs from about USD 38,447 to USD 44,122 as locally assembled tractor heads replace used imports.
Marqstats defines the market as the acquisition value of goods trucks above 3.5 tonnes gross vehicle weight and road tractor heads entering the Tanzanian fleet, whether imported new, assembled locally from kits or imported used. Value is counted at the importer or assembler gate in US dollars, before customs duties, taxes and dealer margins. Pickups, vans, buses, trailers and off-road mining machines are excluded.
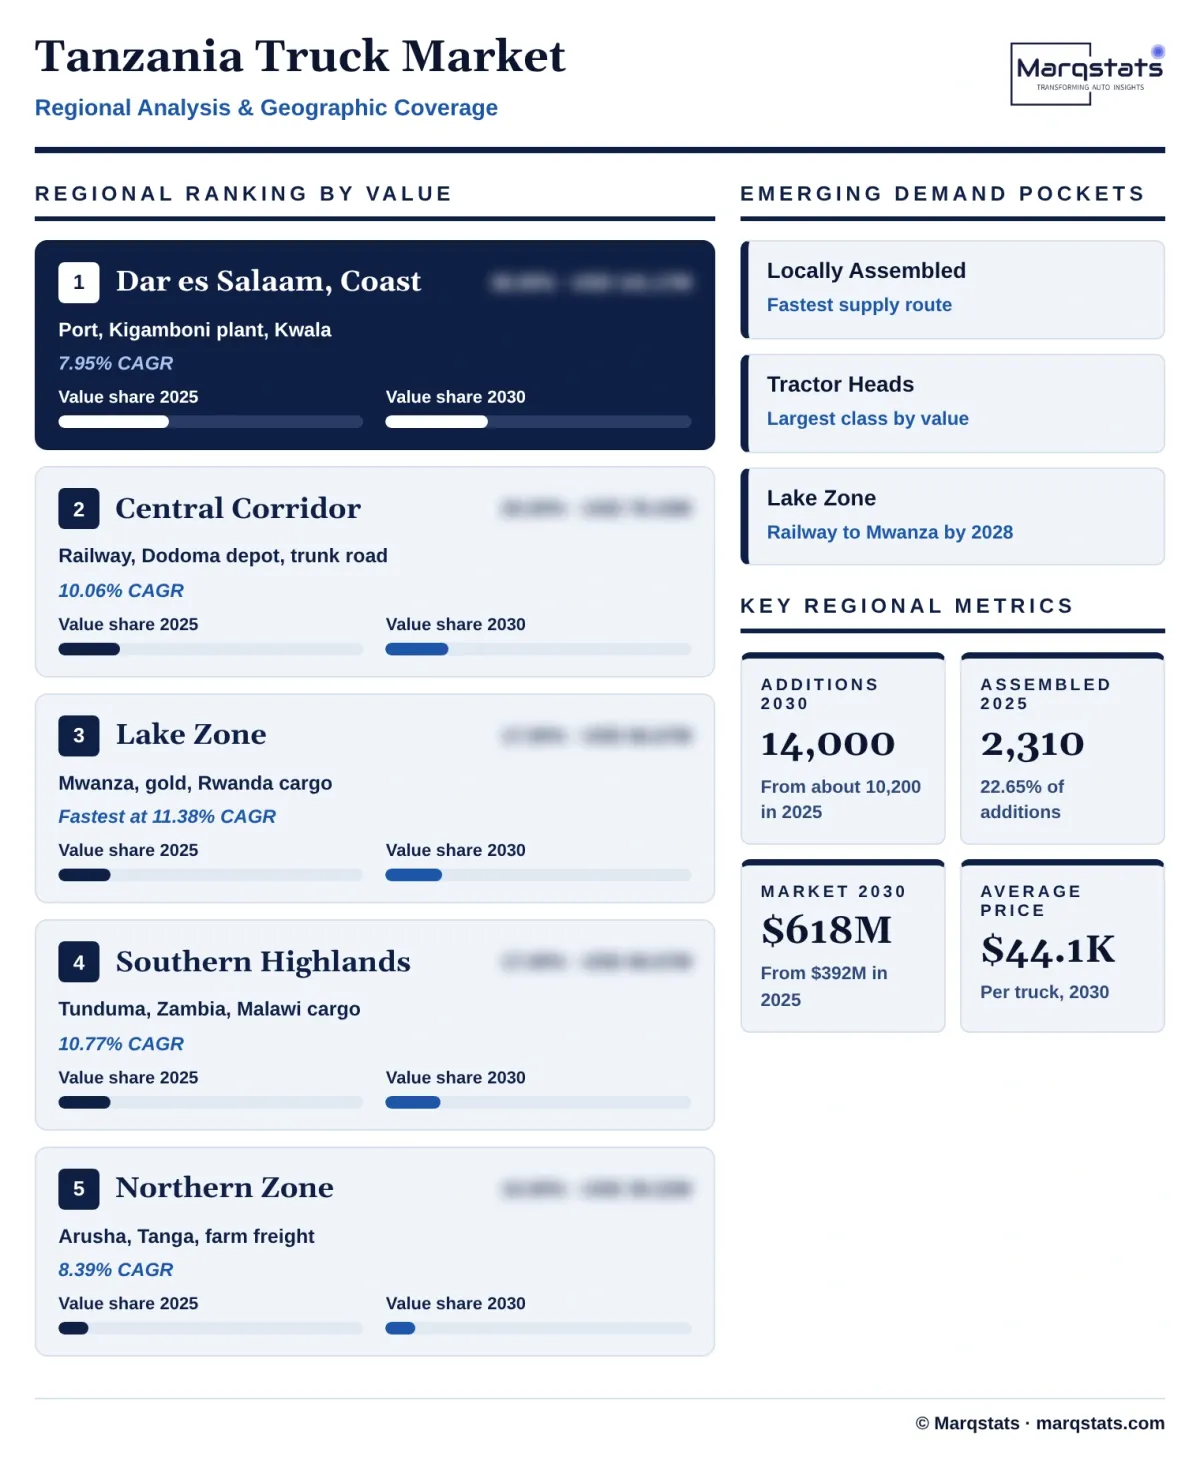
Tractor heads account for 54.37% of 2025 value and locally assembled trucks for 32.56%, a share that grows fastest, at 17.78% a year. Dar es Salaam and the Coast account for 36.00% of value, and the Lake Zone, where the railway to Mwanza is due by the end of 2028, grows fastest among regions at 11.38% a year.
Key Takeaways
Market Overview & Analysis
Report Summary
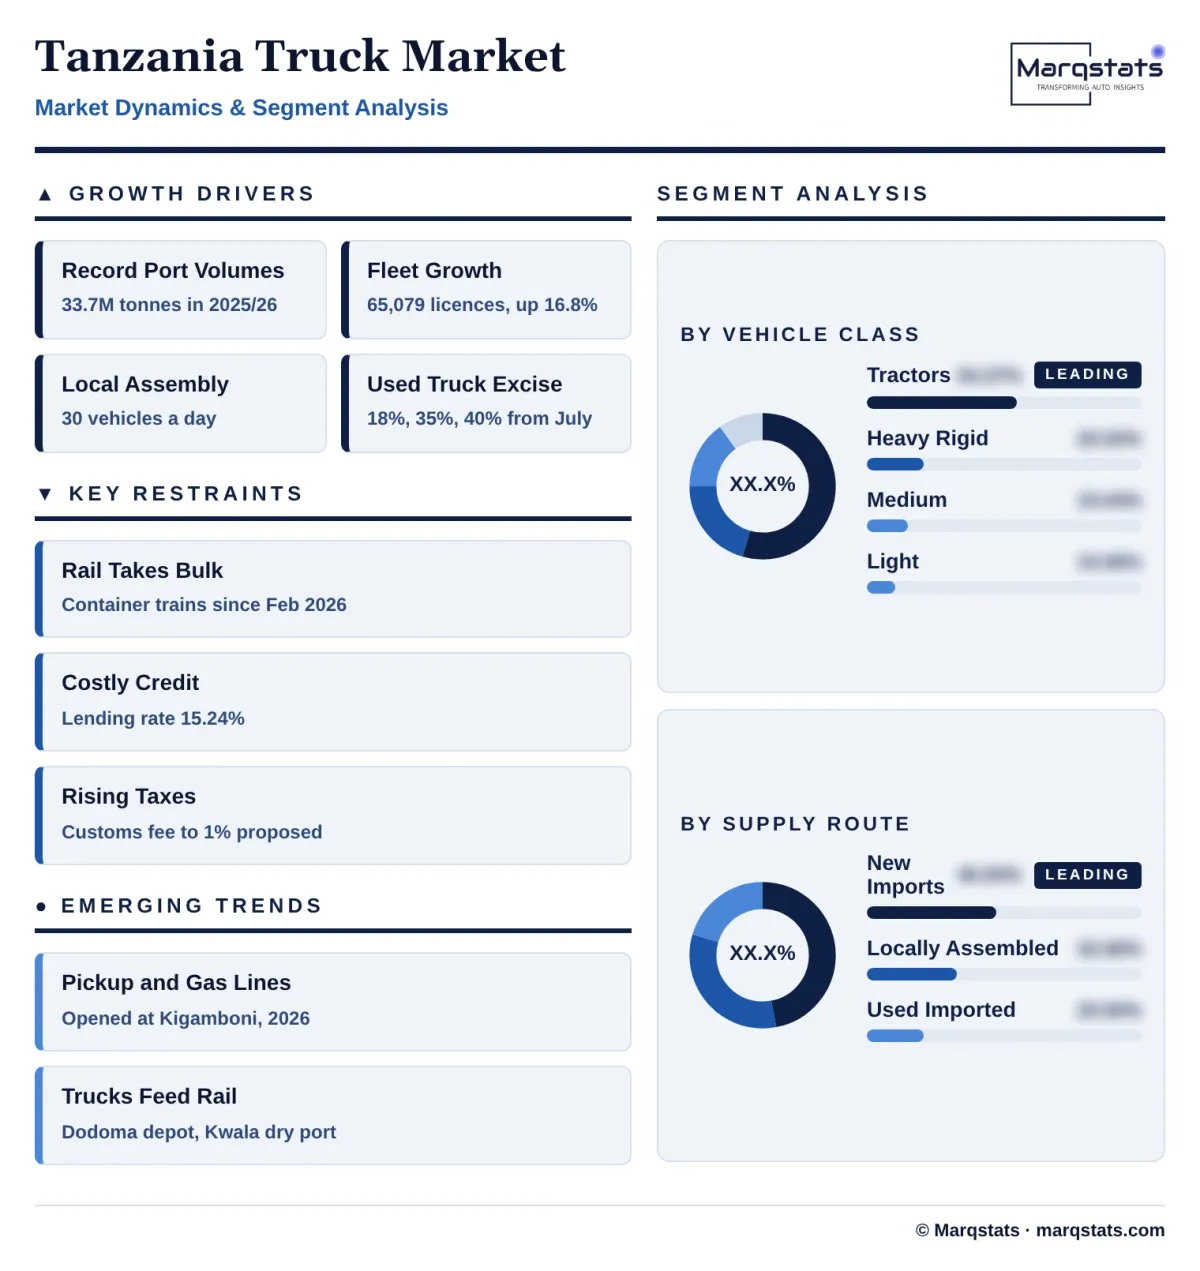
Tanzania is the sea gateway for six landlocked neighbours, and the numbers jumped in 2025 and 2026. The Port of Dar es Salaam handled a record 33.7 million tonnes in the 2025/26 financial year against 27.7 million tonnes a year earlier, an increase of 21.66%, and the Land Transport Regulatory Authority (LATRA) licensed 65,079 goods-carrying vehicles in the fourth quarter of 2025/26, 16.8% more than the 55,708 licensed a year earlier.
Marqstats sizes the Tanzania truck market as the acquisition value of goods trucks above 3.5 tonnes gross vehicle weight that enter the fleet each year. It counts light trucks of 3.5 to 7.5 tonnes, medium trucks of 7.5 to 16 tonnes, heavy rigid trucks above 16 tonnes and tractor heads, whether bought new from importers, assembled in Tanzania from semi-knocked-down kits or imported used. Pickups, vans, buses, trailers and agricultural tractors are excluded. Tanzania buys the full range of Chinese, Japanese, Indian, South African and European trucks, so Marqstats counts all three supply routes in one market and reports each route as its own segment.
The fleet is large, growing and old at the same time. LATRA licence records for the fourth quarter of 2025/26 show that 38.5% of licensed goods vehicles, or 25,053 vehicles, are up to 5 years old, while 15.0%, or 9,779 vehicles, are more than 30 years old and a further 11.8% are 26 to 30 years old. Class C8 vehicles of 31 tonnes and above, mostly heavy combinations, account for 35.1% of licences and grew 21.0% in a year, and Class C3 trucks of 6 to 10 tonnes account for 36.1% and grew 19.6%. The pairing of fast growth and a very old tail is the base for both replacement and expansion demand.
Policy changed in 2026. The Finance Act 2026, effective 1 July 2026, set excise duty on imported used vehicles at 18% for those older than 8 years and up to 10 years, 35% for those older than 10 and up to 20 years, and 40% for those older than 20 years, and it kept locally assembled road tractors under bond outside the Industrial Development Levy. The measures arrive as Saturn Corporation Limited lifted assembly capacity at Kigamboni from 10 to 30 vehicles a day in May 2026 and as the Standard Gauge Railway began container trains to the Ihumwa inland container depot at Dodoma in February 2026.
The market is estimated to have grown from USD 204.11 million in 2021, when about 6,300 trucks were added, to USD 338.54 million in 2022 as imports of goods vehicles under HS 8704 rose from USD 182.23 million to USD 302.25 million, then held near USD 334.15 million in 2023 and USD 361.99 million in 2024. It grew 8.33% to USD 392.16 million in 2025, equal to about TZS 1,004.0 billion at the 2025 average rate of TZS 2,560.3 per US dollar. All history is a Marqstats estimate anchored on customs values.
Tanzania Truck Market Size and Forecast
The Tanzania truck market grows from USD 392.16 million in 2025 to USD 617.71 million in 2030, a CAGR of 9.51%. Volume supplies most of the gain: additions rise at 6.54% a year, from about 10,200 to 14,000 trucks, and the average value per truck rises at 2.79% a year, from about USD 38,447 to USD 44,122, because tractor heads and locally assembled trucks take a larger share of additions while cheaper used trucks lose share.
The 2025 value is built bottom-up from classes, supply routes and prices. Marqstats estimates 2,150 light trucks, 2,150 medium trucks, 1,700 heavy rigid trucks and 4,200 tractor heads. A new imported tractor head is valued at about USD 61,000, a locally assembled one at about USD 54,000 at the assembler gate and a used one at about USD 30,000, while a used light truck is valued at about USD 11,500 and a new heavy rigid truck at about USD 56,000. A new tractor head at USD 61,000 equals about TZS 156.2 million at the 2025 average rate, before duties, taxes and dealer margins.
The unit base is checked against LATRA licence records. Licensed goods vehicles rose by 9,371 in the year to the fourth quarter of 2025/26, of which 5,452 sit in Classes C2 to C7 and 3,968 in Class C8. Marqstats estimates 6,000 rigid trucks and 4,200 tractor heads were added in 2025, which equals the net rise plus replacement of about 1.49% of the opening licensed fleet, a low retirement rate for a fleet in which 15.0% of vehicles are older than 30 years.
The value base is checked against customs data. Imports of goods vehicles under HS 8704 from 17 named origins summed to USD 350.12 million in 2025, from USD 182.23 million in 2021, USD 302.25 million in 2022 and USD 298.33 million in 2023, and Marqstats estimates that about half of that value is trucks above 3.5 tonnes, with the rest in pickups, vans and light chassis. Road tractors enter under HS 8701, where imports were USD 179.88 million in 2021, USD 392.03 million in 2022 and USD 418.67 million in 2023, with China supplying 56% in 2023. The market value of USD 392.16 million is built from units and prices, not from these totals, and it is consistent with them once Tanzanian re-exports, which were USD 16.49 million in 2023, and Saturn exports are removed.
Locally assembled trucks add value faster than volume. Marqstats expects assembled units to rise from 2,310 in 2025 to 5,230 in 2030 and natural gas trucks from 20 to 600, while used imports slip from 3,960 to 3,600. Gas trucks are priced at about 1.20 times a diesel truck of the same class, which lifts their share of value to 5.10% in 2030. Marqstats assumes the Kigamboni plant averaged about 225 tractor heads and 50 tippers a month in 2025, below its disclosed peak of 290 and 65, and sold 70% at home. Marqstats tracks four indicators: monthly licence counts from LATRA, Saturn output and capacity statements, customs entries under HS 8704 and 8701, and Standard Gauge Railway freight volumes against port throughput.
Market Dynamics
Key Drivers
Five forces are lifting demand for trucks in Tanzania, and each one favours heavier vehicles and newer supply.
- The port and the transit corridors create steady demand. The Port of Dar es Salaam handled a record 33.7 million tonnes in 2025/26, up 21.66% from 27.7 million tonnes, and about 3,100 heavy trucks leave the port every day. Transit cargo to the Democratic Republic of the Congo reached 7,239,741 tonnes in 2025, up 73.2% from 4,180,902 tonnes in 2024, with Zambia at 3.5 million tonnes and Rwanda at 2.2 million tonnes, and every tonne of it needs tractor heads.
- The licensed fleet is growing and ageing. LATRA licensed 65,079 goods vehicles in the fourth quarter of 2025/26, up 16.8% from 55,708, with Class C8 up 21.0% and Class C3 up 19.6%. At the same time 26.8% of licensed vehicles are older than 25 years, so owners must renew as well as expand.
- Local assembly lowers the landed price of heavy trucks. Saturn Corporation Limited opened a USD 20 million Kigamboni plant on 9 May 2024 with stated capacity of up to 30 tractors and 9 lorries a day, and in May 2026 the government reported that daily capacity had risen from 10 to 30 vehicles with more than TZS 65 billion of investment and set a target of 100 vehicles a day. Assemblers of motor vehicles can claim a corporate tax rate of 10% for five years under a performance agreement, against the standard 30%.
- The tax code now penalises older used trucks. From 1 July 2026 the Finance Act 2026 charges excise of 18%, 35% and 40% on imported used vehicles older than 8, 10 and 20 years, which narrows the price gap between a used Japanese or European truck and a new Chinese one and moves demand to new and assembled units.
- Rail and dry-port construction needs tippers and tractors. The Standard Gauge Railway between Makutupora and Mwanza is targeted for operation by the end of 2028 under contractors including Yapi Merkezi, the Kwala dry port, about 80 kilometres from Dar es Salaam, opened in 2025, and the rail extension into the port is scheduled for 2027, all of which draw heavy rigid trucks and low-loaders.
Key Restraints
Four constraints slow the market or cap its growth, even as the port and the fleet expand.
- The railway takes bulk cargo from the road. Freight on the Standard Gauge Railway between Dar es Salaam and Dodoma began in July 2025, container trains began running to the Ihumwa inland container depot in February 2026, and the line is due to reach the port in 2027 and Mwanza by the end of 2028, so the longest and heaviest hauls will move to rail over the forecast.
- Credit is costly. The Bank of Tanzania reported an overall lending rate of 15.24% in December 2025 and a prime-customer rate of 12.38%, and trucks are priced in dollars, so a haulier buying a USD 61,000 tractor head pays about TZS 156.2 million at the 2025 average rate and finances it at rates above 12%.
- Taxes keep rising. The 2026/27 Budget Speech of 11 June 2026 proposed lifting the customs processing fee from 0.6% to 1% of free-on-board value and an excise framework with an initial 8% increase in 2026/27, so landed costs rise for fully built and used units even as local assembly gains relief.
- Assembly depends on imported parts. Saturn said that one lorry needs about 2,400 parts and that most are imported, so local assembly adds labour and logistics value but leaves the assemblers exposed to Chinese supply and exchange rates.
Key Trends
Four shifts are changing who builds trucks for Tanzania, how they are fuelled and where they run.
- Assembly widens from heavy trucks to pickups and gas. Saturn unveiled a Sinotruk Bolden pickup line and laid the foundation stone of a pickup plant in May 2026, and The Citizen reported on 19 April 2026 that the assembler was expanding into compressed natural gas lorries.
- Natural gas moves from cars to trucks. About 7,000 vehicles ran on compressed natural gas by June 2024, nine filling stations operated in Dar es Salaam by April 2025, and gas sold at about TZS 1,234 per kilogram against a petrol price cap of TZS 2,752 per litre in November 2025.
- Trucks become feeders to rail. Container trains from Dar es Salaam to Dodoma since February 2026 create a hub-and-spoke pattern, with tractor heads moving boxes between the Ihumwa depot, the Kwala dry port and the port while the heaviest bulk loads move by train.
- Renewal rises in the middle-aged fleet. Vehicles up to 5 years old are 38.5% of licences, but vehicles aged 6 to 10 years are only 9.3% and those aged 11 to 15 years are 11.0%, a mid-life trough that leaves the fleet split between new units and very old ones.
Strategic Implications
- For truck makers, the route into Tanzania runs through a kit supply agreement with a local assembler. Fully built units pay the full customs duty, while kits assembled under bond meet a lighter tax burden, so a manufacturer without an assembler partner sells into the 38.53% of units that arrive as new imports, not the 22.65% that are assembled.
- For hauliers, tractor-head renewal is the main spending decision. A new Sinotruk-type tractor assembled in Kigamboni sits about USD 7,000 below an imported new unit at the gate, and the Finance Act 2026 adds 35% to 40% excise to used units older than 10 years, so a fleet owner replacing a 20-year-old unit should price a new assembled tractor against a used import on a total cost basis.
- For importers of used trucks, the Finance Act 2026 narrows the market for older units. Units aged 8 to 10 years now pay 18% and those aged 10 to 20 years pay 35%, so importers should shift stock toward units under 8 years old and toward the light and medium classes, where used trucks still carry a price gap of more than USD 15,000 over new ones.
- For lenders and lessors, rates above 12% make asset-backed contracts the safest route into the market. Financing tied to long-term cargo contracts at the port, the mines and the transit corridors suits the Class C8 tractor head, which carries the highest value and the largest volume.
- For suppliers of parts and service, a licensed fleet in which 26.8% of vehicles are older than 25 years and 38.5% are up to 5 years old needs two offers: low-cost spares and rebuilds for old Japanese and European trucks, and warranty and parts depots for Sinotruk, SHACMAN and Tata trucks at Dar es Salaam, Mbeya and Mwanza.
Market Segmentation
Tractor heads for semi-trailers account for 54.37% of 2025 value, USD 213.21 million, and grow fastest, at 10.83% a year, to USD 356.59 million and 57.73% of the market. About 4,200 units were added in 2025 and Marqstats expects 6,500 in 2030, a 9.13% unit rate, mainly 6x4 Sinotruk, SHACMAN and Tata tractors for container and bulk haulage from the port to the Democratic Republic of the Congo, Zambia and Rwanda.
Heavy rigid trucks above 16 tonnes account for 20.53% of 2025 value, USD 80.50 million, and grow at 8.82% a year to USD 122.86 million and 19.89% of the market. About 1,700 units were added in 2025, mostly six-wheel and eight-wheel tippers, tankers and cargo trucks used in construction, quarrying and fuel and cement haulage.
Medium trucks of 7.5 to 16 tonnes account for 15.04% of 2025 value, USD 59.00 million, and grow at 7.33% a year to USD 84.03 million. About 2,150 units were added in 2025, mainly Isuzu, Mitsubishi Fuso, Tata and Eicher models of 6 to 10 tonnes that carry agricultural produce and wholesale goods, the load band behind the 19.6% rise in Class C3 licences.
Light trucks of 3.5 to 7.5 tonnes account for 10.06% of 2025 value, USD 39.45 million, and grow slowest, at 6.57% a year, to USD 54.23 million. About 2,150 units were added in 2025, mostly used Japanese cab-over trucks bought by small distributors and food and beverage firms, while the pickup and light commercial line opened at Kigamboni in 2026 is the first local supply for the class.
New imported trucks account for 46.94% of 2025 value, USD 184.08 million, and grow at 6.41% a year to USD 251.19 million and 40.66% of the market. About 3,930 units arrive each year, from Chinese, Indian, Japanese and European makers, with China supplying USD 125.97 million of the USD 350.12 million of HS 8704 imports in 2025.
Locally assembled trucks account for 32.56% of 2025 value, USD 127.68 million, and grow fastest, at 17.78% a year, to USD 289.40 million and 46.86% of the market. Marqstats estimates 2,310 units in 2025, almost all Sinotruk HOWO tractors and tippers from the Saturn Corporation Limited plant at Kigamboni, and 5,230 units in 2030, which implies total plant output near 7,471 units once exports are added.
Used imported trucks account for 20.50% of 2025 value, USD 80.40 million, and slip at 0.83% a year to USD 77.12 million and 12.48% of the market, even though units fall only from 3,960 to 3,600. Japanese and European units dominate, and the Finance Act 2026 excise of 18%, 35% and 40% for older units shifts the mix toward younger and cheaper vehicles.
Diesel trucks account for 99.77% of 2025 value, USD 391.24 million, and grow at 8.42% a year to USD 586.21 million, while their share eases to 94.90%. Nearly every truck in the fleet runs on diesel, and the gas line opened in 2026 is the first change to that position.
Natural gas trucks, whether factory-built or dual-fuel, account for 0.23% of 2025 value, USD 0.92 million, from about 20 units, and Marqstats expects about 600 units and 5.10% of value in 2030. Growth is limited by filling stations, which numbered nine in Dar es Salaam in April 2025, so Marqstats publishes the absolute values and the share shift, not a growth rate, for a base this small.
Transit and corridor freight accounts for 49.24% of 2025 value, USD 193.09 million, and grows at 10.76% a year to USD 321.84 million and 52.10% of the market. It covers tractor heads and heavy rigids serving the port, the dry ports and the routes to the Democratic Republic of the Congo, Zambia, Rwanda, Burundi and Malawi.
Construction, mining and quarrying account for 26.24% of 2025 value, USD 102.90 million, and grow at 8.47% a year to USD 154.53 million. Tippers and mixers serve railway, road and dam works and the Lake Zone gold belt, and growth depends on public investment keeping pace.
Agriculture and food distribution account for 14.50% of 2025 value, USD 56.88 million, and grow at 7.52% a year to USD 81.74 million. Medium trucks collect maize, cashew, coffee and tea and deliver fertiliser and processed food between farms, mills and cities.
Urban distribution, retail and other use accounts for 10.02% of 2025 value, USD 39.29 million, and grows at 8.69% a year to USD 59.60 million. Light and medium trucks serve wholesalers, beverage firms and municipal services in Dar es Salaam, Arusha and Mwanza.
By Geography
Dar es Salaam and Coast
Dar es Salaam and the Coast account for 36.00% of 2025 value, USD 141.17 million, and grow at 7.95% a year to USD 206.93 million and 33.50% by 2030. The port, the Kigamboni assembly plant and the Kwala dry port sit here, and registration at head offices overstates the region because trucks registered in the capital spend most of their time on the corridors. Marqstats allocates value by registration, as buyers and lenders do.
Central Corridor
The Central Corridor, covering Morogoro, Dodoma, Singida, Tabora and Shinyanga, accounts for 20.00% of 2025 value, USD 78.43 million, and grows at 10.06% a year to USD 126.63 million. The Standard Gauge Railway, the Ihumwa inland container depot at Dodoma and the trunk road to the lake and the west make it the heart of heavy haulage, and it also sees the first loss of bulk cargo to rail.
Lake Zone
The Lake Zone, covering Mwanza, Geita, Kagera, Mara, Simiyu and Kigoma, accounts for 17.00% of 2025 value, USD 66.67 million, and grows fastest, at 11.38% a year, to USD 114.28 million and 18.50% by 2030. Rwanda cargo of 2.2 million tonnes and Burundi cargo of 494,698 tonnes in 2025, gold and construction demand, and the Mwanza railway due by the end of 2028 sustain tipper and tractor demand.
Southern Highlands and South
The Southern Highlands and South, covering Mbeya, Songwe, Iringa, Njombe, Ruvuma, Rukwa, Katavi, Lindi and Mtwara, account for 17.00% of 2025 value, USD 66.67 million, and grow at 10.77% a year to USD 111.19 million. Zambia cargo of 3.5 million tonnes and Malawi cargo of 719,838 tonnes in 2025 move through Tunduma and Mbeya, and farm freight from the highlands adds medium-truck demand.
Northern Zone
The Northern Zone, covering Arusha, Kilimanjaro, Manyara and Tanga, accounts for 10.00% of 2025 value, USD 39.22 million, and grows at 8.39% a year to USD 58.68 million. Arusha is home to Hanspaul Automechs Limited, a body builder and chassis importer, and Tanga port, tourism and farm freight support light and medium trucks, but the zone loses share as heavy corridor volume shifts west and south.
How Competition Is Evolving
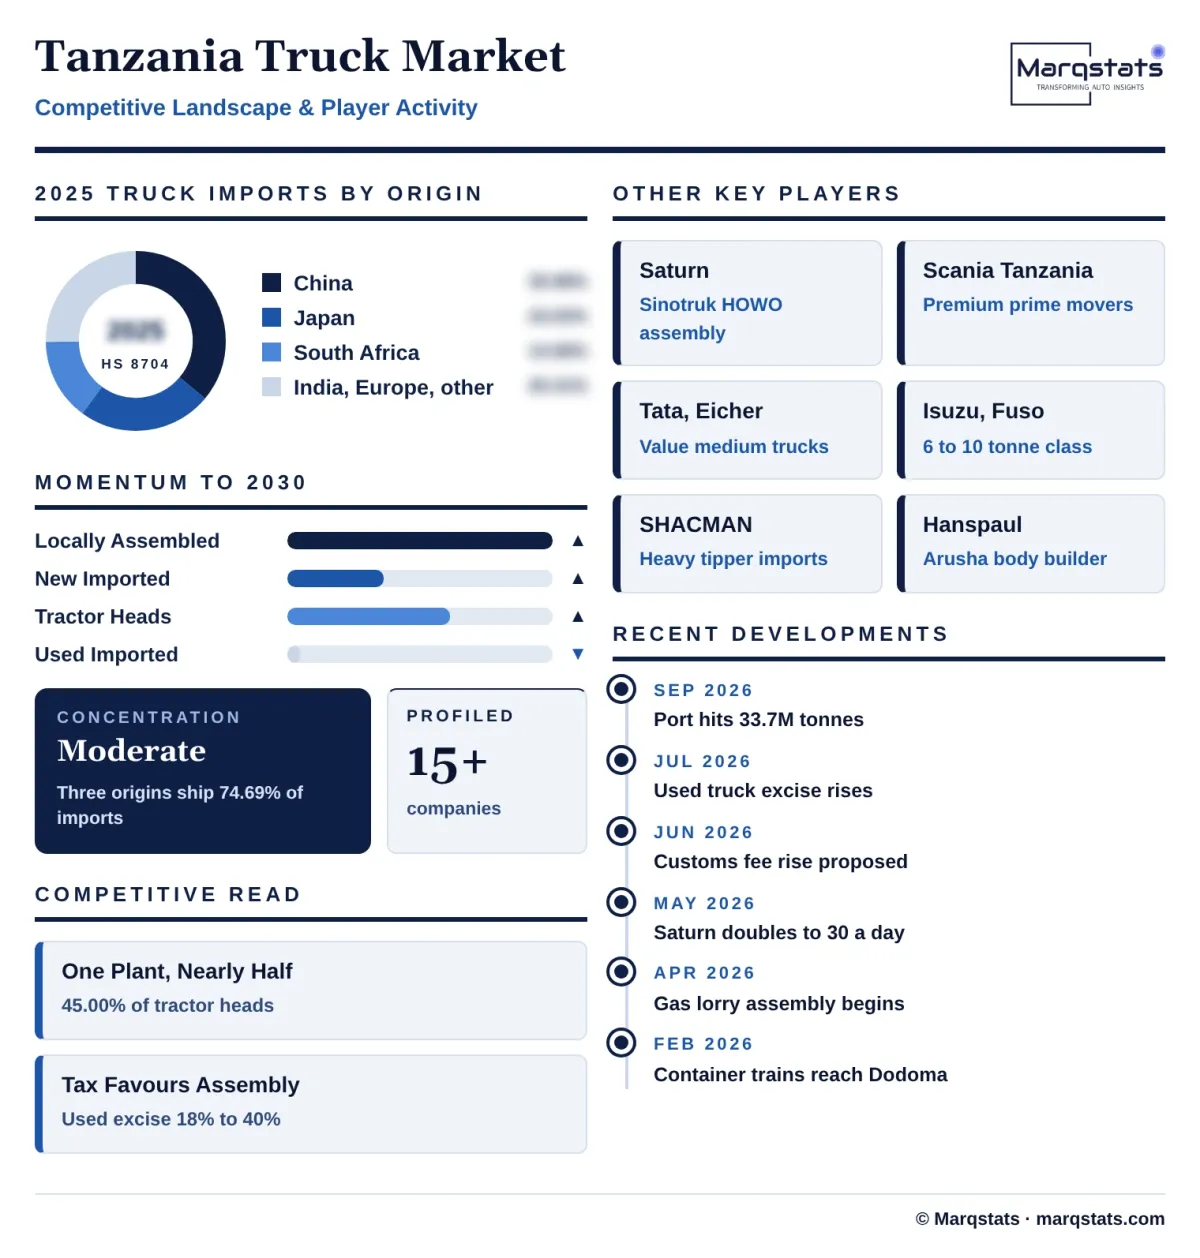
The market is moderately concentrated by supply layer and split among many brands. Marqstats describes competition by origin and supply route instead of brand shares. By origin of HS 8704 imports in 2025, China supplied 35.98%, Japan 24.03% and South Africa 14.68% of the USD 350.12 million recorded, together 74.69%, with India at 10.19% and Europe at 7.16%. Locally assembled trucks are 22.65% of Marqstats units, almost all from Saturn Corporation Limited. A group-level league table is built in the delivered analysis.
Chinese makers compete on price and availability, Japanese makers on resale value and service, and European makers on uptime in mining and fuel haulage. A locally assembled Sinotruk tractor head is valued about USD 7,000 below an imported new one at the gate, Isuzu and Mitsubishi Fuso trucks keep the 6 to 10 tonne class, Scania Tanzania Limited sells premium prime movers with parts depots at Dar es Salaam, Mwanza and Mbeya, and Tata and Eicher offer value-priced medium and heavy trucks.
Structure is set by assembly and tax. Saturn built its USD 20 million plant with Sinotruk International, sells about 70% at home and exports about 30% to the Democratic Republic of the Congo, Zambia, Rwanda, Burundi, Uganda and Malawi, and says it assembled more than 1,500 trucks in its first year. Corporate tax of 10% for five years for assemblers and the Industrial Development Levy relief for locally assembled road tractors under bond make the Kigamboni route cheaper than imports, while rivals that rely on imports face the Finance Act excise and the customs duty on fully built units.
Companies Covered
Companies covered in the report include:
Recent Market Activity
Table of Contents
Coverage & Segmentation
The study covers the Tanzania truck market, with 2025 as the base year, 2021 – 2025 as the historical period and 2026 – 2030 as the forecast period. It covers new and used goods trucks above 3.5 tonnes gross vehicle weight and road tractor heads entering the Tanzanian fleet, whether imported or assembled from kits, segmented by vehicle class, supply route, powertrain, end use and region. Values are acquisition values at the importer or assembler gate in US dollars, before customs duties, taxes and dealer margins, and shilling figures use the 2025 average of TZS 2,560.3 per US dollar.
Pickups and vans below 3.5 tonnes, buses and minibuses, trailers and bodies sold separately, agricultural tractors, forklifts and off-road mining machines are excluded, as are trucks that Saturn Corporation Limited exports to neighbouring countries. Segment and regional splits are Marqstats estimates built on customs values, LATRA licence records, plant disclosures and price benchmarks. Live Marqstats reports on Africa Chinese commercial vehicles and Africa commercial vehicle aftermarket are broader parents, and their figures should not be added to this market.