Market Snapshot
Key Takeaways
Market Overview & Analysis
Report Summary
This analysis sizes the United States automotive digital twin synthesis software market, encompassing high-fidelity multi-body physics solvers, phenomenological and neural sensor simulation pipelines, and stochastic scenario engines that synthesize automotive hardware, sensor environments, and vehicle operational design domains. The market is built from a top-down anchor against the National Science Foundation's Business Enterprise Research and Development Survey, calibrated bottom-up against corporate revenue disclosures from major engineering software and electronic design automation vendors. The market is sized in USD across a 2020-2024 historical period and a 2025-2030 forecast period, with 2024 as the base year.
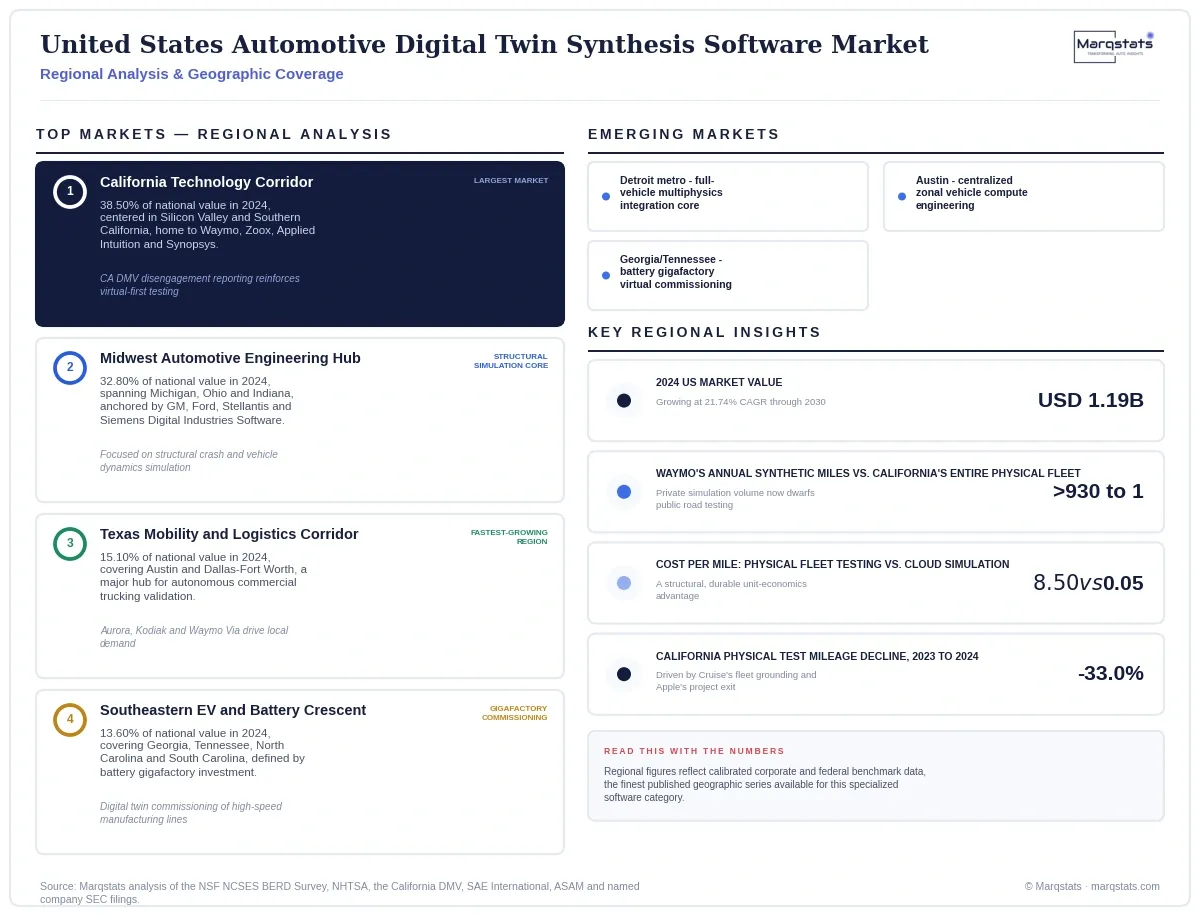
The United States automotive digital twin synthesis software market grew from USD 582.40 million in 2020 to USD 1,185.00 million in 2024, a 19.43% compound annual growth rate, and is projected to reach USD 3,858.00 million by 2030, a 21.74% compound annual growth rate. This growth reflects the automotive industry's structural transition toward centralized software-defined vehicle zonal computing architectures, which cannot wait for physical silicon or prototype vehicles to validate their codebases, decoupling software development from hardware manufacturing and enabling continuous virtual integration earlier in the design cycle.
The baseline 2030 forecast of USD 3,858.00 million assumes consistent, step-by-step implementation of software-defined vehicle architectures by major US automakers, with ASAM OpenSCENARIO 2.0 serving as the primary scenario interchange format and commercial autonomous mobility operations continuing gradual expansion without major regulatory disruption. The binding upside condition, reaching USD 4,719.45 million at a 25.89% CAGR, is whether NHTSA establishes formal statutory frameworks allowing validated digital twin simulation data to satisfy Federal Motor Vehicle Safety Standards crash-avoidance certification credits by 2027; the binding downside condition, reaching only USD 2,842.15 million at a 15.71% CAGR, is whether high-profile autonomous vehicle accidents lead federal or state regulators to restrict commercial driverless operations, slowing robotaxi fleet deployments and delaying software-defined vehicle roadmaps.
Market Dynamics
Key Drivers
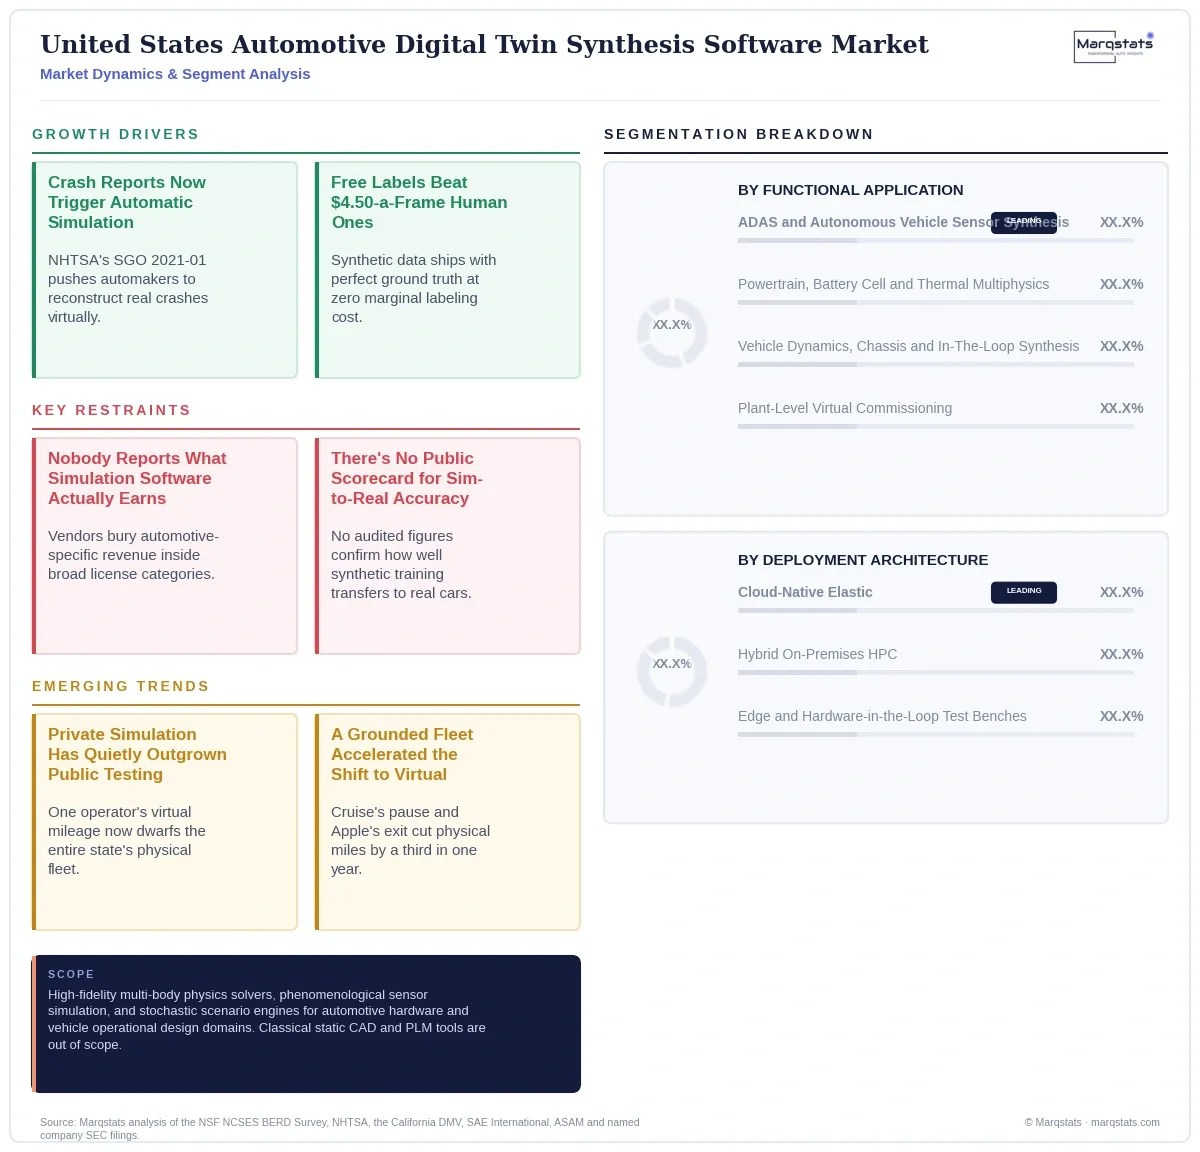
- NHTSA's Standing General Order 2021-01, revised in March 2025, mandates that autonomous operators and OEMs report crashes involving SAE Level 2 ADAS and Levels 3 to 5 Automated Driving Systems within strict timeframes, compelling manufacturers to use digital twin synthesis engines to ingest recorded telemetry, reconstruct incident geometry, and repeatedly simulate sensor countermeasures before updating vehicle firmware.
- Synthetic data pipelines eliminate expensive human data-labeling overhead: manually annotating real camera and lidar data costs USD 1.20 to USD 4.50 per frame, while synthetic generation software delivers pre-annotated ground-truth data for semantic classes, surface normals, depth maps and dynamic trajectories at zero marginal labeling cost.
- The transition toward high-voltage electric vehicle architectures requires continuous digital twin modeling of electro-thermal-chemical reactions during ultra-fast DC charging, dendrite growth, and structural battery-pack integrity, sustaining 20.74% compound annual growth in powertrain and battery cell synthesis software through 2030.
- Legacy automotive OEMs including General Motors, Ford, Stellantis, and the US engineering divisions of Toyota and Honda are using digital twin synthesis to compress the traditional 48-month vehicle design timeline down to 24 months, replacing costly physical crash sleds and track prototypes with virtual vehicle sign-off procedures.
- California Department of Motor Vehicles disengagement and mileage reporting requirements create strong public transparency incentives for autonomous vehicle operators to shift extensive scenario testing off public streets and into proprietary virtual environments, anchoring the California Technology Corridor as the largest of four distinct US geographic engineering clusters.
Key Restraints
- Public engineering software vendors including Synopsys, Siemens, Dassault Systèmes and PTC report revenues aggregated into broad software license, maintenance and regional buckets without disclosing standalone automotive synthesis software revenue, requiring empirical calibration against broader federal research and development benchmarks rather than direct corporate disclosure.
- Neither automotive manufacturers nor simulation developers publicly report standardized, third-party audited figures detailing synthetic-to-real domain transfer errors or perception model degradation when models trained on synthetic data are deployed to physical silicon, leaving a genuine empirical gap in verifying simulation fidelity claims.
- Autonomous driving developers do not report total GPU hours, server core allocations, or cloud compute expenditures to regulatory bodies including the California DMV or NHTSA, meaning public oversight of this market remains tied entirely to physical road incident reports and disengagement data even as private simulation volume dwarfs physical testing.
- Automotive OEMs and Tier-1 suppliers risk fragmented engineering pipelines if individual engineering departments purchase disconnected simulation tools rather than establishing unified enterprise digital twin environments built on open standards including ASAM OpenSCENARIO 2.0 and OpenUSD, a coordination challenge that remains unresolved industry-wide.
Key Trends
- The scale disparity between physical and virtual testing volume represents a genuine structural transformation of how vehicle safety validation actually happens, not merely a cost optimization: Waymo's estimated 3.65 billion annual synthetic miles exceeding California's entire licensed fleet's physical mileage by more than 930 to 1 indicates that the overwhelming majority of real-world-relevant safety validation for autonomous driving now occurs inside private cloud simulation environments largely invisible to public regulatory oversight.
- California's 33.0% year-over-year decline in physical autonomous test mileage, driven substantially by Cruise's fleet grounding and Apple's project termination, demonstrates that physical road testing contraction and simulation volume expansion are directly linked events rather than independent trends, since operators facing safety incidents or strategic exits shift remaining validation work into virtual environments rather than simply reducing total testing activity.
- The roughly 170-fold cost differential between physical fleet testing (a median USD 8.50 per mile) and cloud-based synthetic simulation (approximately USD 0.05 per mile) represents a genuine, durable unit-economics advantage rather than a temporary pricing anomaly, meaning the shift toward simulation-dominant validation is very likely to continue independent of any single regulatory or safety event.
- The consolidation of computer-aided engineering around Synopsys' acquisition of Ansys and Siemens' acquisition of Altair, both independently verified transactions establishing integrated silicon-to-vehicle simulation stacks, mirrors the same competitive dynamic documented in the broader global automotive digital twin market, indicating the US market is not an isolated case but part of a coordinated worldwide industry consolidation.
- The absence of any public reporting requirement for cloud compute expenditure, GPU hours, or synthetic mileage volume from autonomous vehicle developers means that current regulatory oversight, anchored entirely in physical road incident and disengagement data, covers a shrinking fraction of the actual safety validation work occurring across the industry.
Strategic Implications
For an emerging simulation technology entrant, competing directly against entrenched mechanical simulation solvers including Radioss, LS-DYNA or Simcenter Amesim faces substantial barriers given their deep integration into OEM crashworthiness certification pipelines; new entrants should instead target unresolved technical bottlenecks including high-speed neural sensor reconstruction from fleet video logs, generative edge-case synthesis, and automated ISO 21448 SOTIF compliance auditing, while demonstrating closed-loop integration with common developer toolchains to win business from OEMs and autonomy developers.
For an incumbent simulation software vendor, particularly the newly combined Synopsys-Ansys and Siemens-Altair entities, modernizing legacy on-premises desktop engineering solvers into containerized, cloud-native microservices capable of scaling across hyperscale cloud providers is an immediate operational priority; vendors must also bridge electronic design automation workflows with vehicle-level dynamic models to enable co-simulation of silicon-level power transients alongside high-level vehicle dynamic control algorithms within a single virtual environment.
For an automotive OEM or Tier-1 supplier, establishing unified enterprise digital twin environments built on open standards including ASAM OpenSCENARIO 2.0 and OpenUSD is essential to avoid fragmented engineering pipelines from disconnected departmental tool purchases; OEMs should mandate that Tier-1 suppliers deliver verified, runnable digital twins alongside physical part prototypes, enabling virtual software-in-the-loop integration testing months before initial prototype assembly.
Outlook
Baseline case: USD 3,858.00 million by 2030 (21.74% six-year value CAGR). This trajectory assumes consistent, step-by-step implementation of software-defined vehicle architectures by major US automakers, with ASAM OpenSCENARIO 2.0 serving as the primary scenario interchange format across tier suppliers and commercial autonomous mobility operations continuing gradual expansion across southern and western US cities without major regulatory disruption.
Upside case: USD 4,719.45 million by 2030 (25.89% six-year value CAGR). The specific trigger is NHTSA establishing formal statutory frameworks allowing validated digital twin simulation data to satisfy Federal Motor Vehicle Safety Standards crash-avoidance certification credits, reducing physical prototype testing mandates, combined with accelerated commercial introduction of consumer SAE Level 3 automated driving systems across multiple production nameplates by 2027, requiring continuous automated virtual verification for all over-the-air firmware updates.
Downside case: USD 2,842.15 million by 2030 (15.71% six-year value CAGR). The specific trigger is high-profile autonomous vehicle accidents leading federal or state regulators to restrict commercial driverless operations, slowing robotaxi fleet deployments, combined with legacy automakers delaying software-defined vehicle roadmaps due to capital constraints and proprietary data silos preventing widespread adoption of open scenario standards.
Market Segmentation
ADAS and autonomous vehicle perception and scenario synthesis is the largest and fastest-growing category, accounting for 44.20% of the market (USD 523.77 million) in 2024 and expanding at a 23.35% compound annual growth rate to reach USD 1,844.12 million by 2030, driven by the need to generate photorealistic, physically accurate synthetic sensor data to train and test perception models without the risks and costs of real-world road operations.
Powertrain, battery cell and thermal multiphysics synthesis is the second-largest application, capturing 24.80% (USD 293.88 million) in 2024 and reaching USD 910.49 million by 2030 at a 20.74% compound annual growth rate, driven by the transition toward high-voltage electric vehicle architectures requiring continuous modeling of electro-thermal-chemical reactions and structural battery-pack integrity.
Vehicle dynamics, chassis and real-time in-the-loop synthesis represents 18.10% (USD 214.49 million) of the 2024 market, expanding to USD 632.71 million by 2030 at a 19.76% compound annual growth rate, encompassing multi-body chassis solvers and sub-millisecond real-time execution for Hardware-in-the-Loop test rigs.
Plant-level virtual commissioning and digital assembly synthesis accounts for 12.90% (USD 152.87 million) in 2024, projected to reach USD 470.68 million by 2030 at a 20.61% compound annual growth rate, as automotive manufacturers constructing new battery gigafactories and flexible EV assembly lines simulate entire factory layouts prior to physical hardware installation.
Cloud-native elastic deployment accounted for 52.60% (USD 623.31 million) of the 2024 US market, projected to reach USD 2,168.20 million by 2030 compounding at 23.08% annually, as cloud elasticity allows autonomy engineering teams to scale beyond on-premises hardware limits, enabling parallel execution of millions of scenario variations simultaneously.
Hybrid on-premises high-performance computing held 33.50% (USD 396.98 million) of the 2024 market, expanding to USD 1,176.69 million by 2030 at a 19.87% compound annual growth rate, as automotive OEMs maintain substantial on-premises compute clusters to protect core intellectual property including unreleased vehicle styling and proprietary suspension geometry.
Edge-in-the-loop and Hardware-in-the-Loop test benches represent 13.90% (USD 164.72 million) in 2024, projected to grow to USD 513.11 million by 2030 at a 20.85% compound annual growth rate, running real-time operating systems coupled to FPGA boards that inject simulated sensor streams into physical camera deserializers, radar processing units and vehicle domain controllers.
Legacy automotive OEMs represent the largest customer base, accounting for 39.50% (USD 468.08 million) of 2024 expenditure, expanding to USD 1,489.19 million by 2030 at a 21.28% compound annual growth rate, as established manufacturers including General Motors, Ford, Stellantis and the US engineering divisions of Toyota and Honda use digital twin synthesis to compress the traditional 48-month vehicle design timeline down to 24 months.
Dedicated autonomous mobility developers and robotaxi operators represent 25.40% (USD 300.99 million) of the 2024 market, growing at a 22.68% compound annual growth rate to reach USD 1,026.23 million by 2030, with organizations including Waymo LLC, Zoox, Inc. and Aurora Innovation, Inc. relying heavily on synthetic environments since physical road testing cannot expose vehicles to edge cases at scale without public safety risk.
Electric vehicle and software-defined vehicle challengers hold 19.80% (USD 234.63 million) of the market in 2024, projected to grow to USD 771.60 million by 2030 at a 21.94% compound annual growth rate, as companies including Tesla, Rivian and Lucid rely on digital twin synthesis for continuous regression testing of over-the-air firmware payloads across simulated vehicle fleets.
Tier-1 automotive subsystem suppliers constitute the remaining 15.30% (USD 181.31 million) of 2024 spend, reaching USD 570.98 million by 2030 at a 21.07% compound annual growth rate, as suppliers including Robert Bosch, Continental and ZF North America increasingly supply verified digital twin models of their radar, camera and braking modules alongside physical components.
By Geography
California Technology Corridor
The California Technology Corridor leads the market at 38.50% (USD 456.23 million) in 2024, projected to reach USD 1,539.34 million by 2030 compounding at 22.47% annually, centered in Silicon Valley and Southern California and reinforced by California Department of Motor Vehicles disengagement reporting rules that create strong incentives for operators to shift extensive scenario testing off public streets and into proprietary virtual environments.
Midwest Automotive Engineering Hub
The Midwest Automotive Engineering Hub represents 32.80% (USD 388.68 million) of 2024 spending, growing at a 21.11% compound annual growth rate to reach USD 1,226.84 million by 2030, spanning southeast Michigan, Ohio and Indiana and anchored by General Motors, Ford, Stellantis and Siemens Digital Industries Software focusing on high-fidelity structural mechanics and vehicle dynamics simulation.
Texas Mobility and Logistics Corridor
The Texas Mobility and Logistics Corridor accounts for 15.10% (USD 178.94 million) in 2024, forecast to reach USD 609.56 million by 2030 at a 22.66% compound annual growth rate, covering Austin and the Dallas-Fort Worth metroplex, where long-haul autonomous truck operators including Aurora, Kodiak and Waymo Via drive local demand for high-speed maneuver and adverse weather modeling.
Southeastern EV and Battery Crescent
The Southeastern EV and Battery Crescent holds 13.60% (USD 161.16 million) of the 2024 market, expanding to USD 482.25 million by 2030 at a 20.04% compound annual growth rate, covering Georgia, Tennessee, North Carolina and South Carolina, a manufacturing corridor defined by major investments in battery gigafactories and electric vehicle assembly facilities oriented toward digital twin commissioning of high-speed manufacturing lines.
How Competition Is Evolving
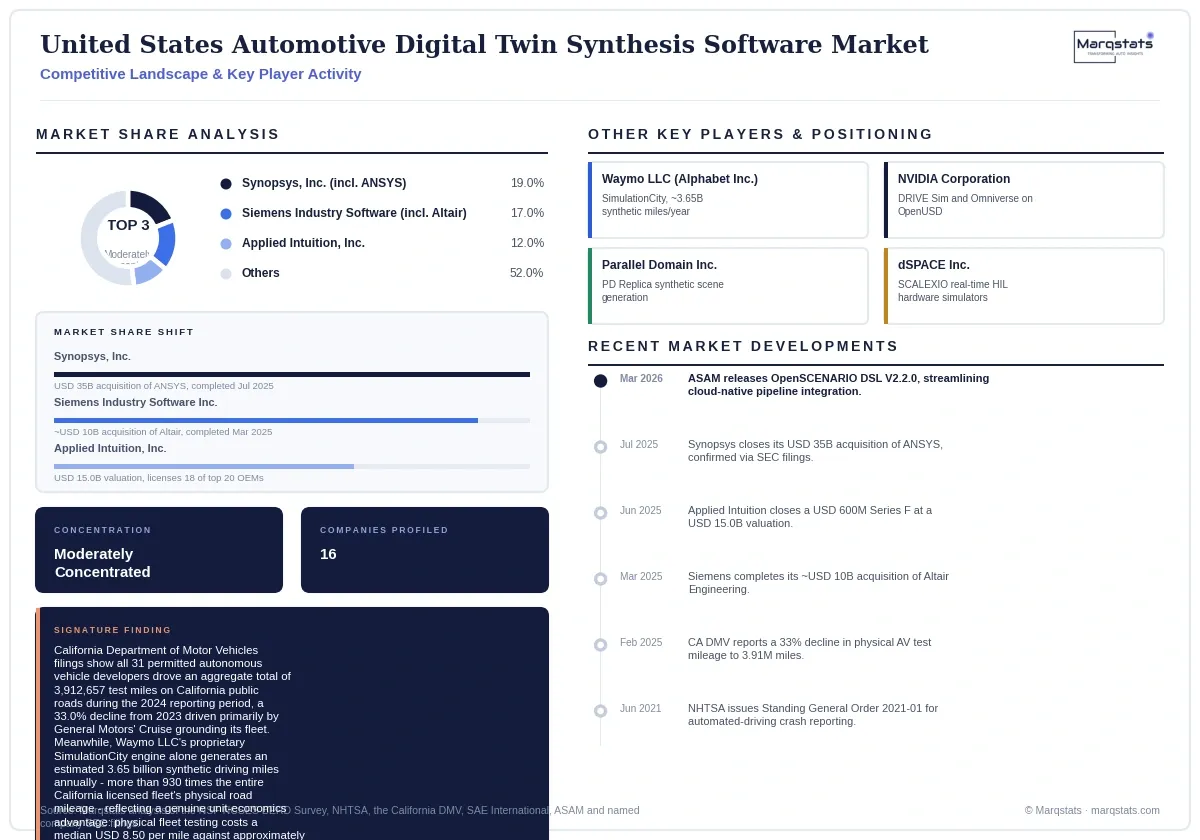
The US automotive digital twin synthesis software market is undergoing structural consolidation as major electronic design automation and product lifecycle management conglomerates acquire independent simulation providers: Synopsys, Inc., Siemens AG (now incorporating Altair Engineering), and Dassault Systèmes SE together anchor a substantial share of enterprise engineering software revenue, while specialized venture-backed platforms including Applied Intuition and Parallel Domain hold strong defensible positions in generative neural sensor synthesis and automated scenario validation.
Firms compete differently by tier: multi-domain conglomerates compete on delivering unified silicon-to-system toolchains linking semiconductor electronic design automation directly to full-vehicle multiphysics, exemplified by the newly combined Synopsys-Ansys and Siemens-Altair portfolios, while pure-play autonomous vehicle simulation vendors including Applied Intuition compete on generative physical AI capability, licensing validation toolchains to 18 of the world's top 20 automotive OEMs including General Motors, Ford and Toyota.
The most significant recent competitive-landscape development is the completion of two landmark megadeals directly mirroring global industry consolidation: Synopsys' USD 35 billion acquisition of ANSYS, completed 17 July 2025, and Siemens' approximately USD 10 billion acquisition of Altair Engineering, completed 26 March 2025, both independently verified transactions that establish integrated silicon-to-vehicle simulation stacks now central to US automotive engineering toolchains.
Companies Covered
The report profiles 16+ companies with full strategy and financials analysis, including:
Recent Market Activity
Table of Contents
Coverage & Segmentation
Coverage spans the United States automotive digital twin synthesis software market, encompassing high-fidelity multi-body physics solvers, phenomenological and neural sensor simulation pipelines, and stochastic scenario engines that synthesize automotive hardware, sensor environments and vehicle operational design domains. The market is sized in USD across a 2020-2024 historical period and a 2025-2030 forecast period, with 2024 as the base year. Three segmentation dimensions are quantified: functional application, deployment architecture, and end-user profile.
Excluded from scope: classical static CAD authoring environments, legacy revision-based PLM systems of record, and finite-element meshing utilities lacking closed-loop dynamic determinism. Physical prototype testing infrastructure, safety driver salaries, and depot logistics costs are addressed only as comparative context for simulation unit economics. A separate Marqstats study addresses the global automotive digital twin synthesis software market on a comparable basis.