Market Snapshot
Key Takeaways
Market Overview & Analysis
Report Summary
South Africa is electrifying through hybrids rather than around them, and the shape of that transition changed decisively in 2026. Until 2024 the category was effectively one technology and largely one nameplate. By mid-2026 it was three technologies moving at different speeds, with the plug-in hybrid the fastest and the conventional hybrid the one under pressure from both directions at once.
The market is measured here as annual new passenger-vehicle registrations of conventional hybrid and plug-in hybrid vehicles. Battery electric vehicles are excluded from the point estimate and used throughout as the comparison that defines the category's ceiling, and range-extended vehicles are treated separately because their registration classification is not yet consistent.
The analysis is written for manufacturers choosing powertrain allocation by price segment, importers assessing nameplate timing, charging network operators sizing plug-in hybrid demand they may be under-counting, and investors screening the service, parts and battery capability that an electrified parc requires. It refuses to treat hybrid and plug-in hybrid as one pool, because the two series have moved in opposite directions for eighteen months.
South Africa Hybrid and Plug-in Hybrid Vehicle Market Size and Forecast
Combined hybrid and plug-in hybrid volumes are estimated at 15,628 units in 2025, comprising 12,818 conventional and 2,810 plug-in units, rising to 24,500 in 2026 and 63,000 by 2031. The 2026 estimate reflects launch momentum without mechanically doubling a first-half figure: the first six months delivered approximately 11,290 combined units and the seven months to July delivered 13,929.
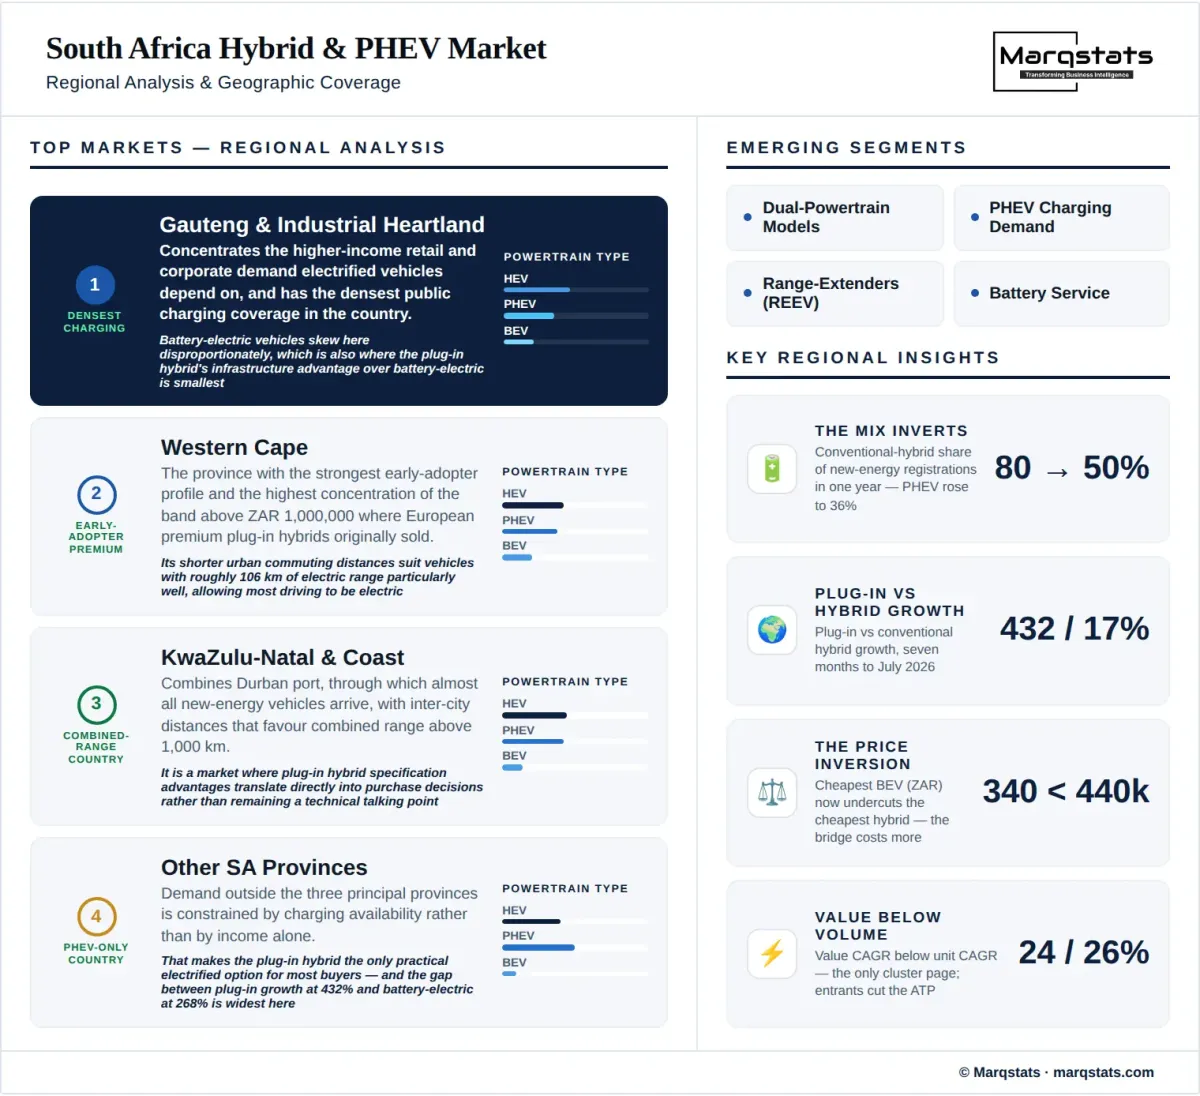
Two growth rates apply and both are published. The six-year rate connecting 2025 and 2031 is 26.16%. The five-year rate connecting 2026 and 2031 is 20.79%, and the 5.37-point gap exists because 2026 is a launch year rather than a trend year, with plug-in hybrid volumes rising 432% on a base of 1,100 units in the comparable 2025 period.
The 2031 forecast assumes plug-in hybrid growth stays ahead of conventional hybrid growth for several years, then moderates as battery electric availability and charging coverage improve. Reaching 63,000 units requires combined penetration to rise from roughly 2.62% of a 596,818-unit market toward the high single digits, which is a penetration forecast rather than a market-growth forecast and should be read as such.
Market value grows more slowly than unit volume, which is the reverse of every other page in this cluster. On a weighted average transaction price falling from approximately ZAR 620,000 in 2025 toward ZAR 560,000 by 2031, and holding the conversion constant at ZAR 18.30 per USD, market value moves from roughly USD 529 million to USD 1,928 million at 24.03% a year against 26.16% for volume.
That inversion is the forecast's most important assumption and it is deliberate. Electrified vehicles in South Africa have been premium products sold to buyers who could absorb a technology premium; the entrants arriving now are pricing beneath the incumbent nameplates rather than above them, and a value series rising faster than volume would imply the opposite transition.
The Mix Shift Inside New Energy Vehicles
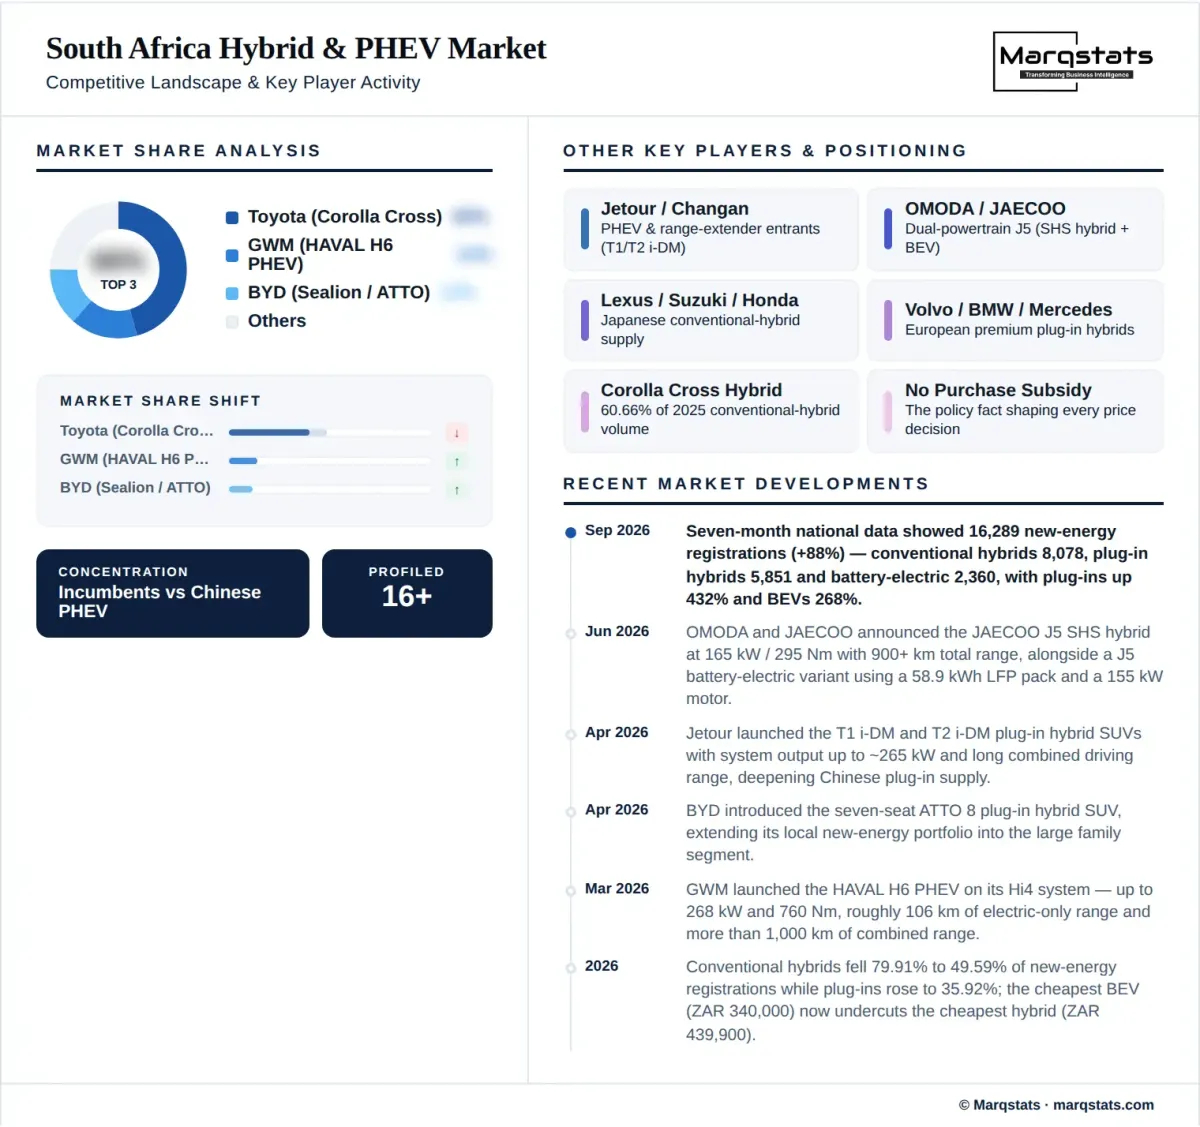
Through the first seven months of 2026 South Africa registered 16,289 new energy vehicles against 8,665 in the same period of 2025, an increase of 88%. The composition changed far more than the total. Conventional hybrids moved from 6,924 to 8,078 units, plug-in hybrids from 1,100 to 5,851 and battery electric vehicles from 641 to 2,360.
Expressed as shares, conventional hybrids fell from 79.91% of new energy registrations to 49.59%, plug-in hybrids rose from 12.69% to 35.92% and battery electric vehicles from 7.40% to 14.49%. A category that was four-fifths one technology a year ago is now split roughly one half, one third and one seventh.
The growth rates underneath tell the same story more sharply. Plug-in hybrids grew 432% and battery electric vehicles 268%, against 16.7% for conventional hybrids. Any forecast built on the aggregate new energy figure would be describing a market in which the largest component is growing at a tenth of the rate of the second largest.
The quarterly series shows how recent this is. First-quarter plug-in hybrid volumes ran 13 units in 2021, 36 in 2022, 25 in 2023, 141 in 2024 and 241 in 2025 before reaching 1,277 in 2026. There is no gradual ramp in that series; there is five years of nothing followed by one year of product arriving.
The Conventional Hybrid Stall and Its Reversal
Conventional hybrid sales in South Africa grew from 896 units in 2021 to 4,694 in 2022, 6,487 in 2023 and 13,616 in 2024, then fell to 12,818 in 2025, a decline of 5.86% and the first in the series. First-quarter 2026 extended the fall, at 2,764 units against 2,970 a year earlier, down 6.94%.
The reversal came quickly. Conventional hybrids reached 8,078 units in the seven months to July 2026, which means 5,314 units were added between April and July against 2,764 in the first quarter, lifting the monthly run rate from roughly 921 to about 1,328. The recovery is driven by nameplate arrivals rather than by a change in underlying demand.
Both readings are true and they answer different questions. A strategist assessing whether conventional hybrids remain a growth technology should weigh the 2024 to 2025 decline and the first-quarter fall. A planner assessing 2026 volumes should weigh the April to July recovery. A page publishing only one of them would mislead in one direction or the other.
The underlying pressure is structural rather than cyclical. Entry-level hybrid pricing has risen while the technology matured, with the Toyota Corolla Cross Hybrid now at ZAR 501,100 against a ZAR 413,000 launch price in 2021, an increase of 21%, and petrol-only alternatives delivering comparable consumption below ZAR 250,000. A closed-loop hybrid competes on fuel saving alone, and that argument weakens as the price gap widens.
Why Plug-in Hybrids Solve a South African Problem
Plug-in hybrids answer a specific national constraint rather than a general preference. Public charging coverage is uneven across a country with long inter-city distances, and a vehicle offering meaningful electric running with full liquid-fuel range removes the planning problem a battery electric vehicle imposes without removing the electric benefit.
The product specifications now on sale make that concrete. GWM launched the HAVAL H6 PHEV in March 2026 using its Hi4 system, with the top version producing up to 268 kW and 760 Nm, roughly 106 km of electric-only range and more than 1,000 km of combined range. A vehicle with 106 km of electric range covers most daily use electrically and every long trip conventionally.
That is why plug-in hybrid growth at 432% is running ahead of battery electric growth at 268% from a similar base year, despite battery electric vehicles being cheaper at the entry point. The constraint being solved is infrastructure, not purchase price, and until charging coverage changes the plug-in hybrid will keep winning the buyer who wants electric running without the route planning.
The Price Inversion at the Entry Point
South Africa's electrified price ladder no longer runs in the order the technology logic assumes. The cheapest battery electric vehicles, including the Geely E2 and BYD Dolphin Surf, sit at approximately ZAR 340,000. The cheapest conventional hybrid, the Chery Tiggo Cross 1.5 CHS, is ZAR 439,900. The most affordable plug-in hybrid, the BYD Sealion 5, is ZAR 509,900, and the Toyota Corolla Cross Hybrid is ZAR 501,100.
A bridge technology priced above the technology it is bridging to has a narrower reason to exist. The conventional hybrid's remaining argument at the entry point is not cost and not electric capability; it is range and refuelling convenience, and that is exactly the argument the plug-in hybrid makes better for roughly ZAR 70,000 more.
The inversion is why the value series falls behind the volume series. Chinese entrants are pricing electrified product beneath established nameplates rather than above them, which pulls the weighted average transaction price from approximately ZAR 620,000 toward ZAR 560,000 across the forecast even as the mix shifts toward technically more complex powertrains.
Chinese Product Expansion and the Nameplate Race
Chinese groups supply most of the new electrified nameplates entering the market. Jetour launched the T1 i-DM and T2 i-DM plug-in hybrid sport utility vehicles in April 2026 with system output up to approximately 265 kW, and BYD introduced the seven-seat ATTO 8 plug-in hybrid in the same month, extending electrification into the large family segment.
OMODA and JAECOO announced the JAECOO J5 SHS hybrid and J5 battery electric variants in June 2026, the hybrid producing 165 kW and 295 Nm with more than 900 km of total range and the battery electric version using a 58.9 kWh lithium iron phosphate pack and a 155 kW motor. Offering both powertrains on one nameplate is itself a statement about how uncertain the transition path is.
The incumbent position remains concentrated. Toyota anchors conventional hybrid supply, with the Corolla Cross hybrid alone accounting for 7,775 of 12,818 conventional hybrid units in 2025, or 60.66%, and the RAV4 hybrid adding 906. A category in which one nameplate is three fifths of the largest technology pool is exposed to that nameplate's product cycle in a way the headline figures do not show.
The competitive battleground has moved accordingly. Combined range, battery capacity, direct-current charging capability, price and warranty now decide outcomes rather than fuel consumption alone, and that is a specification contest the newer entrants are better equipped to fight than the incumbents whose advantage was reliability and residual value.
Policy and What South Africa Does Not Offer
South Africa provides no broad consumer purchase subsidy comparable with several European markets, so adoption depends on vehicle pricing, finance terms, fuel savings and model availability rather than on incentive design. That absence is the single most important policy fact about this market and it explains why the price inversion at the entry point matters so much.
The support that does exist is aimed at production rather than purchase. From 1 March 2026, Section 12V provides a 150% first-year deduction for qualifying investment used mainly to produce battery-electric or hydrogen-powered vehicles locally, which excludes hybrid and plug-in hybrid manufacture from its direct benefit while signalling the longer-term direction.
The 2023 Electric Vehicle White Paper targets a dual internal combustion and new energy production platform by 2035, strengthening the case for local electrified drivetrain and component capability. For now, hybrids and plug-in hybrids function as demand-side bridge technologies inside a policy framework built around supply-side transformation, and the mismatch is worth stating plainly rather than glossing.
Charging Demand That Plug-in Hybrids Create
Charging network operators should not assume plug-in hybrids generate no infrastructure demand. A vehicle with roughly 106 km of electric range, like the HAVAL H6 PHEV, is charged far more often than a battery electric vehicle with three times the capacity, because the owner is recovering a smaller battery repeatedly rather than a larger one occasionally.
At 5,851 plug-in hybrid units in seven months against 2,360 battery electric, the plug-in fleet is being added roughly two and a half times faster than the battery electric fleet. Larger-battery plug-in hybrids increasingly support alternating and direct-current charging, and their contribution to home, workplace and retail site utilisation is material rather than incidental.
The planning implication is that the addressable charging population in South Africa is roughly the sum of both series rather than the battery electric series alone. An operator sizing capacity against 2,360 vehicles is sizing against 29% of the vehicles that will plug in.
Market Dynamics
Key Drivers
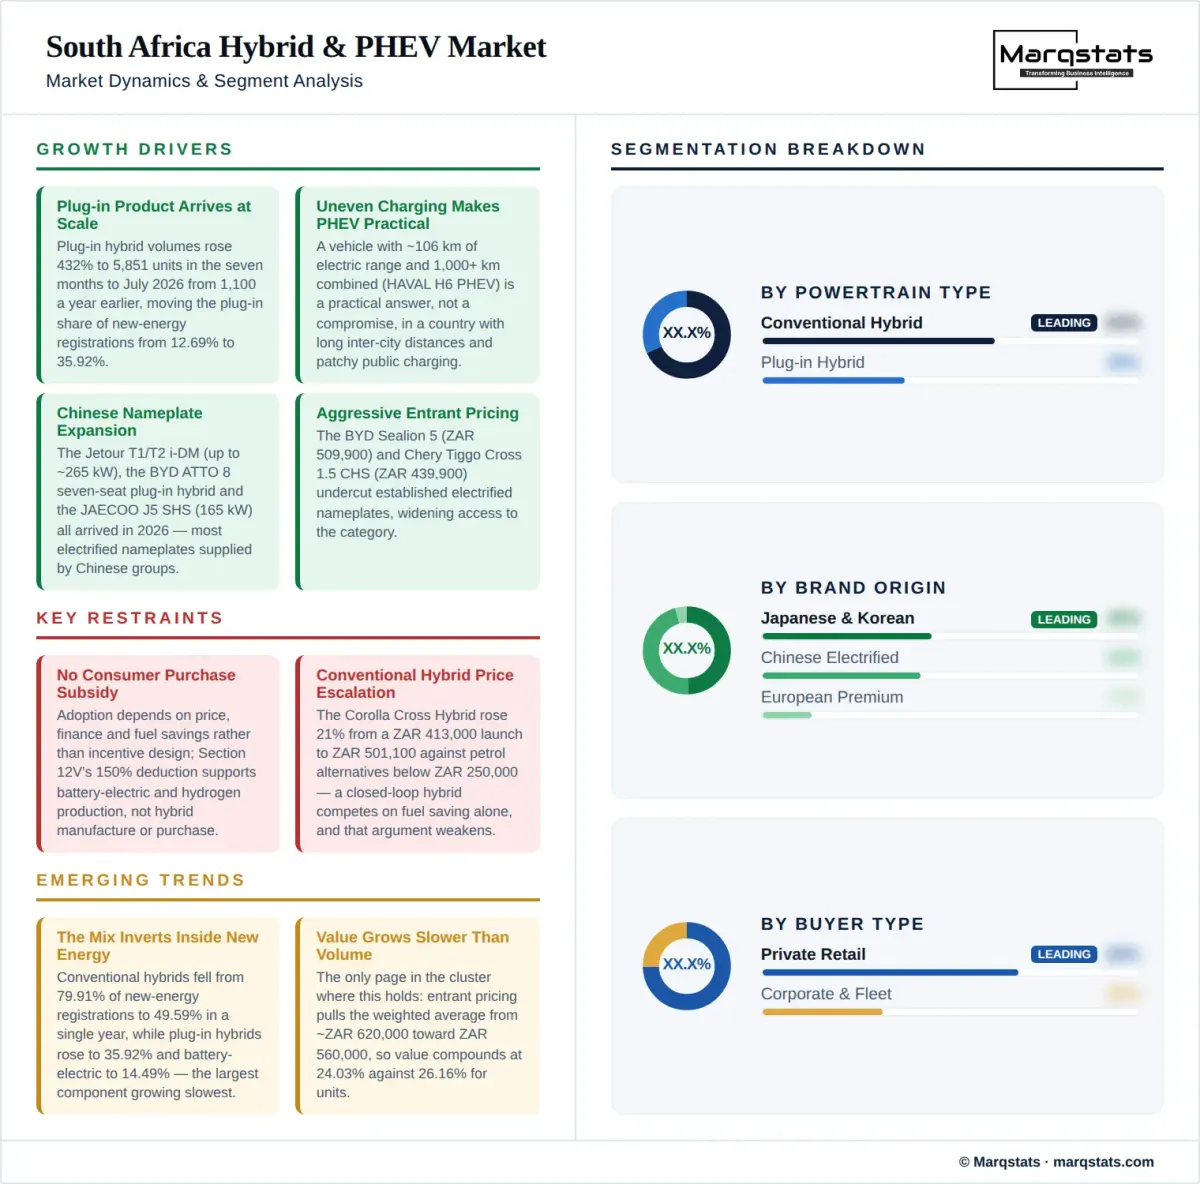
- Plug-in hybrid product arrival at scale, with volumes up 432% to 5,851 units in the seven months to July 2026 from 1,100 a year earlier.
- Uneven public charging coverage, which makes a vehicle with roughly 106 km of electric range and more than 1,000 km of combined range a practical answer rather than a compromise.
- Chinese nameplate expansion, with the Jetour T1 and T2 i-DM at up to approximately 265 kW, the BYD ATTO 8 seven-seat plug-in hybrid and the JAECOO J5 SHS at 165 kW all arriving in 2026.
- Aggressive entrant pricing, with the BYD Sealion 5 at ZAR 509,900 and the Chery Tiggo Cross 1.5 CHS at ZAR 439,900 undercutting established electrified nameplates.
- A low starting base, with new energy vehicles at roughly 2.62% of the 596,818-unit 2025 national market, leaving penetration headroom that mature markets no longer have.
Key Restraints
- No broad consumer purchase subsidy, which leaves adoption dependent on price, finance and fuel savings rather than on incentive design.
- Conventional hybrid price escalation, with the Toyota Corolla Cross Hybrid up 21% from ZAR 413,000 at launch in 2021 to ZAR 501,100 against petrol alternatives below ZAR 250,000.
- Exchange-rate and imported-vehicle pricing exposure, since almost all electrified product is imported and Section 12V's 150% deduction supports battery-electric and hydrogen production rather than hybrid manufacture.
- Nameplate concentration, with the Corolla Cross hybrid accounting for 7,775 of 12,818 conventional hybrid units in 2025, or 60.66%.
Key Trends
- The mix inverting inside new energy vehicles, with conventional hybrids falling from 79.91% of registrations to 49.59% in a single year.
- Value growing more slowly than volume at 24.03% against 26.16% as entrant pricing pulls the weighted average transaction price down.
- Dual-powertrain nameplates, with the JAECOO J5 offered as both a 165 kW hybrid and a 58.9 kWh battery electric variant announced together in June 2026.
- Specification competition replacing efficiency competition, with combined range beyond 1,000 km, 268 kW outputs and charging capability displacing fuel consumption as the decisive attributes.
Market Segmentation
The largest pool at 8,078 units in the seven months to July 2026 but the slowest growing at 16.7%, and the only one to have recorded an annual decline, falling from 13,616 units in 2024 to 12,818 in 2025. Its share of new energy registrations fell from 79.91% to 49.59% in a single year.
Plug-in hybrids with moderate electric range serve buyers who charge at home and drive predictable daily distances, and they anchor the accessible end of the plug-in ladder at prices such as the BYD Sealion 5 at ZAR 509,900. The combined plug-in pool reached 5,851 units in seven months against 1,100 a year earlier.
The fastest-developing sub-pool, defined by electric-only range near or above 100 km, exemplified by the HAVAL H6 PHEV at roughly 106 km electric and more than 1,000 km combined with up to 268 kW and 760 Nm. These vehicles compete with battery electric vehicles on electric capability while removing the route-planning constraint entirely.
The established position, anchored by Toyota, whose Corolla Cross hybrid accounted for 7,775 of 12,818 conventional hybrid units in 2025 and whose RAV4 hybrid added 906. This group owns the conventional hybrid pool and has the least exposure to the plug-in hybrid surge, which is both its current strength and its principal risk.
The source of most new nameplates and most of the plug-in hybrid growth that took the segment from 1,100 to 5,851 units in a year, spanning GWM and Haval, BYD, Jetour, OMODA and JAECOO, Chery and Changan. They compete on combined range, output and price rather than on established residual values.
The original plug-in hybrid suppliers in South Africa, selling into the band above ZAR 1,000,000 where the technology premium was absorbable before volume entrants arrived. Their share of a plug-in pool that reached 5,851 units in seven months is falling even as their absolute volumes hold, because the growth is arriving beneath them.
The dominant electrified body type and the reason the category grew, matching national buyer preference precisely. The Corolla Cross hybrid at 7,775 units in 2025 and the Chery Tiggo Cross 1.5 CHS at ZAR 439,900 both sit here, as do the HAVAL H6 PHEV and the JAECOO J5 SHS at 165 kW.
The newest electrified body type in the market, opened by the BYD ATTO 8 seven-seat plug-in hybrid introduced in April 2026 and the Jetour T2 i-DM with system output up to approximately 265 kW. It carries higher transaction prices and is where plug-in hybrid architecture is most defensible, because battery electric alternatives at this size remain scarce and expensive.
A smaller share of electrified volume than of the national passenger market, where petrol alternatives below ZAR 250,000 compete directly on running cost. The cheapest battery electric vehicles at approximately ZAR 340,000 occupy much of this space, which further limits the conventional hybrid case in smaller body styles.
The band where the price inversion is visible and where conventional hybrids are weakest, containing the Chery Tiggo Cross 1.5 CHS at ZAR 439,900 alongside battery electric vehicles at approximately ZAR 340,000. A buyer here can reach full electric operation for roughly ZAR 100,000 less than the cheapest hybrid.
The volume battleground, holding the Toyota Corolla Cross Hybrid at ZAR 501,100 and the BYD Sealion 5 at ZAR 509,900 within ZAR 8,800 of each other despite offering different technologies. This band will decide whether conventional hybrids retain relevance, because it is where the two products meet on price.
Where long-range plug-in hybrids and larger electrified sport utility vehicles sit, including the higher HAVAL H6 PHEV derivatives at up to 268 kW and 760 Nm and the seven-seat entries introduced in 2026. Buyers here are trading up from mainstream internal combustion rather than down from premium marques.
The original electrified band in South Africa and now the slowest growing in relative terms, as plug-in hybrid volumes of 5,851 units in seven months accumulate almost entirely beneath it. It remains the profit pool for European premium brands but no longer defines the category's direction.
The majority of electrified volume and the buyer most exposed to the absence of a purchase subsidy, making the ZAR 439,900 to ZAR 509,900 entry ladder the decisive variable. Fuel saving alone is a weak argument against petrol alternatives below ZAR 250,000, which is why electric capability rather than efficiency now drives the purchase.
A growing but underpenetrated channel, where total cost of ownership and residual values matter more than list price and where the conventional hybrid's established reliability record still carries weight. Fleet adoption lags retail because electrified residual values in a market with 2.62% new energy penetration remain thinly evidenced.
The smallest channel and the most sensitive to charging access, which is why plug-in hybrids at 5,851 units in seven months suit it better than battery electric vehicles at 2,360. An operator returning vehicles to depots without charging infrastructure can run a plug-in hybrid fleet immediately and a battery electric fleet only after capital investment.
By Geography
Gauteng and the Industrial Heartland
Gauteng concentrates the higher-income retail and corporate demand that electrified vehicles depend on, and it has the densest public charging coverage in the country, which is why battery electric vehicles at 2,360 units nationally are disproportionately registered here. It is also where the plug-in hybrid's infrastructure advantage is smallest.
Western Cape
The province with the strongest early-adopter profile and the highest concentration of the band above ZAR 1,000,000 where European premium plug-in hybrids originally sold. Its shorter urban commuting distances suit vehicles with roughly 106 km of electric range particularly well, allowing most driving to be electric.
KwaZulu-Natal and the Coastal Corridor
KwaZulu-Natal combines Durban port, through which almost all of the 16,289 new energy vehicles registered in the seven months to July 2026 arrived, with inter-city distances that favour combined range above 1,000 km. It is a market where plug-in hybrid specification advantages translate directly into purchase decisions.
Other South African Provinces
Demand outside the three principal provinces is constrained by charging availability rather than by income alone, which makes the plug-in hybrid the only practical electrified option for most buyers. The gap between plug-in hybrid growth at 432% and battery electric growth at 268% is widest here.
How Competition Is Evolving
The electrified field in South Africa has two distinct competitive structures stacked on top of each other. The conventional hybrid pool is concentrated and incumbent-led, with Toyota's Corolla Cross hybrid alone at 7,775 of 12,818 units in 2025. The plug-in hybrid pool is fragmented and entrant-led, having grown from 1,100 to 5,851 units in seven months across nameplates that mostly did not exist locally a year ago.
Toyota's position is strong and narrowly based. It anchors the largest technology pool through a nameplate accounting for 60.66% of that pool, which is an enviable share and a concentrated exposure, particularly as the pool itself fell from 13,616 units in 2024 to 12,818 in 2025 before recovering in mid-2026.
Chinese groups are competing on specification rather than on heritage. GWM's HAVAL H6 PHEV at up to 268 kW and 760 Nm with roughly 106 km electric range, Jetour's T1 and T2 i-DM at up to approximately 265 kW, BYD's seven-seat ATTO 8 and the JAECOO J5 SHS at 165 kW with more than 900 km total range all arrived within four months of each other.
The decisive competitive variable has changed from efficiency to capability. When hybrids competed on fuel consumption, the incumbent with the proven system won. When electrified vehicles compete on combined range, electric-only range, output, charging capability, price and warranty, the entrant with the newest architecture has the advantage, and the specification gap is currently wide.
For a manufacturer, the strategic question is allocation rather than technology. The same buyer at ZAR 500,000 can now be offered a conventional hybrid at ZAR 501,100, a plug-in hybrid at ZAR 509,900 or a battery electric vehicle at approximately ZAR 340,000, and the right answer differs by body type, province and charging access rather than by a single national view.
Companies Covered
The report profiles 15+ companies with full strategy and financials analysis, including:
Recent Market Activity
Table of Contents
Coverage & Segmentation
This study measures annual new passenger-vehicle registrations of conventional hybrid electric and plug-in hybrid electric vehicles in South Africa from 2021 to 2031, with 2025 as the base year and 2026 to 2031 as the forecast period. Battery electric vehicles are excluded from the point estimate and carried throughout as the comparison that bounds the category, and range-extended vehicles are excluded because registration classification is not yet consistent across sources.
Coverage spans three powertrain types, three brand-origin groups, three body types, four price bands and three buyer channels, alongside four provincial clusters analysed on demand composition and charging access rather than quantified share, which is not published. Market value is carried as a reference series in USD at a constant ZAR 18.30 conversion so that the value-versus-volume relationship measures mix rather than exchange-rate movement. Fifteen manufacturer entities are profiled.