Market Snapshot
Key Takeaways
Market Overview & Analysis
Report Summary
Italy's plug-in hybrid market spent several years being read as a fiscal artifact, and 2026 is the year that reading stopped holding. Registrations contracted 25.0% in 2024 to 52,720 units, rebounded 92.5% in 2025 to approximately 101,500 units, and then grew a further 85.1% across the first half of 2026. A single tax change explains the first rebound. It does not explain the second year, and it does not explain a channel mix that is broadening while volume rises.
The measure covers plug-in hybrid electric vehicles registered in Italy as M1-category passenger cars under the Codice della Strada and standard EU type-approval, combining an externally rechargeable battery with an internal combustion engine. Battery electric vehicles, non-plug-in hybrids including closed-loop systems, 48-volt mild hybrids and N1-category light commercial vehicles are excluded. Registration volume is the statutory UNRAE series; value is registrations multiplied by average transaction price, which ran from EUR 49,200 in 2023 to EUR 48,571 in 2025.
The analysis is written for manufacturers deciding what battery capacity a model needs to remain fiscally eligible after 2027, fleet and leasing operators whose channel share is falling even as their volume grows, component suppliers sizing content per vehicle against a rising unit base and a falling transaction price, and charge point operators sizing a residential product against a parc above 430,000 vehicles and climbing.
Italy PHEV Market Size and Forecast
The market is estimated at USD 5,694.15 million in 2025, USD 8,710.88 million in 2026 and USD 11,036.02 million by 2030, an increase of USD 5,341.87 million across the window. Registrations move from 101,500 to an estimated 157,780 in 2026 and 210,000 by 2030 at 15.65%, an increase of 108,500 units, while average transaction price eases from EUR 48,571 to an estimated EUR 45,500. In euro terms the market moves from EUR 4.93 billion to an estimated EUR 9.56 billion at a disclosed constant USD 1.1550 per EUR.
Value compounds 1.50 points slower than volume at 14.15% against 15.65%, and the mechanism is transaction price rather than mix. Chinese entry pricing is the active force: brands from that group grew 92.1% across the first eight months of 2026 to a 15% share of the total Italian car market, and one plug-in nameplate entering near EUR 38,900 fully optioned against a market average near EUR 48,571 pulls the blended figure down while unit volume rises.
The growth is front-loaded and then moderates, which is what the part-year data supports rather than a smooth curve. Registrations rise an estimated 55.45% in 2026 on the strength of a first half already recorded at 85.1%, then compound at an estimated 7.41% a year from 2026 to 2030 as the share gain slows and the base enlarges. A forecast that spread 15.65% evenly across five years would understate 2026 and overstate 2029.
Share rather than market size carries most of the growth. The national car market is forecast at 1.61 million units in 2026, up 5.5%, against roughly 1.53 million in 2025, and reaches an estimated 1.75 million by 2030. Plug-in hybrid share moves from 6.60% to an estimated 9.80% and then 12.00% across the same period, so roughly four fifths of the volume gain comes from share and one fifth from the market growing underneath it.
The Regulatory Test Has Already Been Run
Euro 6e-bis became mandatory for all plug-in hybrid types, not only for new type-approvals, from January 2026. It extends the simulated test distance from 800 km to 2,200 km and re-weights the Utility Factor toward observed fleet behaviour, moving certified ratings on existing platforms from 32 to 48 g/km up to 68 to 95 g/km and crossing the 60 g/km Ecobonus ceiling. Euro 6e-bis-FCM follows in 2027.
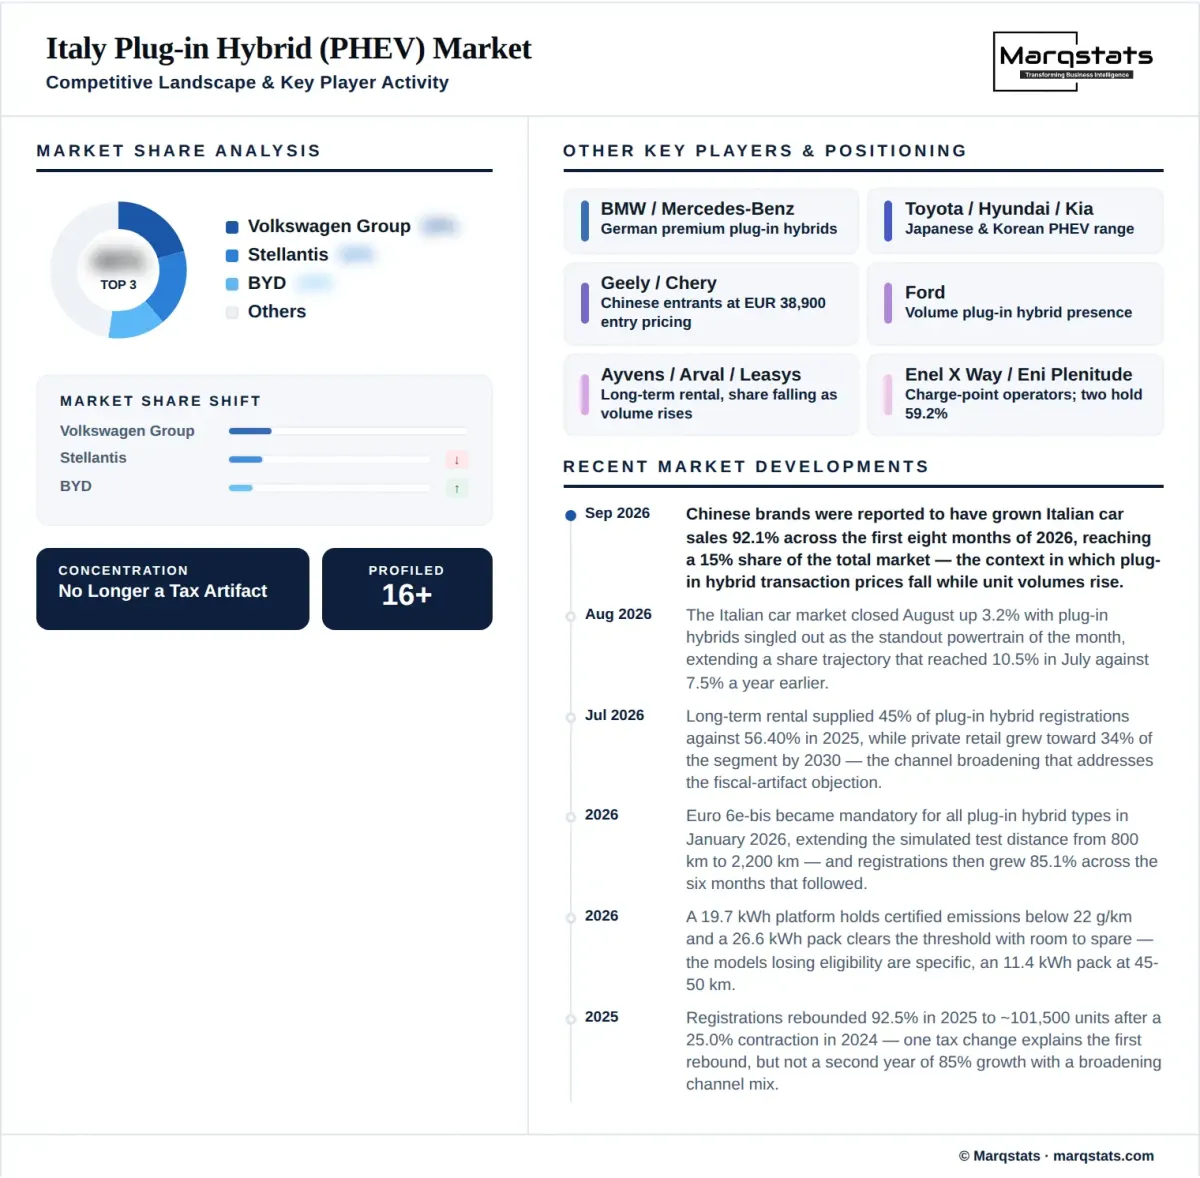
Registrations then grew 85.1% in the six months that followed, and share rose in each reported period, reaching 10.5% in July against 7.5% in July 2025. The revision took effect and the segment accelerated. That is close to a controlled test of the compliance-cliff thesis, and the result is that the cliff reprices older platforms rather than removing demand for the powertrain.
The distinction matters for what a manufacturer does next. A demand event would argue for exiting the segment. A repricing event argues for refreshing into it, which is what the capacity data shows is happening: a 19.7 kWh platform already holds certified emissions below 22 g/km and a 26.6 kWh pack clears the threshold with more room still. The models that lose eligibility are specific and identifiable rather than general, and an 11.4 kWh pack yielding 45 to 50 km is the profile at risk.
Why the Channel Mix Broadening Matters More Than the Volume
Long-term rental supplied an estimated 57,246 units and 56.40% of plug-in hybrid registrations in 2025. In July 2026 it supplied 45% of them, while the segment itself grew 85.1% across the half year. A channel whose share falls while its own volume rises is not weakening; it is being joined.
That is the single most important structural change on this page, because it addresses the objection the segment has carried since 2025. A market created by one article of tax law can be unwound by another, and a market where 56.40% of volume runs through a handful of leasing operators is exposed to exactly that. A market broadening into private and corporate retail is materially less so, and the 2026 series is the first evidence that the broadening is real rather than anticipated.
The forecast carries that shift forward. Long-term rental grows at an estimated 7.97% to 84,000 units by 2030 but falls to 40.00% of the segment, while private retail grows at an estimated 24.41% to 71,400 units and 34.00%. Retail remains the channel with the weakest running-cost case, because public alternating-current tariffs of EUR 0.60 to EUR 0.85 per kWh erode the advantage for any buyer without a home wallbox, which is why the growth there is a genuine signal rather than an assumption.
Why the Runway Is Longer in Italy Than Further North
Italy's public charging network carries 14.2 points per 100 km of road network against an EU average of 20.9, ranking the country 16th among member states, with 58% of points in the north and roughly 20% serving the south and the islands. The infrastructure gap that holds back battery electric adoption is the same gap that extends the plug-in hybrid runway, and it is wider here than in the northern European markets where the powertrain is already being written off.
The fiscal framework points the same way. The January 2025 Budget Law set company-car fringe-benefit taxation at 10% of ACI conventional operating cost for battery electric vehicles, 20% for plug-in hybrids and 50% for combustion and non-plug-in hybrid vehicles, worth EUR 900 to EUR 1,000 a year per corporate driver against a diesel assignment. The plug-in hybrid is the middle term, and a middle term survives as long as the two ends remain far apart.
Total ownership cost supports it independently of tax. A three-year, 60,000 km comparison runs EUR 23,800 against EUR 25,080 for an equivalent diesel, on a EUR 1,700 fuel saving from overnight home charging and a EUR 780 road-tax exemption, despite a purchase price EUR 3,000 higher after subsidies. Regional exemptions layer on top, with Lombardy and Piedmont offering 3 to 5 years of full exemption followed by a permanent 50% to 75% reduction.
Market Dynamics
Key Drivers
Five forces carry the forecast, and the first two are recorded in the 2026 series rather than projected into it.
- Registrations grew 85.1% year on year across the first half of 2026 to a 9.0% share, reaching 9.2% across seven months and 10.5% in July against 7.5% a year earlier, on a total market up 8.9%.
- The channel mix broadened as long-term rental fell from 56.40% of registrations in 2025 to 45% in July 2026 while segment volume rose, indicating demand arriving from private and corporate retail.
- The January 2025 Article 51 framework holds company-car taxation at 20% of ACI conventional operating cost against 50% for combustion vehicles, worth EUR 900 to EUR 1,000 a year per corporate driver.
- Chinese entry pricing expanded the market downward, with those brands growing 92.1% across the first eight months of 2026 to a 15% share of the total car market and one plug-in nameplate entering near EUR 38,900.
- Charging density of 14.2 points per 100 km against an EU average of 20.9, with roughly 20% of points serving the south and the islands, keeps the plug-in hybrid the practical choice across most of the country.
Key Restraints
Four constraints work against the forecast, and the first reprices part of the range rather than removing demand.
- Euro 6e-bis moves certified ratings on existing platforms from 32 to 48 g/km up to 68 to 95 g/km, crossing the 60 g/km Ecobonus ceiling, with Euro 6e-bis-FCM extending the reset into 2027.
- Public alternating-current tariffs of EUR 0.60 to EUR 0.85 per kWh erode the running-cost case for buyers without home charging, in a market where two operators hold 59.2% of public points.
- Real-world corporate fleet consumption runs 3.5 times certified figures, at 5.8 to 7.2 L per 100 km against 1.2 to 1.8 L, which keeps regulatory attention on the powertrain's certified ratings.
- Battery electric incentives and sub-EUR 25,000 models arriving through the forecast window compete for the same fiscal headroom, with battery electric share already at 8.1% across the first seven months of 2026.
Key Trends
Four movements reshape the segment inside the forecast window, and three follow from the fourth.
- The battery capacity floor is rising, with packs above 20 kWh growing at 39.70% to an estimated 72.00% of registrations by 2030 as manufacturers refresh into rather than out of the segment.
- Chinese manufacturers are converting price into share across the whole market, at 92.1% growth and a 15% total share across the first eight months of 2026, which pulls plug-in hybrid transaction prices down as unit volume rises.
- Body-type breadth is increasing at the bottom, with sub-compact plug-in hybrids growing at an estimated 55.36% from under 1% of registrations as entry pricing makes the packaging viable.
- Home-wallbox reimbursement and smart-charging platforms are moving from fleet convenience to compliance requirement as Corporate Sustainability Reporting Directive exposure turns unmanaged charge-sustaining operation into a disclosed risk.
Market Segmentation
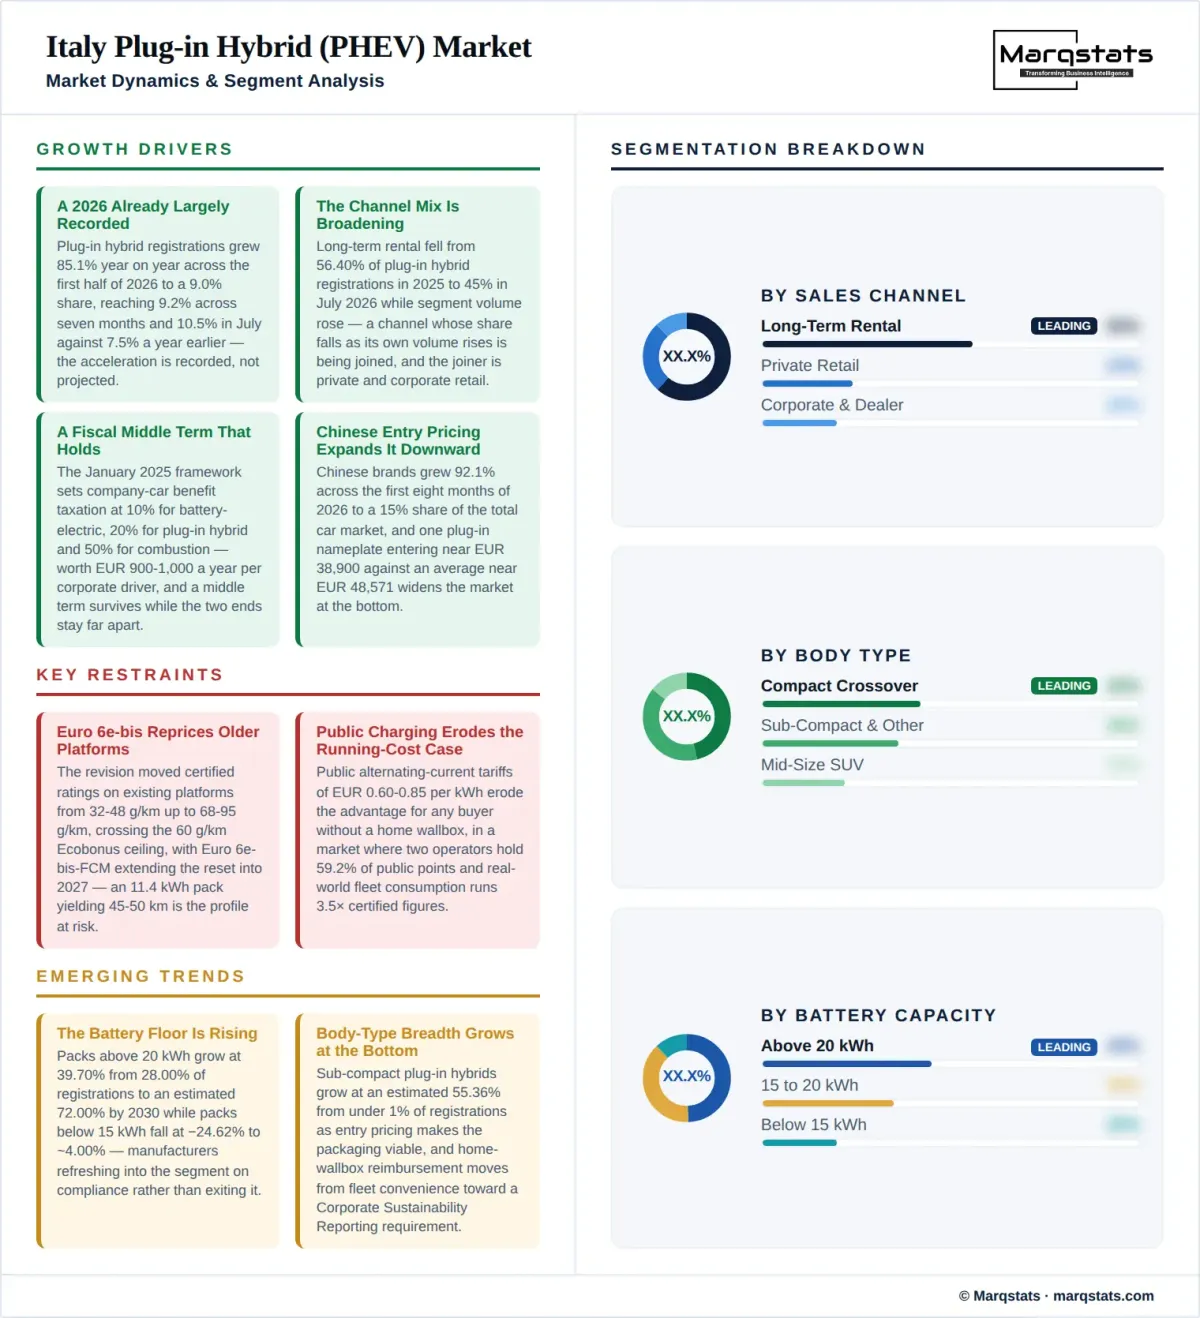
Long-term rental led 2025 at an estimated 57,246 units and 56.40% of registrations, growing to an estimated 84,000 units by 2030 at 7.97% but falling to 40.00% of the segment. The channel supplied 45% of July 2026 registrations, down from 56.40% across 2025, while its own volume rose, which is the clearest single indicator that the segment is broadening beyond its fiscal trigger.
Private retail accounted for an estimated 23,954 units and 23.60% of 2025 registrations, reaching an estimated 71,400 units and 34.00% by 2030 at 24.41%, the second-fastest channel. Growth here carries more weight than its rate suggests, because public tariffs of EUR 0.60 to EUR 0.85 per kWh mean these buyers are choosing the powertrain without the strongest running-cost case.
Corporate direct purchase accounted for an estimated 11,977 units and 11.80% of 2025 registrations, reaching an estimated 29,400 units and 14.00% by 2030 at 19.67%. Outright ownership suits executive transport where depreciation amortisation outweighs the balance-sheet advantage of leasing, and the channel gains share as retail demand broadens.
Dealer self-registration accounted for an estimated 5,887 units and 5.80% of 2025 registrations, reaching an estimated 16,800 units and 8.00% by 2030 at 23.33%. The channel tracks manufacturer volume-quota management rather than end demand and should be read as a supply-side indicator of how hard the segment is being pushed.
Short-term rental accounted for an estimated 2,436 units and 2.40% of 2025 registrations, the smallest channel, reaching an estimated 8,400 units and 4.00% by 2030 at 28.09%, the fastest rate on a small base. Fleet turnaround logistics and the risk of uncharged returns cap the channel structurally even as it grows.
Compact crossovers hold the plurality at an estimated 42,123 units and 41.50% of 2025 registrations, reaching an estimated 84,000 units and 40.00% by 2030 at 14.80%. The class spans a price range from below EUR 39,000 to premium variants and carries the market's best-selling nameplate at over 14,200 units in 2025.
Mid-size SUVs account for an estimated 22,330 units and 22.00% of 2025 registrations, reaching an estimated 48,300 units and 23.00% by 2030 at 16.68%. The class carries the largest packs in the market, with a 19.7 kWh platform yielding 115 to 125 km of certified electric range, which positions it to clear the 2027 threshold with the widest margin.
Premium compact and mid-size SUVs account for an estimated 26,898 units and 26.50% of 2025 registrations, reaching an estimated 50,400 units at 13.38% but easing to 24.00% of the segment as growth arrives lower down the range. Competition runs on corporate car-list placement and residual value, led by a nameplate at 6,850 units against 3,145 a year earlier.
Saloons, estates and multi-purpose vehicles account for an estimated 9,337 units and 9.20% of 2025 registrations, reaching an estimated 19,950 units and 9.50% by 2030 at 16.40%. The class holds its share as fleet buyers retain non-SUV options for motorway-duty assignments where efficiency outweighs ride height.
Sub-compact plug-in hybrids account for an estimated 812 units and 0.80% of 2025 registrations, reaching an estimated 7,350 units and 3.50% by 2030 at 55.36%, the fastest-growing body class. Entry pricing from new entrants is what makes the packaging viable in Italy's largest and historically most combustion-dominated body class.
Packs above 20 kWh account for an estimated 28,420 units and 28.00% of 2025 registrations, reaching an estimated 151,200 units and 72.00% by 2030 at 39.70%, the fastest-growing segment on the page. This is the compliance-safe band, delivering 100 km or more of certified range and 30 to 50 kW direct-current charging, and it is where every surviving nameplate arrives by 2027.
Packs between 15 kWh and 20 kWh account for an estimated 38,570 units and 38.00% of 2025 registrations, the largest band at the base year, growing to an estimated 50,400 units at 5.50% but easing to 24.00% of the segment. A 19.7 kWh platform sits at the top of this band and clears the threshold; models nearer 15 kWh do not, so the band splits internally rather than moving as one.
Packs below 15 kWh account for an estimated 34,510 units and 34.00% of 2025 registrations, falling to an estimated 8,400 units and 4.00% by 2030 at negative 24.62%, the only declining segment on the page. The decline is regulatory rather than commercial: an 11.4 kWh pack yielding 45 to 50 km cannot hold a sub-60 g/km certified rating under the revised test cycle at any price.
By Geography
Lombardy
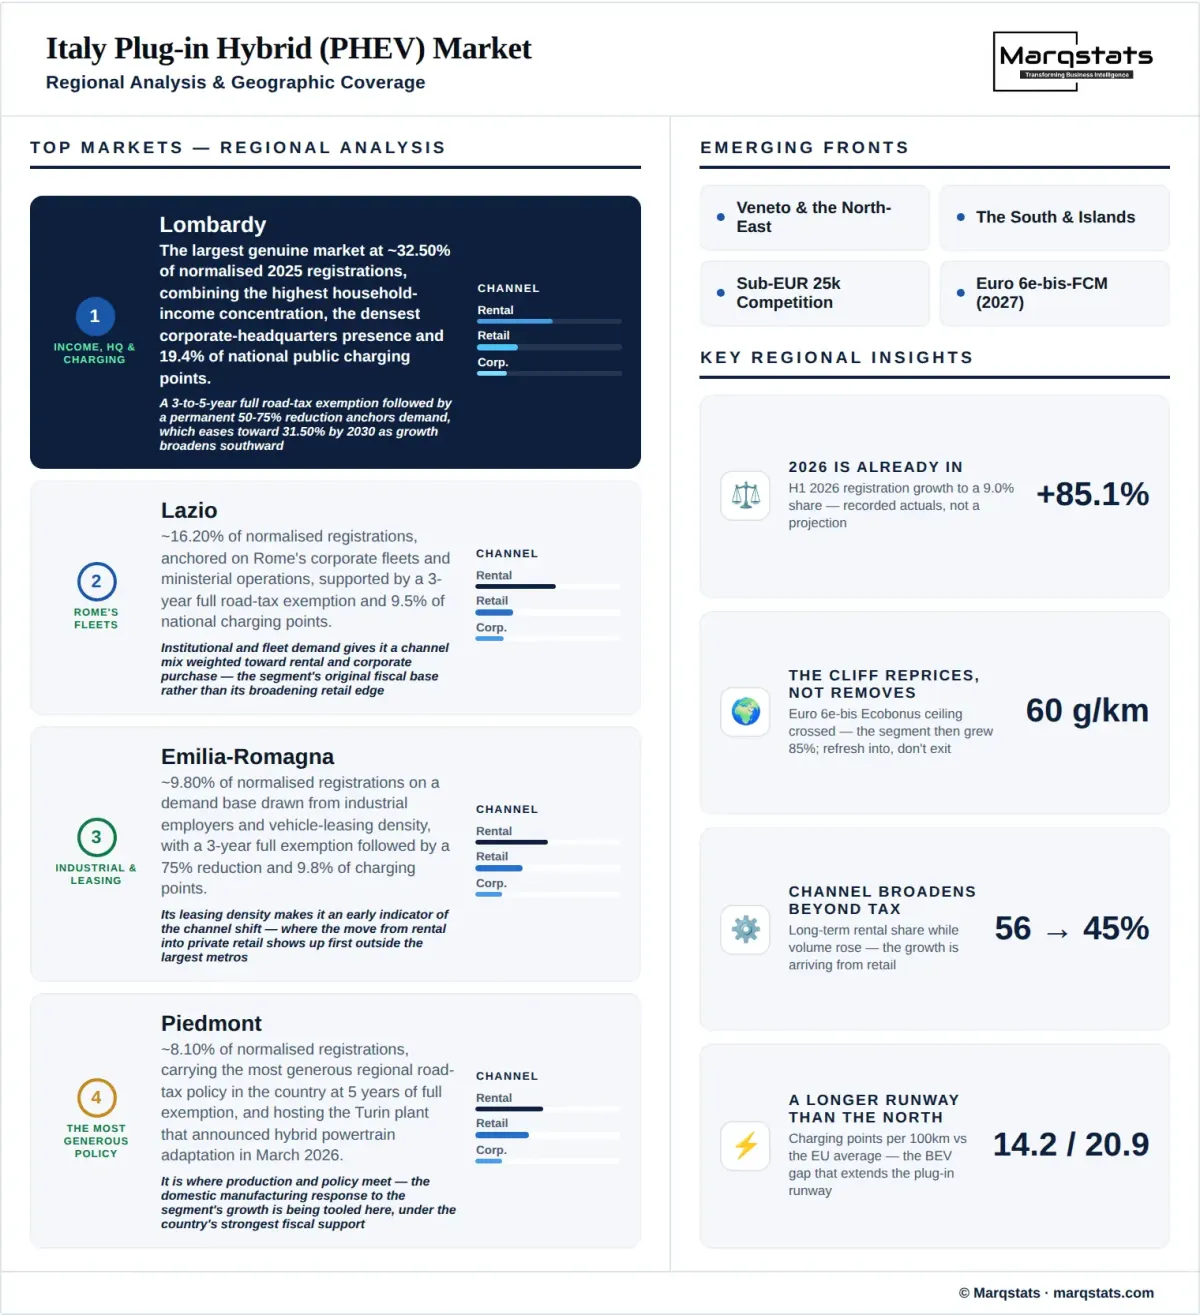
Lombardy is the largest genuine market at an estimated 32,987 units and 32.50% of normalised 2025 registrations, reaching an estimated 66,150 units by 2030 at 14.93% while easing to 31.50% as growth broadens southward. It combines the highest household income concentration in the country, the densest corporate headquarters presence, a 3 to 5 year full road-tax exemption followed by a permanent 50% to 75% reduction, and 19.4% of national public charging points.
Lazio
Lazio holds an estimated 16,443 units and 16.20% of normalised 2025 registrations, reaching an estimated 33,600 units and 16.00% by 2030 at 15.36%. Demand is anchored on Rome's corporate fleets and ministerial operations, supported by a 3-year full road-tax exemption and 9.5% of national public charging points.
Emilia-Romagna
Emilia-Romagna accounts for an estimated 9,947 units and 9.80% of normalised 2025 registrations, reaching an estimated 21,000 units and 10.00% by 2030 at 16.12%. A 3-year full exemption followed by a 75% reduction and 9.8% of national charging points support a demand base drawn from industrial employers and vehicle-leasing density.
Veneto
Veneto holds an estimated 9,541 units and 9.40% of normalised 2025 registrations, reaching an estimated 19,950 units and 9.50% by 2030 at 15.90%. The region carries 10.2% of national public charging points, the second-highest concentration after Lombardy, under the same 3-year exemption and 75% reduction structure as Emilia-Romagna.
Piedmont
Piedmont accounts for an estimated 8,222 units and 8.10% of normalised 2025 registrations, reaching an estimated 16,800 units and 8.00% by 2030 at 15.36%. It carries the most generous regional road-tax policy in the country at 5 years of full exemption, and hosts the Turin plant that announced hybrid powertrain adaptation in March 2026.
Rest of Italy Including Trentino-Alto Adige
The remainder of the country accounts for an estimated 24,360 units and 24.00% of normalised 2025 registrations, reaching an estimated 52,500 units and 25.00% by 2030 at 16.60%, the fastest regional rate. Trentino-Alto Adige sits inside this figure at its normalised operational share rather than at the estimated 25% to 35% of national fleet registrations its offices process, and the south gains share as retail demand broadens.
How Competition Is Evolving
The market is moderately concentrated and actively reshuffling rather than settled. Volkswagen AG led 2025 with 23.4% of registrations, followed by BYD Company Limited at 14.8% and Stellantis N.V. at 13.2%, putting the top three at 51.4% combined. Stellantis dominated the 2020 to 2022 period through a single crossover family and has since ceded share to both a recovering Volkswagen AG and an entrant that was not selling in volume two years ago.
Manufacturers compete on four distinct axes rather than along one price-to-premium spectrum, which is unusual and makes share movement harder to read from price alone. Volkswagen AG defends through platform compliance, with a 19.7 kWh pack holding certified emissions below 22 g/km and shielding volume models from re-homologation risk. BYD Company Limited competes on landed cost, undercutting comparable rivals by EUR 8,000 to EUR 15,000 while matching or exceeding their pack capacity. Bayerische Motoren Werke AG competes on car-list placement and residual value through a captive leasing arm. Stellantis N.V. is bifurcating between 48-volt volume models and a defended premium niche.
The entrant pressure is broader than the plug-in segment and is accelerating. Chinese brands grew 92.1% across the first eight months of 2026 to a 15% share of the total Italian car market, which is the context in which plug-in transaction prices fall while volumes rise. Domestic manufacturing meanwhile sits at two Stellantis facilities, both in transition: the Melfi plant in Basilicata is retooling for a multi-energy platform spanning three further brands, and the Mirafiori plant in Turin announced hybrid powertrain adaptation in March 2026 to support employment as European small battery electric demand softened.
Companies Covered
The report profiles 16+ companies with full strategy and financials analysis, including:
Recent Market Activity
Table of Contents
Coverage & Segmentation
The analysis measures the retail value of new plug-in hybrid electric passenger cars registered in Italy as M1-category vehicles, with 2025 as the base year, 2021 to 2025 as the historical period and 2026 to 2030 as the forecast period, covering sales channel, body type and battery capacity band, with six regional clusters. The 2026 figure of an estimated 157,780 units is carried as a part-year actual extended to full year rather than as a pure projection, built on 1,060,175 total registrations through July at a 9.2% plug-in hybrid share against a full-year market forecast of 1.61 million units. Registrations at 4,497 units in 2019 and 69,312 in 2021 are carried as formation reference points. Battery electric vehicles, non-plug-in and mild hybrids and N1-category light commercial vehicles are excluded. Values are expressed in USD at a disclosed constant USD 1.1550 per EUR.
Coverage spans five sales channels, five body types and three battery capacity bands across six regional clusters, and each dimension partitions total registrations exactly in both the base and forecast years. Registration volume is carried as the primary series at 101,500 units in 2025 and average transaction price as the derived series at EUR 48,571. Sixteen legal entities are profiled across manufacturers, leasing operators and charge point operators, with marques counted inside the group that owns them rather than as separate entries.