Market Snapshot
Middle bar: base-year value × (1 + CAGR), rounded to two decimals. This is a calculated illustration, not a separately researched annual estimate.
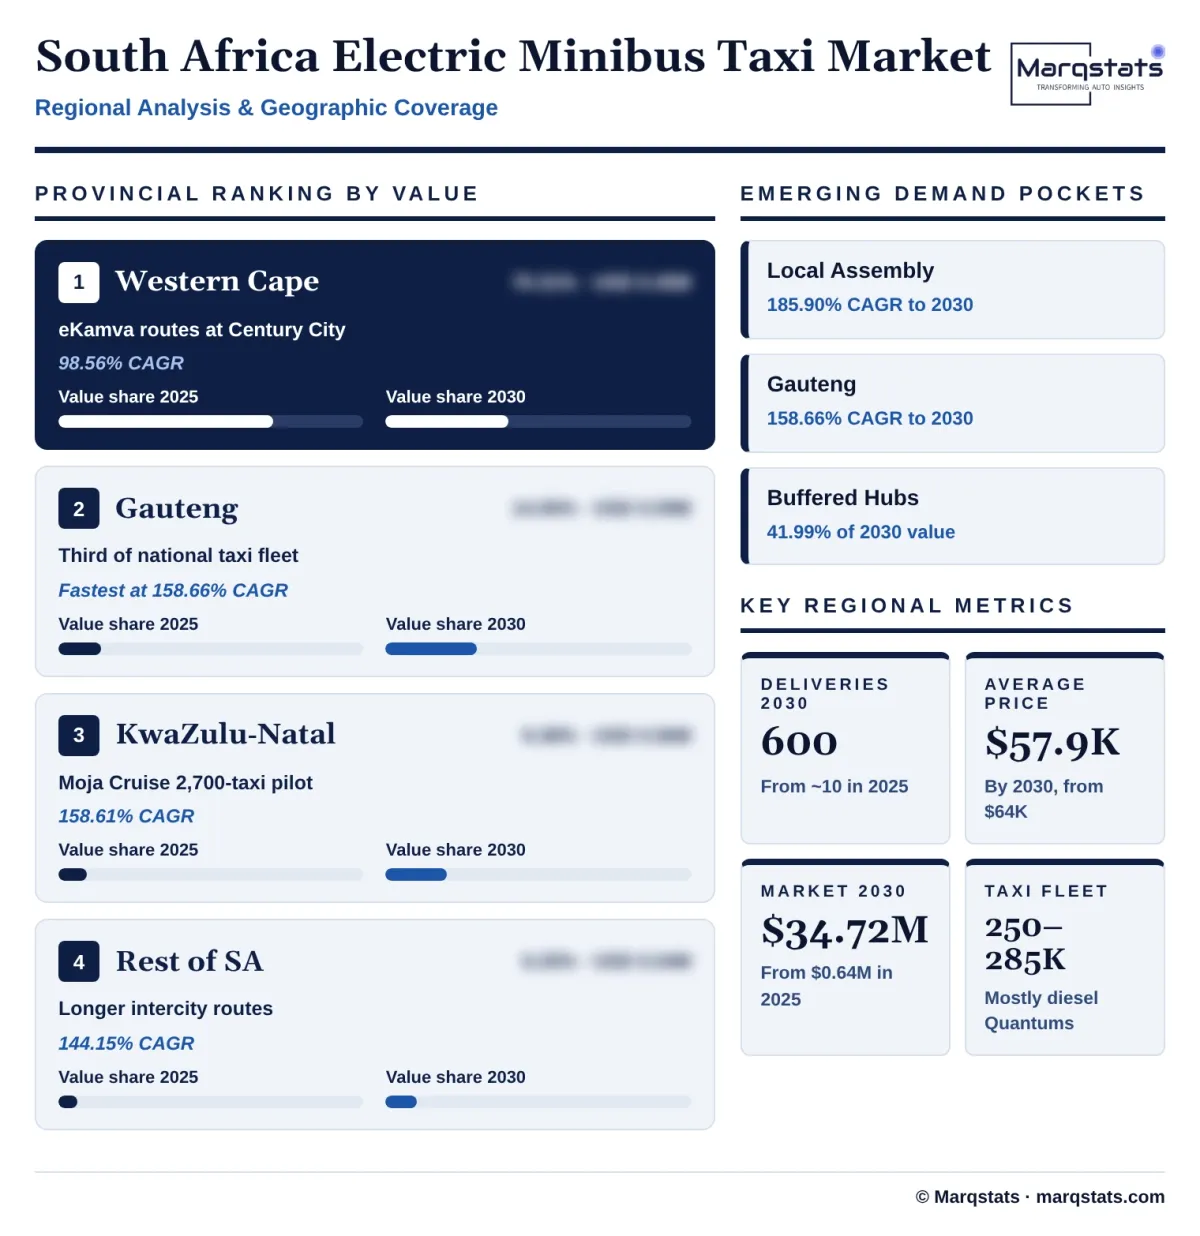
The South Africa electric minibus taxi market size is estimated at USD 0.64 million in 2025 and is projected to reach USD 34.72 million by 2030, growing at a CAGR of 122.27% over 2026 – 2030. Annual deliveries rise from about 10 electric minibus taxis to 600, a 126.79% annual rate, while the average cleared price falls from about USD 64,000 to USD 57,867 per vehicle. Measured from the first year of route service, value grows at 107.03% a year between 2026 and 2030.
Marqstats defines the market as the cleared value of new battery-electric minibuses with 14 to 25 passenger seats, UNECE Category M2, delivered into fare-paying minibus taxi service in South Africa, including ICE-to-electric conversions homologated for taxi use. Full-size electric buses, corporate, campus and scholar shuttles, e-hailing cars, charging hardware sold separately, battery energy contract fees after delivery and fare revenue are excluded. Values are converted at ZAR 17.88 per US dollar, the 2025 annual average.
Battery-as-a-Service contracts account for an estimated 62.50% of 2025 value and fully built imports for 84.38%. The Western Cape accounts for 70.31% of 2025 value. The study segments the market by financing model, assembly route, charging architecture and province.
Key Takeaways
Market Overview & Analysis
Report Summary
Marqstats sizes the South Africa electric minibus taxi market as the cleared value of new battery-electric minibuses with 14 to 25 seats delivered into fare-paying taxi service. In 2025 about 10 vehicles were delivered, mostly eKamva validation units and converted demonstrators, worth an estimated USD 0.64 million, or R11.44 million, at an average cleared price of about USD 64,000.
Minibus taxis are the backbone of South African public transport. The Minister of Transport cites an active fleet of 250,000 to 285,000 vehicles, and in Cape Town alone about 830,000 passengers a day travel on 1,466 taxi routes. Almost all of these vehicles are diesel or petrol Toyota Quantum and Ses'fikile vans bought by individual owners and operated through route associations affiliated to the South African National Taxi Council (SANTACO) or the National Taxi Alliance.
Fleet renewal has stalled. New minibus taxi sales fell 49.4% to 9,454 units in 2024 and to 8,747 in 2025, as stricter lending at SA Taxi, which says it finances more than 11% of operating taxis, cut credit to owners. Total new vehicle sales in South Africa rose 16% to 597,194 units in 2025, so the taxi slump is a finance problem rather than a demand problem, and an older fleet raises the cost of every litre of diesel and every breakdown.
Electrification started with one purpose-built vehicle. GoMetro and its flx EV consortium, with partners including Powerfleet, HSW, ACDC Dynamics and Stellenbosch University, unveiled the 15-seat eKamva at the Smarter Mobility Africa summit in October 2024. Built on a Higer Bus Company chassis, it has a 90 kW motor with 300 Nm of torque, more than 200 km of range and a laden mass of 3,980 kg, and charges in about 75 minutes on a 60 kW DC charger or overnight in about 10 hours.
Route service is beginning in Cape Town. In March 2026 GoMetro said the first routes at the Century City public transport interchange would start in about October 2026 with about 15 associations, with the aim of making the interchange fully electric within three to four years. The Subnational Climate Fund records the pilot launch with a memorandum of understanding and flag-off on 1 October 2026, funded by a Nordic Development Fund grant through the EEP Africa Trust Fund with co-financing from uYilo and GoMetro.
Daily operations suit batteries. Fleet tracking of 616 Cape Town taxis over 11,940 vehicle-days shows a median daily distance of about 111 km and typical energy use of about 50.8 kWh a day, while GoMetro plans around a 120 km morning peak, a 120 km afternoon peak and a three- to four-hour midday rest. A 60 kW charger at the rank during that rest, or overnight charging at home, keeps a 200 km vehicle on the road for a full working day.
Regulation shapes the vehicle. Imported minibuses need homologation by the National Regulator for Compulsory Specifications (NRCS) and builder accreditation before they can be licensed for public transport, and operating licences are tied to routes allocated through provincial regulatory entities. The 2025 Division of Revenue Act also requires municipalities to consider zero-emission technology when buying fleets under Integrated Public Transport Network grants, which gives electric feeder services a procurement route alongside the taxi industry.
The economics differ from other African markets. Kenya's electric matatus charge on a grid dominated by geothermal and hydro power, while South Africa's grid is about 83% coal, so local emissions and noise, not carbon, are the environmental case. In exchange, South Africa has a deeper vehicle finance industry, an established body-building and assembly base and the largest minibus taxi fleet on the continent, which gives it the largest long-run addressable market once price and finance align.
South Africa Electric Minibus Taxi Market Size and Forecast
The South Africa electric minibus taxi market grows from USD 0.64 million in 2025 to USD 34.72 million in 2030, a CAGR of 122.27%. Marqstats expects about 30 deliveries worth USD 1.89 million in 2026, 90 worth USD 5.58 million in 2027, 210 worth USD 12.71 million in 2028 and 380 worth USD 22.42 million in 2029, before 600 vehicles in 2030. In rand at the constant 2025 rate, the market grows from R11.44 million to about R620.79 million.
Prices fall as assembly moves to South Africa. The average cleared price falls from about USD 64,000 in 2025 to USD 62,000 in 2027 and USD 57,867 in 2030 as semi-knocked-down and completely knocked-down assembly replaces fully built imports; Stellenbosch University estimates that CKD assembly costs 13% to 21% less than importing a complete vehicle. Deliveries therefore grow at 126.79% a year while value grows at 122.27%.
The installed base stays small. Marqstats estimates about 17 electric minibus taxis were in service or under validation at the end of 2025, rising to about 1,330 by 2030, roughly 0.5% of the national fleet. GreenCape models a faster path, with about 2,000 annual sales and a parc of about 3,700 by 2030; Marqstats expects about 600 deliveries in 2030 because the import duty and ad valorem tax remain in place, state grants are being cut by R8.6 billion and route service only began in October 2026.
Operating economics decide adoption. Stellenbosch University puts the energy cost of a diesel minibus taxi at R2.57 per km and total operating cost at R3.96 per km, against R1.10 and R2.26 per km for an electric minibus charged partly at home at a blended R2.42 per kWh. Using only public AC chargers at R3.00 per kWh raises the electric cost to R2.52 per km, and relying on R6.00 per kWh fast charging lifts it to R3.89 per km, close to diesel, so the charging tariff matters as much as the vehicle price.
Financing costs compress the saving. The same study assumes a 10% deposit, 20% interest and a 72-month term for taxi finance, and finds an electric minibus costs 1.4 to 2 times a diesel Toyota Ses'fikile, or 1.2 to 1.7 times without import duty. At those rates the monthly repayment on a R1.2 million vehicle absorbs much of the fuel saving, which is why separating the battery into an energy contract is central to the forecast.
Marqstats tracks four indicators to monitor the forecast: the number of eKamva vehicles in route service at Century City and other ranks, changes to customs duty and ad valorem excise on electric vehicles in the annual Budget, the design of the consolidated public transport fund and any enhanced scrapping allowance for electric taxis, and charging tariffs and grid connection times at ranks.
The mix shifts toward local assembly and buffered charging. Locally assembled and converted minibuses rise from 15.62% to 55.01% of value, Battery-as-a-Service from 62.50% to 69.99% and battery-buffered and solar hubs from 34.38% to 41.99%. The Western Cape remains the largest province but its share falls from 70.31% to 40.01% as Gauteng rises to 30.01% and KwaZulu-Natal to 19.99%.
Tax policy is the main upside risk. If National Treasury removed ad valorem excise on commercial M2 electric minibuses, GoMetro's estimate implies a purchase price near diesel parity, which would move the market toward GreenCape's 2,000-unit annual path. Marqstats keeps the excise in its forecast because no such change has been announced and the 2026 budget reduced transport grants.
Market Dynamics
Key Drivers
Five forces are pushing South African taxi owners and associations toward electric minibuses.
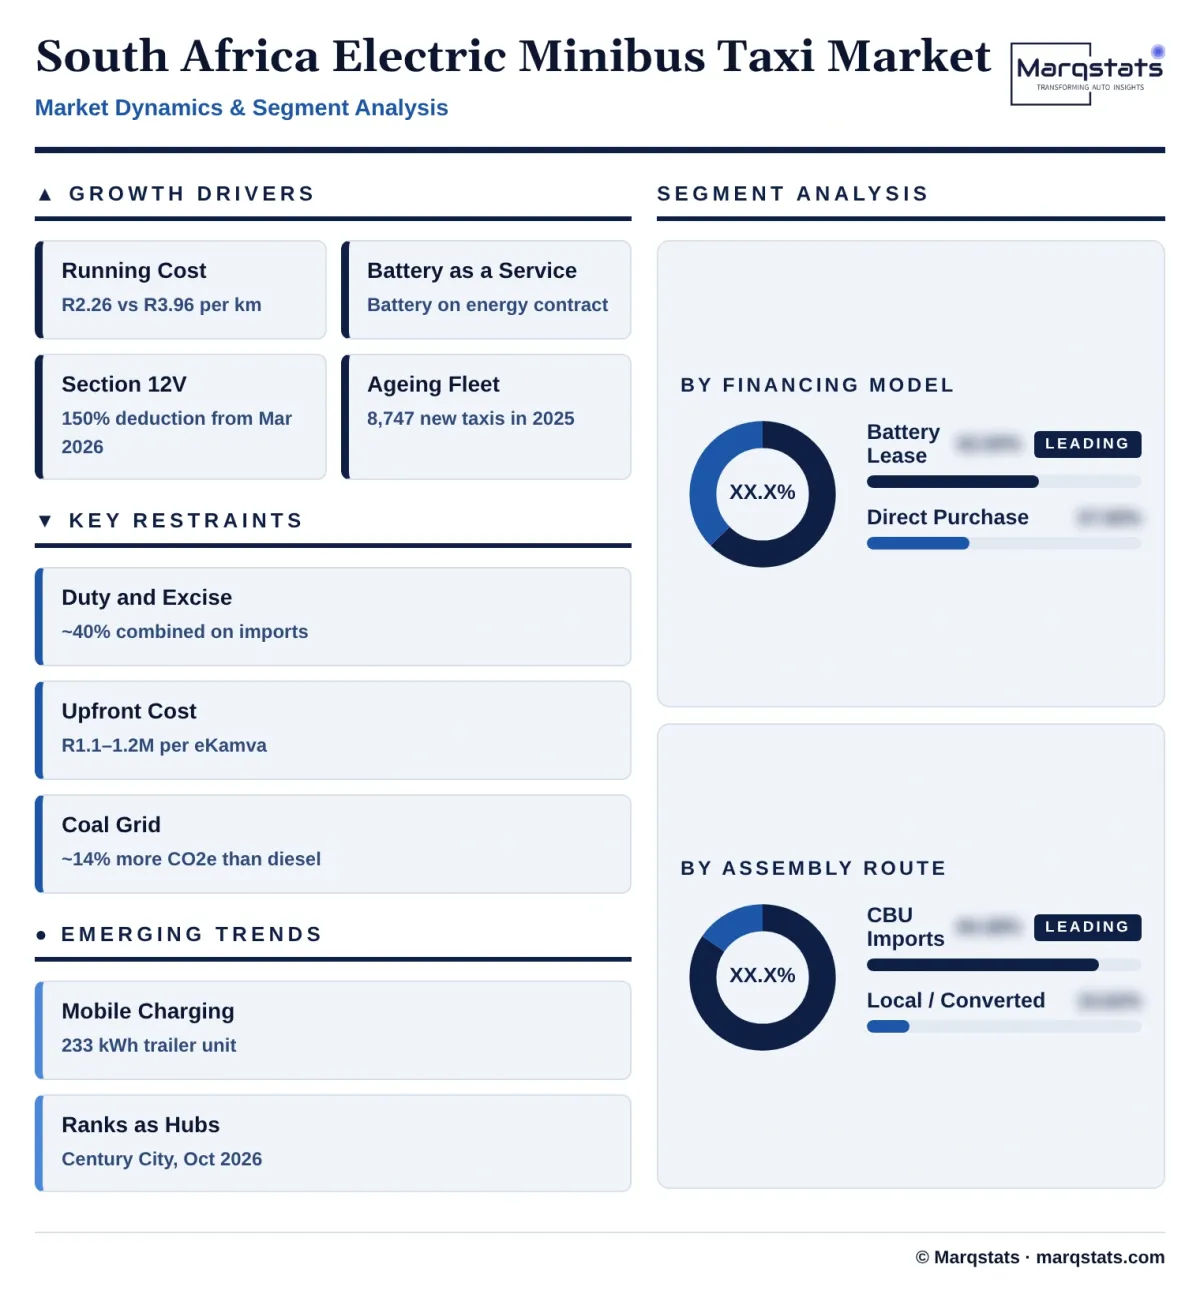
- Lower running cost. Stellenbosch University estimates electric operating cost at R2.26 per km against R3.96 for diesel, and GoMetro expects savings of 40% to 70% depending on solar and home charging, which lifts daily margins for owners who pay drivers from fares.
- Battery-as-a-Service financing. flx EV finances the chassis like a diesel vehicle loan and sells the battery through a separate energy contract, so banks underwrite a familiar asset while the battery risk sits with the energy provider.
- Section 12V manufacturing deduction. A 150% first-year deduction for investment in battery-electric and hydrogen vehicle production applies to assets brought into use from 1 March 2026 to 1 March 2036, and its heavy motor vehicle category covers vehicles for ten or more persons above 2,000 kg.
- Ageing diesel fleet. With new taxi sales at 8,747 in 2025, about half the 2023 level, the fleet is ageing and maintenance costs are rising, which strengthens the case for vehicles with fewer moving parts and lower brake wear.
- Air quality and noise at ranks. Electric minibus taxis cut PM2.5 per km by about 76% against diesel and reduce noise by about 30% at 27 km/h, benefits that property owners and municipalities can price into rank and interchange agreements.
Key Restraints
Four constraints keep electric minibus taxis expensive and slow to scale in South Africa.
- Import duty and ad valorem tax. South Africa charges 25% customs duty on imported electric vehicles and ad valorem excise on vehicles above the luxury threshold, which GoMetro says together reach about 40% on an imported electric taxi.
- Upfront cost and credit. At R1.1 million to R1.2 million an eKamva costs far more than a diesel Quantum, and taxi finance at about 20% interest over 72 months, with SA Taxi tightening lending, limits how many owners can borrow.
- Coal-heavy grid and charging prices. Coal supplies about 83% of electricity, so grid-charged electric taxis emit about 14% more CO2e than diesel, and charging above about R4.50 per kWh removes the operating cost advantage.
- Shrinking public funding. The consolidation of the Taxi Recapitalisation Programme into a single public transport fund with R8.6 billion less in grants over the medium term reduces the state capital available to subsidise electric replacements.
Key Trends
Four shifts are changing how electric minibus taxis are built, financed and charged in South Africa.
- Battery-buffered mobile charging. flx EV's trailer-mounted unit carries a 233 kWh LFP battery and 120 kW of dual CCS2 DC output, recharges in about two hours on 125 kW AC, weighs under 3.5 tonnes and keeps charging during load-shedding.
- Interchanges as charging hubs. Property owners such as the Century City Property Owners Association are turning off-street taxi interchanges into charging sites, so ranks become energy businesses as well as transport nodes.
- Digital fare and fleet systems. In KwaZulu-Natal, Calmex Mobile is piloting automated fare collection, tracking and biometric systems on 2,700 taxis under the Moja Cruise programme, the data base that per-km energy contracts need.
- Local battery and storage supply. ACTOM Static Energy opened a battery storage assembly plant of about R40 million in July 2026 with more than 50% local content and tenfold capacity, giving rank hubs a local source of stationary storage.
Strategic Implications
- For vehicle suppliers, local assembly is the entry ticket. Assembling minibuses from SKD or CKD kits with an NRCS-accredited builder qualifies for the Section 12V deduction and cuts the 13% to 21% cost penalty of fully built imports.
- For taxi associations, charging access decides profitability. Associations that negotiate home or rank charging below about R3.00 per kWh keep most of the saving; those dependent on R6.00 per kWh fast charging will see costs close to diesel.
- For banks and development finance institutions, splitting chassis and battery opens the market. Lending against a chassis with a known resale value, while the battery is financed as infrastructure, fits existing taxi credit models and limits residual value risk.
- For property owners and municipalities, interchanges are energy assets. Leasing rank land to charging operators, with solar and battery buffers, turns congestion points into revenue-earning sites and supports zero-emission goals under the 2025 Division of Revenue Act.
- For National Treasury, the excise schedule is the lever. Aligning duty and ad valorem tax on commercial M2 electric minibuses with the treatment of combustion taxis would do more for adoption than a new subsidy, at limited fiscal cost while volumes are small.
- For investors, utilisation and tariff are the key assumptions. An electric minibus taxi pays back only when it runs above about 110 km a day on charging below about R4.50 per kWh, so route density, rank access and the energy contract price decide returns as much as the purchase price does.
Market Segmentation
Contracts in which the chassis is financed or bought and the battery is paid through a separate energy or per-km contract account for 62.50% of 2025 value, USD 0.40 million, rising to USD 24.30 million by 2030, a 127.36% CAGR, and 69.99% of the market. This is the flx EV model at Century City: it brings the upfront payment close to a diesel vehicle and moves battery degradation and end-of-life risk to the energy provider, which is why it dominates while owners lack the credit to buy a R1.2 million vehicle outright.
Outright purchase or conventional asset finance of the complete vehicle accounts for 37.50% of 2025 value, USD 0.24 million, and grows at 112.58% a year to USD 10.42 million and 30.01% of 2030 value. It is used mainly by larger fleet owners and by municipal and corporate buyers; it gains volume as local assembly lowers prices, but loses share because few individual owners can borrow at 20% interest for the full vehicle.
Fully built imports, mainly Higer-based eKamva vehicles, account for 84.38% of 2025 value, USD 0.54 million, rising to USD 15.62 million by 2030, a 96.00% CAGR, while their share falls to 44.99%. Imports carry 25% customs duty and ad valorem excise, so they remain viable only for early batches and for operators willing to pay for factory-warranted vehicles.
Minibuses assembled locally from SKD or CKD kits, and diesel vans converted to electric drive and homologated for taxi use, account for 15.62% of 2025 value, USD 0.10 million, and grow fastest, at 185.90% a year, to USD 19.10 million and 55.01% of 2030 value. The Section 12V deduction from March 2026 and the 13% to 21% cost advantage of CKD assembly make this the main route to volume.
Vehicles charged on 60 kW to 120 kW grid-connected DC chargers at ranks, interchanges and depots, combined with overnight AC charging, account for 65.62% of 2025 value, USD 0.42 million, rising to USD 20.14 million by 2030, a 116.85% CAGR, and 58.01% of the market. This architecture uses the midday rest at the rank and works where the municipal grid has spare capacity.
Vehicles charged from battery-buffered, trailer-mounted or solar-supported hubs account for 34.38% of 2025 value, USD 0.22 million, and grow at 131.35% a year to USD 14.58 million and 41.99% of 2030 value. Buffered units avoid long substation upgrades and keep charging during load-shedding, which matters more in South Africa than in most markets.
By Geography
Western Cape
The Western Cape is the largest market, with 70.31% of 2025 value, USD 0.45 million, rising to USD 13.89 million by 2030, a 98.56% CAGR, while its share falls to 40.01%. The Century City interchange, where the Century City Property Owners Association helped identify routes and about 15 associations serve more than 25,000 commuters, hosts the first eKamva routes from October 2026, and Stellenbosch University provides the telematics and research base. Golden Arrow Bus Services has deployed 120 battery-electric buses in Cape Town, which has built local skills in depot charging and maintenance.
Gauteng
Gauteng accounts for 14.06% of 2025 value, USD 0.09 million, and grows fastest, at 158.66% a year, to USD 10.42 million and 30.01% of 2030 value. Johannesburg, Tshwane and Ekurhuleni hold more than a third of the national taxi fleet, so the province offers the largest volume once vehicles and financing are proven in Cape Town; municipal grid backlogs and fragmented ranks favour battery-buffered charging there.
KwaZulu-Natal
KwaZulu-Natal accounts for 9.38% of 2025 value, USD 0.06 million, and grows at 158.61% a year to USD 6.94 million and 19.99% of 2030 value. The eThekwini public transport electrification workshop in May 2025, the planned C40 trial of electric buses and minibus taxis with the eThekwini Municipal Taxi Council, and Calmex Mobile's 2,700-taxi fare and tracking pilot under Moja Cruise lay the groundwork for per-km energy contracts.
Rest of South Africa
The rest of South Africa accounts for 6.25% of 2025 value, USD 0.04 million, rising to USD 3.47 million by 2030, a 144.15% CAGR, and 9.99% of the market. The Eastern Cape, Limpopo, Free State and other provinces have large taxi fleets but longer intercity routes and fewer high-capacity interchanges, so adoption follows the metros and depends on regional demonstrations by SANTACO structures.
How Competition Is Evolving
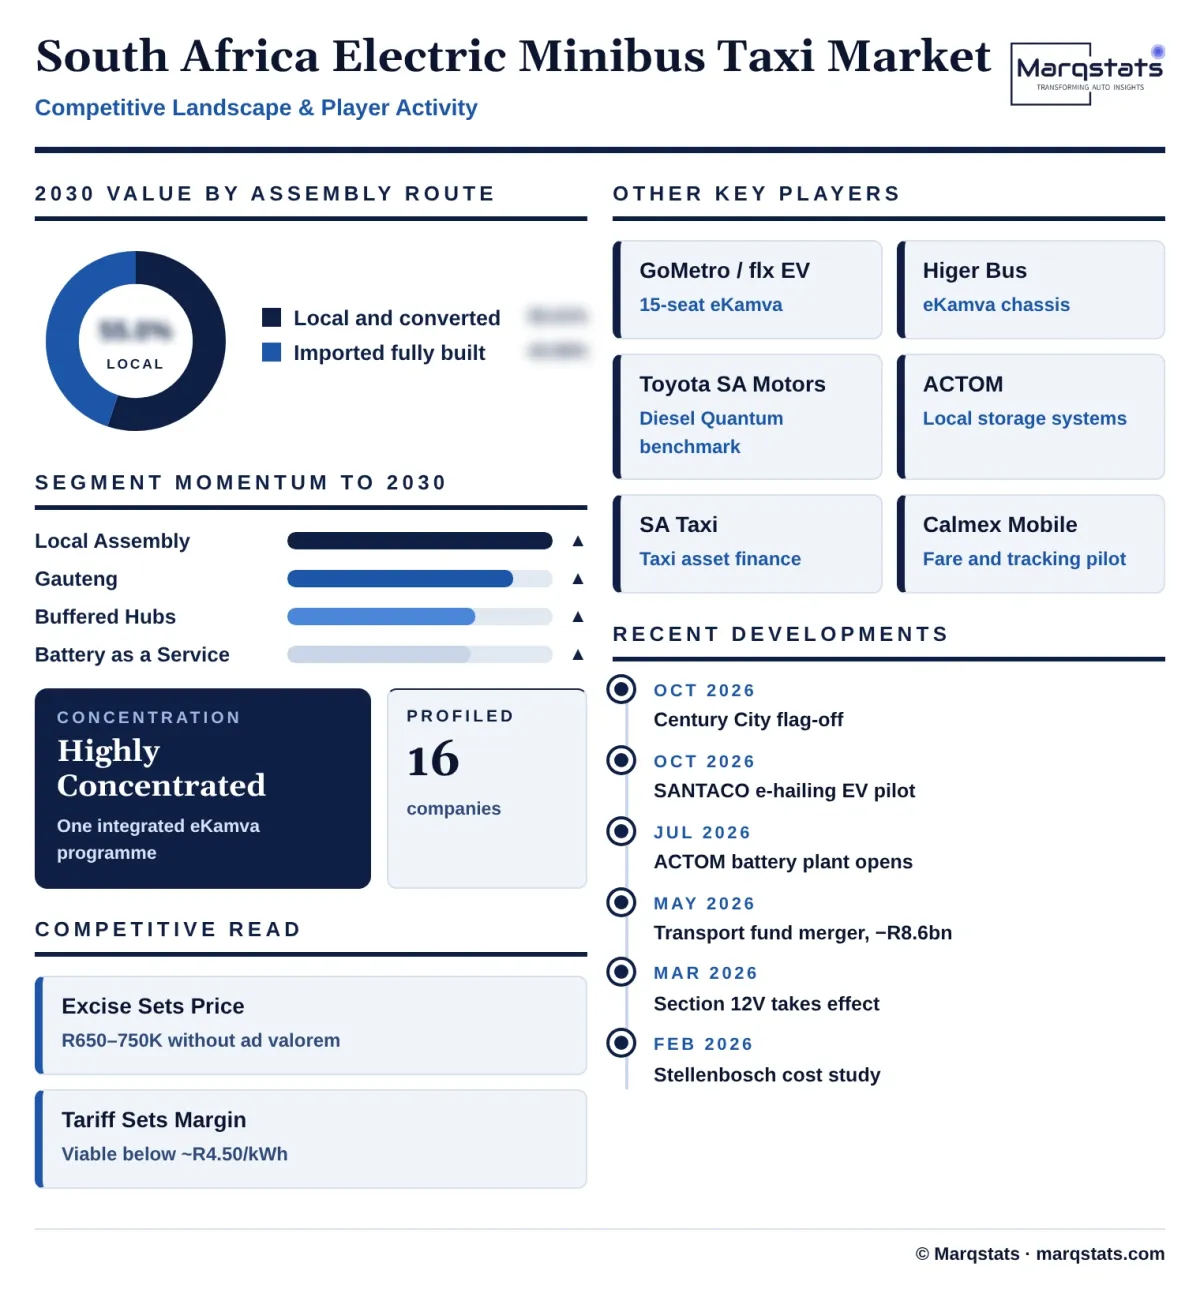
The South Africa electric minibus taxi market is highly concentrated. One integrated programme, the eKamva led by GoMetro and flx EV on a Higer Bus Company chassis, accounts for almost all purpose-built deliveries, while a small number of engineering firms and university teams convert diesel vans to electric drive.
Two business models compete. Integrators such as flx EV supply the vehicle, keep the battery, operate charging and collect an energy fee, competing on financing and uptime. Vehicle suppliers and converters sell or convert vehicles and leave financing and charging to owners, associations and banks.
The incumbent sets the benchmark. Toyota South Africa Motors builds the Quantum and Ses'fikile at its Prospecton plant in Durban, and every electric offer is judged against the price, resale value and parts network of those vans; any decision by Toyota to localise an electrified taxi would reset the market.
Competition will be decided by assembly, finance and charging access. Suppliers that combine local assembly under Section 12V, chassis finance that banks already understand, and charging sites at busy interchanges will capture most deliveries as volumes move beyond Cape Town.
Charging and storage providers form a second competitive layer. flx EV's mobile 233 kWh charger, ACTOM's locally assembled storage systems and rank owners such as the Century City Property Owners Association compete to supply energy to taxis, and the energy contract, not the vehicle sale, is where integrators expect recurring margin.
Companies Covered
Companies covered in the report include:
Recent Market Activity
Table of Contents
Coverage & Segmentation
The study covers the South Africa electric minibus taxi market, with 2025 as the base year, 2021 – 2025 as the historical period and 2026 – 2030 as the forecast period. Values are in US dollars at cleared vehicle prices, converted at ZAR 17.88 per US dollar, and volumes are annual deliveries of new or converted battery-electric minibuses with 14 to 25 seats into fare-paying taxi service. The market is segmented by financing model, assembly route, charging architecture and province.
Full-size electric buses, corporate, campus, scholar and tourist shuttles, e-hailing cars, charging hardware sold separately, battery energy contract fees after delivery and fare revenue are excluded. This market is the South African part of the Marqstats Africa Electric Minibus Taxi report, where it forms the Southern Africa region with the same 2025 and 2030 values; the figures should not be added together. The Marqstats South Africa Electric Bus report covers buses only. Segment and provincial splits are Marqstats estimates built on operator and integrator disclosures, funding announcements, academic fleet data, tax notices and vehicle price benchmarks.