Market Snapshot
Key Takeaways
Market Overview & Analysis
Report Summary
South Africa's electric bus market is small, concentrated and unusually well evidenced. Three procurement decisions account for essentially all committed volume, one operator holds almost all operating experience, and a single depot demonstrates the infrastructure ratio that every subsequent deployment must satisfy. That combination makes the market easy to size and hard to forecast.
The measure used here is an operating plus firmly contracted fleet proxy rather than annual registrations. Delivery schedules span several years and procurement quantities differ from deliveries in any given year, so a registration series would understate commitment while a pipeline series would overstate capability. The proxy sits between them and is stated as such throughout.
The analysis is written for vehicle and chassis suppliers assessing tender requirements, bus bodybuilders evaluating localisation opportunities, charging and grid contractors sizing depot work, municipalities and operators building business cases, and financiers underwriting fleet transactions. It treats the economic unit as a depot solution rather than as a bus, because chargers, grid upgrades, civil works, software, financing and maintenance determine whether a contract closes.
South Africa Electric Bus Market Size and Forecast
The committed electric bus fleet is estimated at 120 units in 2025, rising to 608 in 2026 and 3,200 by 2031. The 2025 figure is the BYD programme delivering 120 buses to Golden Arrow Bus Services, treated as the first fleet-scale commercial block rather than as a national registration statistic. The 2026 figure adds the 450-bus Kiira Motors agreement and the 38-bus Volvo order for the City of Cape Town.
Two growth rates apply and the spread between them is the widest in this research programme. The six-year rate connecting 2025 and 2031 is 72.85%. The five-year rate connecting 2026 and 2031 is 39.40%. The 33.45-point gap exists because the 2026 figure incorporates two contract signatures worth 488 units, a 406.67% single-year increase that no subsequent year can repeat.
Neither rate should be used for planning and the reason is structural rather than statistical. Procurement is concentrated in a few large buyers, so the series moves in discrete blocks when a contract is signed rather than continuously as demand accumulates. A compound rate applied to this market will be wrong in every intermediate year even if it happens to be right at the endpoints.
The 2031 forecast assumes several municipal and private operators replicate the depot-based model that Golden Arrow and Cape Town have established, constrained by grid capacity, charging capital expenditure, grant funding and local bodying capacity. It is a scenario built on repeatability of a demonstrated template, not an extrapolation of contracting activity.
Fleet capital value moves from approximately USD 40 million to USD 960 million across the forecast, on a per-bus convention including charging infrastructure that falls from about USD 333,333 to USD 300,000 as local bodying substitutes for imported complete vehicles. Value therefore compounds at 69.84% against 72.85% for units, because the cost of a bus declines as the market scales.
Two Contracts, One Cost per Bus
The strongest validation available in this market is that two unrelated transactions imply almost the same capital requirement. Golden Arrow's April 2026 agreement with Uganda's Kiira Motors Corporation covers 450 electric buses with charging infrastructure at a reported USD 150 million, which is USD 333,333 per bus including infrastructure.
Separately, Golden Arrow's own reported total investment in its 120-bus electric programme is R750 million, which at a constant ZAR 18.30 per USD is USD 341,530 per bus. The two figures differ by 2.46%, and they were arrived at through entirely different routes: one a forward procurement contract with an intra-African supplier, the other retrospective capital expenditure on a delivered Chinese fleet.
That convergence is what allows a capital value series to be published at all in a market with three transactions. It also sets the benchmark a new entrant must beat, and it prices the depot rather than the vehicle, which is the correct unit for anyone underwriting this market.
Grid Capacity Is the Binding Constraint
Smart EV completed a 50-charger electric bus hub at Golden Arrow's Arrowgate depot in Cape Town in December 2025, installing 30 plus 20 dual-gun 120 kW direct-current chargers and increasing grid supply from 1 MW to 6 MW. That allowed the depot to charge as many as 100 buses in about 90 minutes when required, and the installation has since grown to 60 direct-current charging stations serving up to 120 buses.
The ratio embedded in that project is the single most transferable number in this market. A sixfold grid uplift for roughly 100 buses implies about 60 kW of depot grid capacity per bus in high-throughput operation. Applied to the 3,200-unit 2031 forecast, that implies approximately 192 MW of new depot grid capacity nationally, and to the 608-unit 2026 committed fleet about 36 MW.
Electricity connection lead times and funding availability are therefore the most important practical constraints on how quickly contracted fleet volumes become operating buses. A bus can be ordered in a quarter and bodied in a year; a municipal or industrial grid connection upgrade of that scale is a multi-year civil and utility process that no procurement decision can accelerate.
Golden Arrow has partially answered the question with generation rather than only with connection. Solar installations produced 3,266 megawatt hours over a twelve-month period, equivalent to powering approximately 3.3 million kilometres of operation, which implies energy consumption of roughly 0.99 kilowatt hours per kilometre and demonstrates on-site generation as a route around constrained supply.
Recapitalisation Rate Caps the Transition
Golden Arrow operates approximately 1,200 buses and replaces 60 to 65 of them each year. At that rate, converting the entire fleet takes roughly 18 years even if every replacement bus is electric and no financial or grid constraint intervenes. The 120 electric buses currently operating represent about 10% of the fleet and roughly two years of normal recapitalisation.
That arithmetic reframes the market for a supplier. Demand is not created by a decision to electrify; it is released by the replacement cycle, and a bus bought today removes a procurement opportunity for roughly fifteen years. Winning a tender is therefore worth far more than its unit count suggests, and losing one closes the account for longer than most sales plans assume.
It also explains why the Kiira agreement matters disproportionately. At 450 buses it is roughly seven years of Golden Arrow's normal recapitalisation compressed into one contract, which is only possible because it is an additional electrification programme rather than a like-for-like replacement, and which is why its delivery schedule spans multiple years.
Municipal Procurement and the Cape Town Template
Volvo Buses announced an order for 38 BZR Low Entry Electric buses for the City of Cape Town in August 2026, funded through the Public Transport National Grant, with bodies to be manufactured locally by Gauteng Bus and Coach Centre and first deliveries scheduled from 2027. The city has stated that 38 is a minimum and that the number may increase with funding availability.
Cape Town began real-world testing of its first twelve-metre Volvo BZR Low Entry Electric MyCiTi bus in July 2026 on demanding urban routes, assessing battery performance, energy consumption, charging time, passenger loading and route conditions ahead of wider rollout. The prototype is locally bodied, which makes the pilot a test of the supply chain as well as of the vehicle.
The vehicle itself is specified for the duty rather than for the headline. The BZR Low Entry Electric carries up to 630 kilowatt hours nominally across seven battery packs of 90 kilowatt hours each, which is substantially more than the 230 kilowatt hours of the BYD B12 units at Golden Arrow and reflects a different route profile and charging strategy rather than a better vehicle.
Municipal procurement depends on public transport grants and on grid infrastructure, which is why the funding source is stated in the announcement and why quantities are expressed as minimums. Procurement quantities and actual annual deliveries differ, and any market tracking that conflates the two will overstate near-term volumes while understating commitment.
Local Bodying as the Practical Localisation Route
The Cape Town order establishes the intermediate localisation model that this market is likely to follow: imported chassis and drivetrain with locally manufactured bodies. Gauteng Bus and Coach Centre bodies the 38 Volvo units in Johannesburg, which captures value and employment domestically without requiring full chassis manufacturing capability.
That route has a policy tailwind. The 150% first-year manufacturing allowance supports local battery-electric production investment, and local bodying demonstrates a qualifying activity at a scale a bus market can actually support, unlike a full vehicle plant sized for a 3,200-unit market over six years.
Bodying and aftersales capability are also emerging as tender differentiators rather than only as cost decisions. A supplier offering local bodies, local parts and local technical support answers the availability and residual questions a municipality must satisfy to justify grant expenditure, which is a different competition from the one fought on vehicle specification.
The Depot Solution Is the Product
For market entry, the economic unit is a fleet or depot solution rather than a bus. Chargers, grid upgrade, civil works, depot management software, financing and maintenance determine bankability, and the Arrowgate project demonstrates the point precisely: 60 charging stations and a grid uplift from 1 MW to 6 MW are the deliverable, not an accessory to it.
This creates a competitive layer around vehicle manufacturers that is at least as important as the vehicles themselves. Bus body builders, charging integrators, civil works contractors, grid upgrade specialists, telematics providers and depot management software vendors all participate in the same transaction, and a vehicle supplier without partners across that stack is bidding on part of the problem.
It also changes who the customer is. A municipality buying 38 buses is procuring a transport service capability, and the winning proposition addresses energy supply, depot works, driver training, maintenance and data as one package. The Kiira agreement bundling 450 buses with charging infrastructure is the clearest expression of that logic in the market to date.
Intra-African Supply and AfCFTA
The Kiira Motors agreement is the first significant intra-African vehicle procurement in this market and it establishes a precedent worth watching. A Ugandan manufacturer supplying 450 electric buses with charging infrastructure to a South African operator is a continental supply relationship rather than an import from Asia or Europe, and it operates inside the framework the African Continental Free Trade Area is intended to enable.
Certification, homologation and aftersales obligations remain the practical tests. A 450-bus contract creates parts, service and warranty obligations across a multi-year delivery schedule, and those are precisely the capabilities a newer manufacturer must demonstrate rather than assert. The contract's execution will be more informative than its signature.
For established suppliers the competitive implication is direct. BYD holds the operating incumbency through 120 delivered buses and just under four million kilometres of data; Volvo holds the municipal beachhead with local bodying; Kiira holds the largest single contract at 450 units. Three different entry strategies are being tested simultaneously in a market of fewer than 700 committed vehicles.
Market Dynamics
Key Drivers
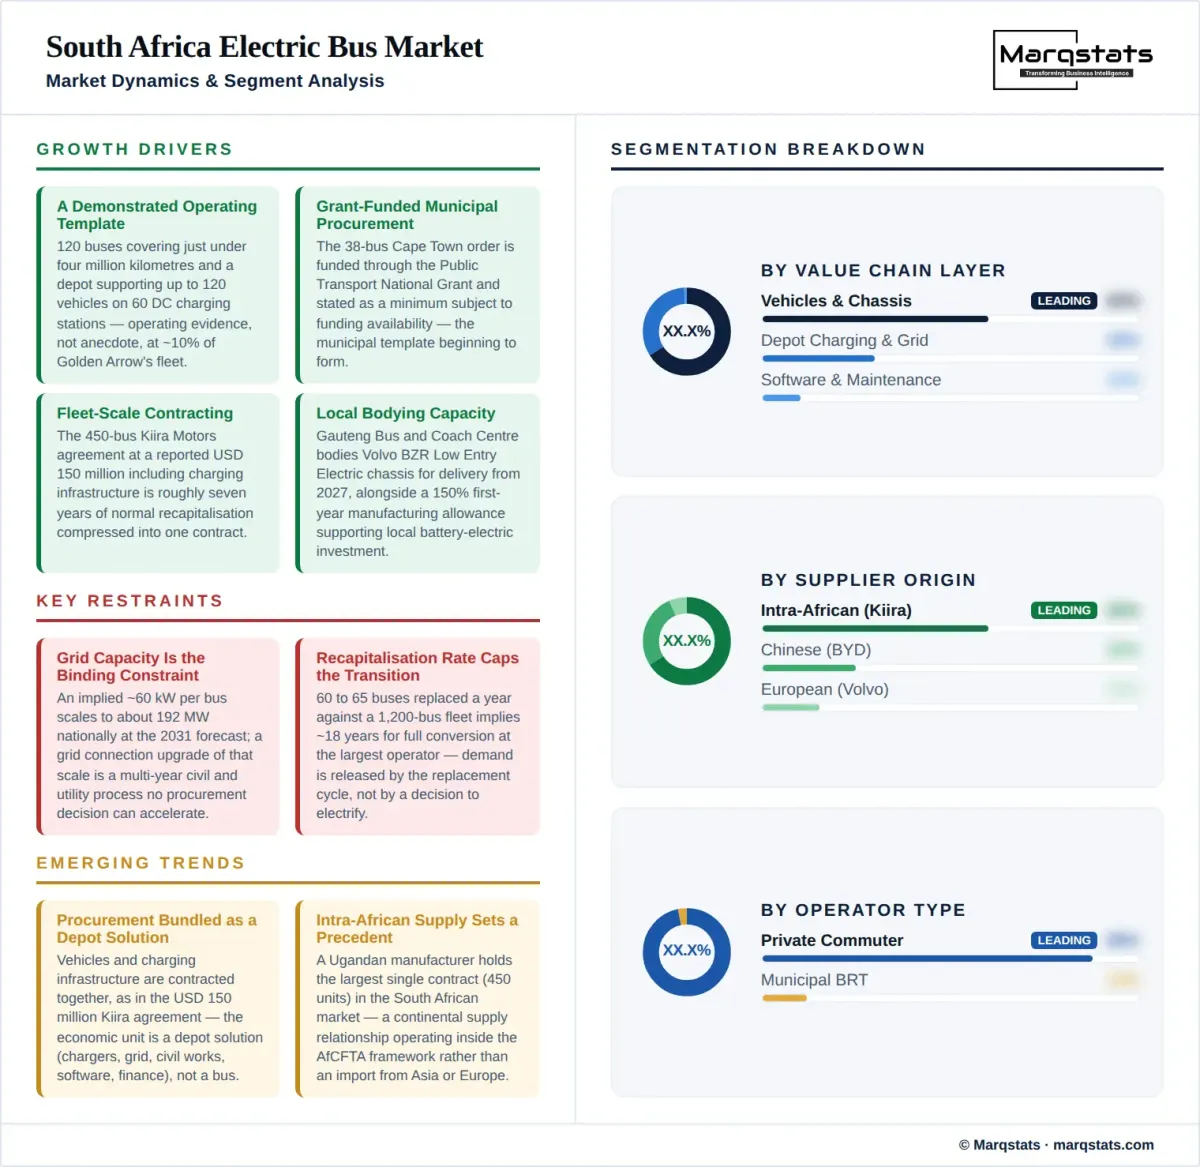
- A demonstrated operating template, with 120 buses covering just under four million kilometres and a depot supporting up to 120 vehicles on 60 direct-current charging stations.
- Grant-funded municipal procurement, with the 38-bus Cape Town order funded through the Public Transport National Grant and stated as a minimum subject to funding availability.
- Fleet-scale contracting, with the 450-bus Kiira Motors agreement at a reported USD 150 million including charging infrastructure.
- Local bodying capacity, with Gauteng Bus and Coach Centre bodying Volvo BZR Low Entry Electric chassis for delivery from 2027 alongside a 150% first-year manufacturing allowance.
- On-site generation economics, with 3,266 megawatt hours of solar output over twelve months covering approximately 3.3 million kilometres of operation.
Key Restraints
- Grid connection capacity and lead times, with an implied requirement of roughly 60 kW per bus scaling to about 192 MW nationally at the 2031 forecast.
- Recapitalisation rate, with 60 to 65 buses replaced a year against a 1,200-bus fleet implying roughly 18 years for full conversion at the largest operator.
- Capital cost per unit, at approximately USD 333,333 to USD 341,530 per bus including infrastructure on the two available reference contracts.
- Buyer concentration, with three procurement decisions accounting for essentially all of the 608-unit committed fleet in 2026.
Key Trends
- Bundled procurement, with vehicles and charging infrastructure contracted together as in the USD 150 million Kiira agreement.
- Local bodying of imported chassis as the intermediate localisation route, demonstrated on 38 Volvo units for Cape Town.
- Intra-African supply relationships, with a Ugandan manufacturer holding the largest single contract in the South African market.
- Divergent battery strategies, with 630 kilowatt hour Volvo specifications against 230 kilowatt hour BYD units reflecting different route and charging profiles.
Market Segmentation
The category holding essentially all operating experience in the country, anchored by Golden Arrow Bus Services with 120 electric buses inside a fleet of approximately 1,200 and a total investment of R750 million. These operators fund from balance sheet and contract revenue rather than from grants, which makes their procurement faster to close and harder to scale.
The segment that will drive volume growth, opened by the City of Cape Town's 38-unit Volvo order funded through the Public Transport National Grant and stated as a minimum. Municipal procurement moves in grant cycles rather than in commercial cycles, which makes quantities larger and timelines less predictable than private operator purchases.
Staff transport, mining shuttle, university and airport operations are effectively unrepresented in the 608-unit committed fleet as of 2026, despite route profiles that suit electric operation particularly well. Fixed routes, depot returns and predictable duty cycles are exactly the conditions the 0.99 kilowatt hour per kilometre consumption evidence rewards.
The incumbent position by delivered volume, with BYD supplying the 120-bus Golden Arrow programme using B12 units carrying 230 kilowatt hour batteries and charging in approximately two hours. Chinese suppliers hold the only substantial South African operating dataset, at just under four million kilometres, which is a tender asset no competitor can currently match.
Represented principally by Volvo Buses through the 38-unit BZR Low Entry Electric order for Cape Town, specified at up to 630 kilowatt hours across seven 90 kilowatt hour packs. The European entry route is municipal procurement combined with local bodying rather than fleet-scale private contracting.
Established by Kiira Motors Corporation's 450-bus agreement with Golden Arrow at a reported USD 150 million including charging infrastructure, the largest single contract in the market. The segment's credibility rests on execution of certification, homologation and aftersales obligations across a multi-year delivery schedule rather than on the contract value.
The 120 buses delivered to Golden Arrow, carrying just under four million kilometres of accumulated operating data at approximately 33,333 kilometres per bus. This is the only stage generating real energy consumption, reliability and maintenance evidence, which is why a single operator's experience currently defines national assumptions.
The 488 units added in 2026 through the 450-bus Kiira agreement and the 38-bus Cape Town order, taking the committed proxy to 608. These are firm commitments with identified funding whose delivery schedules span multiple years, and they are the reason committed fleet and operating fleet must be tracked as separate series.
Municipal and operator intentions beyond currently funded orders, including Cape Town's statement that its 38-unit order is a minimum that may increase with funding availability. This stage is excluded from the committed proxy entirely, because the gap between a stated intention and a grant allocation is where most electric bus pipelines in emerging markets are lost.
The dominant class in commuter operation and the format of both the BYD B12 units at Golden Arrow and the Volvo BZR Low Entry Electric prototype that Cape Town began testing in July 2026. Standard twelve-metre vehicles carry the duty cycles that justify batteries between 230 and 630 kilowatt hours.
The configuration municipal bus rapid transit procurement requires for accessibility, and the specification of all 38 Volvo units ordered by the City of Cape Town. Low floor architecture constrains battery packaging, which is part of why the Volvo specification reaches 630 kilowatt hours across seven separate packs.
Smaller vehicles serving feeder routes and lower-density corridors, effectively absent from the 608-unit committed fleet despite representing a substantial share of South African passenger transport. Lower energy requirements per vehicle would reduce the 60 kW per bus depot grid ratio that constrains standard bus deployments.
The layer attracting most attention and roughly the smaller part of a transaction priced at USD 333,333 to USD 341,530 per bus including infrastructure. Three suppliers account for all committed volume, and none holds a position secure enough to be described as established across more than one customer.
The practical localisation route, demonstrated by Gauteng Bus and Coach Centre bodying 38 Volvo chassis in Johannesburg for delivery from 2027. It captures domestic value and employment at a scale a 3,200-unit six-year market can support, which full chassis manufacturing cannot.
The layer that determines whether contracted buses become operating buses, exemplified by Arrowgate's 60 direct-current charging stations and a grid uplift from 1 MW to 6 MW. At roughly 60 kW per bus, the 2031 forecast implies approximately 192 MW of national depot grid capacity, which is a larger undertaking than the vehicle procurement it enables.
Charge scheduling, energy management, telematics and maintenance capability determine whether a depot can turn 100 buses in about 90 minutes as Arrowgate is designed to do. This layer is where the operating dataset of just under four million kilometres converts into competitive advantage, and it is the least contested part of the value chain today.
By Geography
Gauteng and the Industrial Heartland
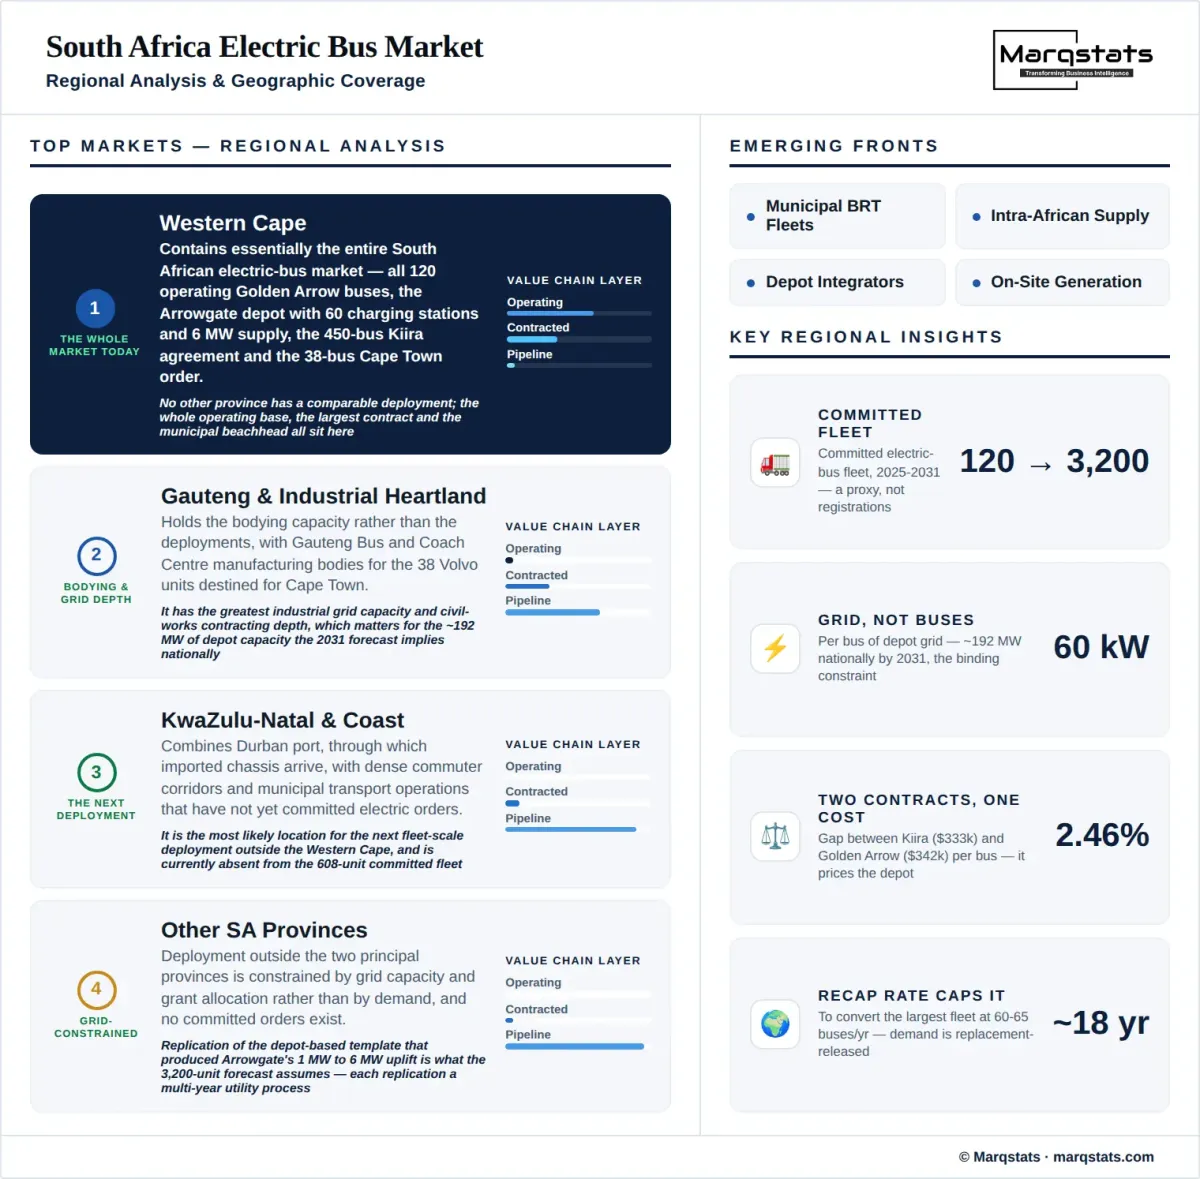
Gauteng holds the bodying capacity rather than the deployments, with Gauteng Bus and Coach Centre in Johannesburg manufacturing bodies for the 38 Volvo units destined for Cape Town. It is also where industrial grid capacity and civil works contracting depth are greatest, which matters for the roughly 192 MW of depot capacity the 2031 forecast implies nationally.
Western Cape
The Western Cape contains essentially the entire South African electric bus market today, including all 120 operating Golden Arrow buses, the Arrowgate depot with its 60 charging stations and 6 MW supply, the 450-bus Kiira agreement and the 38-bus City of Cape Town order. No other province has a comparable deployment.
KwaZulu-Natal and the Coastal Corridor
KwaZulu-Natal combines Durban port, through which imported chassis arrive, with dense commuter corridors and municipal transport operations that have not yet committed electric orders. It is the most likely location for the next fleet-scale deployment outside the Western Cape and is currently absent from the 608-unit committed fleet.
Other South African Provinces
Deployment outside the two principal provinces is constrained by grid capacity and grant allocation rather than by demand, and no committed orders exist. Replication of the depot-based template that produced Arrowgate's 1 MW to 6 MW uplift is what the 3,200-unit 2031 forecast assumes, and each replication is a multi-year utility process.
How Competition Is Evolving
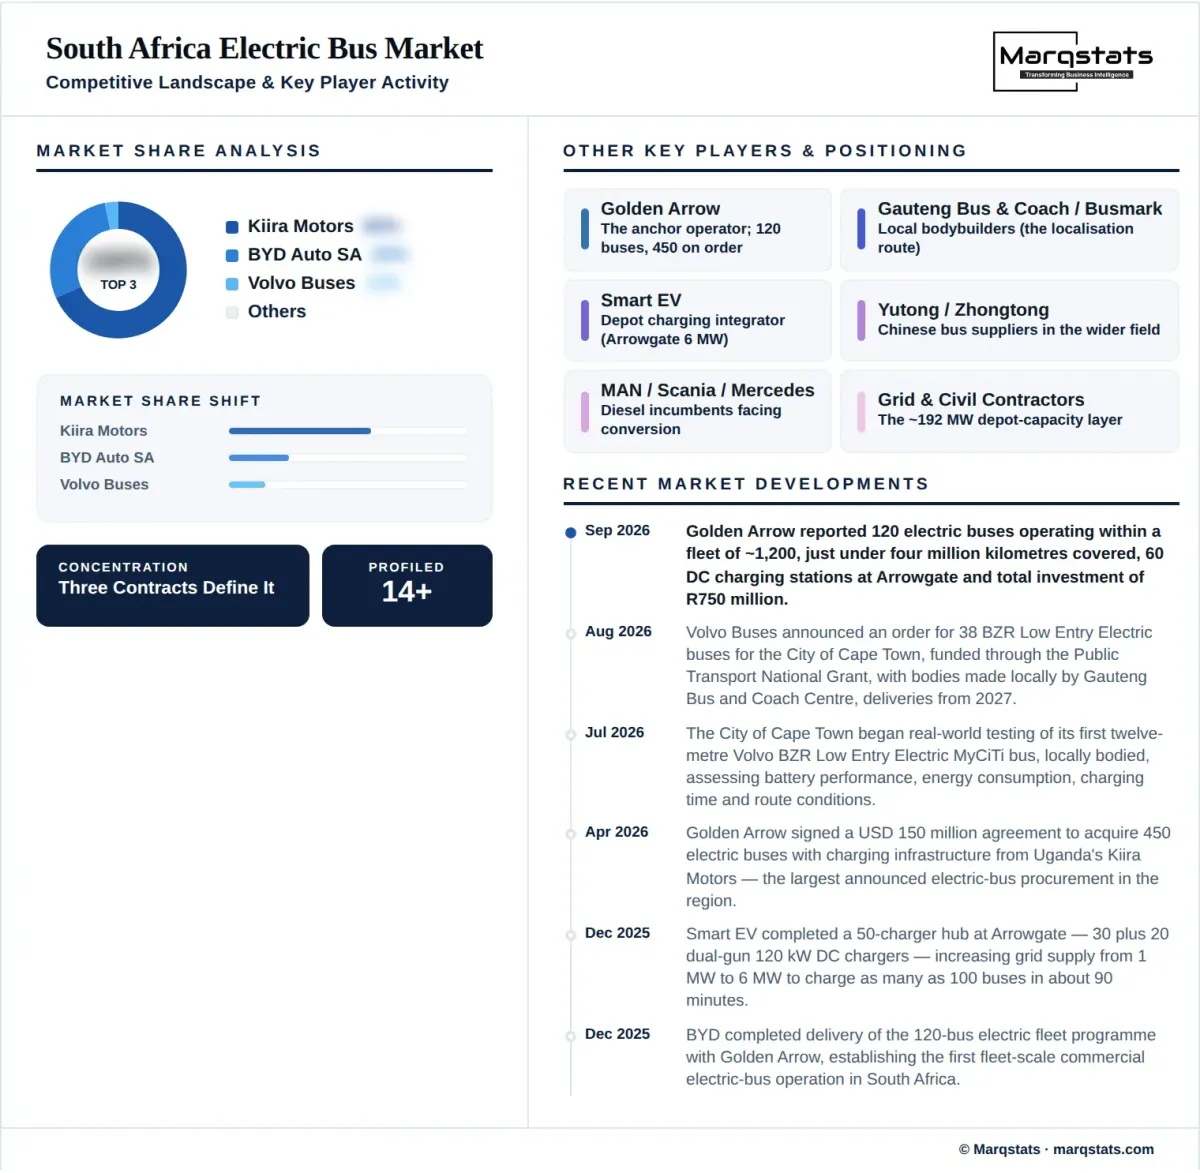
This is a market of three transactions and three entry strategies being tested at once. BYD holds operating incumbency through 120 delivered buses at Golden Arrow and just under four million kilometres of accumulated data. Volvo holds the municipal beachhead through 38 BZR Low Entry Electric units for Cape Town with local bodying. Kiira Motors holds the largest single contract at 450 buses.
None of those positions is yet secure across more than one customer. A supplier with one anchor account in a market whose committed fleet totals 608 units has demonstrated capability rather than established share, and the next two or three procurement decisions will determine the structure far more than the existing three have.
The operating dataset is currently the most valuable competitive asset in the market. Just under four million kilometres of South African duty-cycle evidence, energy consumption near 0.99 kilowatt hours per kilometre and demonstrated depot throughput answer the questions a municipal business case must address, and they cannot be acquired except by operating.
The ecosystem layer competes on different terms and may capture more durable value. Smart EV delivered the Arrowgate charging hub, Gauteng Bus and Coach Centre bodies the Volvo chassis, and civil works, grid upgrade, telematics and depot management suppliers participate in every transaction regardless of which vehicle manufacturer wins it.
For an investor, the decisive question is whether a position is buyer-specific or capability-specific. Vehicle supply in this market is won account by account against concentrated buyers with long replacement cycles; charging, bodying and depot capability are won once and reused across every subsequent deployment, which is a materially better shape of revenue in a market this concentrated.
Companies Covered
The report profiles 14+ companies with full strategy and financials analysis, including:
Recent Market Activity
Table of Contents
Coverage & Segmentation
This study measures the operating plus firmly contracted electric bus fleet in South Africa from 2021 to 2031, with 2025 as the base year and 2026 to 2031 as the forecast period. The proxy is used instead of annual registrations because delivery schedules span multiple years and procurement quantities differ from deliveries in any given year, and announced but unfunded intentions are excluded entirely.
Coverage spans three operator types, three supplier origins, three deployment stages, three bus classes and four value chain layers, alongside four provincial clusters analysed on deployment concentration, bodying capacity and grid conditions rather than quantified share. Fleet capital value is carried as a reference series in USD at a constant ZAR 18.30 conversion, on a per-bus convention derived from two independently reported contract values. Fourteen entities are profiled across operators, vehicle suppliers, bodybuilders and infrastructure providers.