Market Snapshot
Middle bar: base-year value × (1 + CAGR), rounded to two decimals. This is a calculated illustration, not a separately researched annual estimate.
Market Size (2025, Base Year): USD 4.18 Billion (RUB 347.8 Billion)
Estimated Value (2026): USD 4.02 Billion (RUB 370.5 Billion)
Forecast Value (2030, Baseline Scenario): USD 4.61 Billion (RUB 438.0 Billion)
CAGR (Value, USD): 1.98% | Forecast Period: 2026 – 2030
Physical Volume: 473.40 Million Litres (2025) to 485.00 Million Litres (2030, Baseline), Volume CAGR 0.48%
Largest Market: National (No Regional Split Published)
Fastest Growing: Fully Synthetic Formulations (49.5% to 52.5% share, 2024-2026e)
Dominant Segment: Passenger Car Motor Oil (48.5% of 2025 volume)
Market Concentration: Moderately Concentrated (Top 3 Majors Hold ~45%)
Base Year: 2025 | Historical Period: 2021 – 2025 | Forecast Period: 2026 – 2030
Units Considered: Value (USD Billion)
Segments Covered: 2 | Regions Covered: 1 | Companies Profiled: 8
Report Pages: 165 | Deliverables: PDF, Excel, PPT
Key Takeaways
Market Overview & Analysis
Report Summary
Russia's lubricants aftermarket has finished absorbing the 2022 exit of Western oil majors and additive suppliers and has moved into a new phase: a state-mandated digital tracking regime that will let point-of-sale systems reject an unverified bottle of oil by late 2026, layered onto a fleet that keeps aging and a truck market being reshaped by Chinese brands.
The analysis measures the value of engine oils, driveline fluids and hydraulic fluids bought for aftermarket servicing and retail top-up: RUB 347.8 billion (USD 4.18 billion) in 2025. It excludes industrial, marine and non-automotive process oils.
The analysis is written for four readers: a domestic blender deciding how fast to scale synthetic base-stock capacity, a distributor planning for Chestny ZNAK compliance costs, an importer weighing whether parallel-import premiums are still commercially viable, and an investor tracking three forward scenarios.
Russia's scale as a Eurasian regional fluid market, combined with its near-total pivot to domestic supply since 2022, makes this aftermarket a useful bellwether for how quickly a major lubricants market can rebuild a fully localized additive and base-oil supply chain under sustained external pressure.
A Tracking Mandate That Will Let a Cash Register Refuse to Sell Oil
Most counterfeit-suppression regulation relies on after-the-fact enforcement. Russia's is being built to prevent the sale from completing at all.
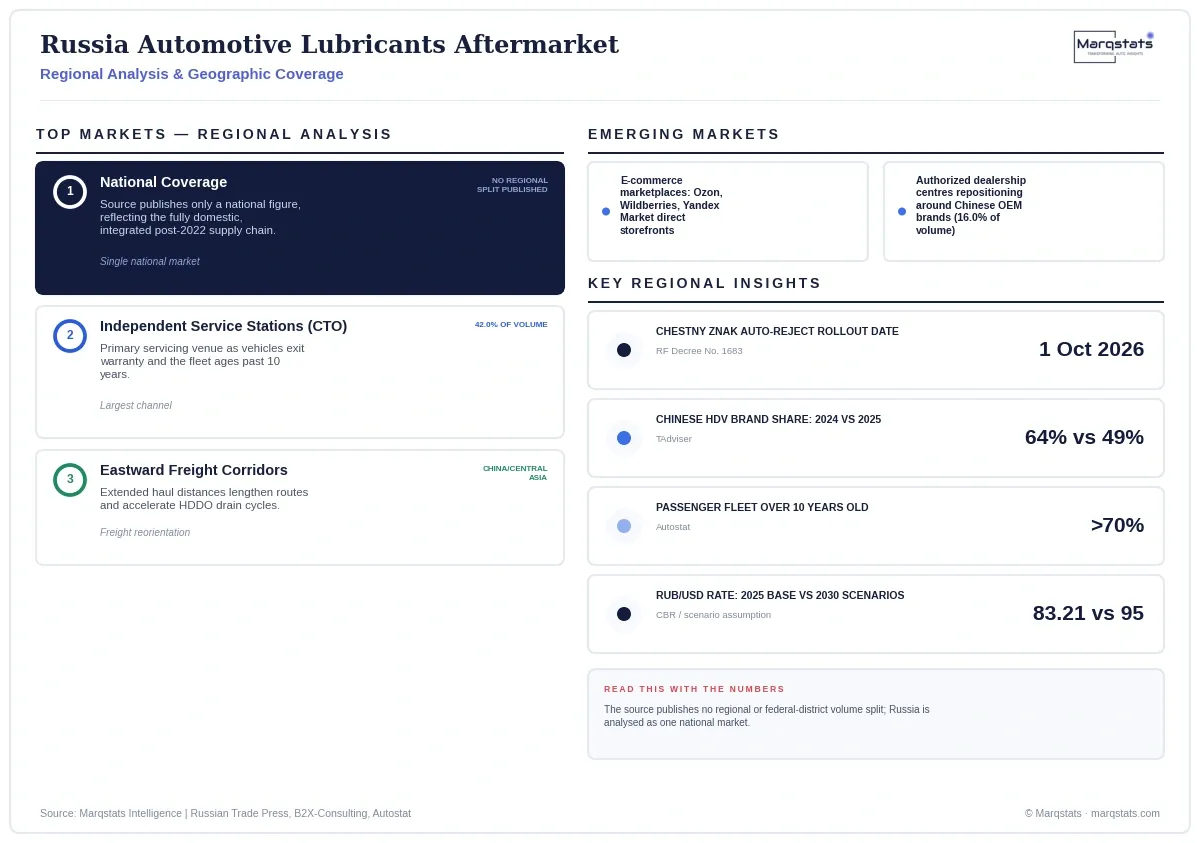
Under RF Government Decrees No. 1683 and No. 2136, every container of automotive lubricant, from a 1-litre retail bottle to a 200-litre bulk drum, must carry a scannable Data Matrix code registered in the national Chestny ZNAK system. The rollout is phased with hard deadlines: entity registration by 1 March 2025, code application to every container by 1 September 2025, and a full ban on unmarked product in commercial circulation by 1 December 2025. By 1 October 2026, point-of-sale systems enter a 'permissive regime' where they automatically query the national registry and reject any code that is missing, duplicated, or unverified, before the sale can complete. The rules even distinguish transaction type: a workshop selling a sealed canister to a customer scans it at the register, while oil dispensed directly into an engine during a service is instead logged through the workshop's own enterprise portal as a consumable, not a retail sale. Fines for non-compliance reach RUB 300,000, with product confiscation.
Smaller Distributors Are Being Priced Out by Compliance Itself
A regulation aimed at counterfeiters is also reshaping who can afford to stay in wholesale distribution at all.
Compliance with Chestny ZNAK requires 2D scanning hardware, modernized warehouse management software, and universal electronic invoicing, capital and systems investments that smaller regional distributors are struggling to fund. The pack describes these smaller players exiting the sector outright, concentrating wholesale distribution into major national automotive parts providers. A regulation designed to close the door on parallel-import counterfeiters is, as a side effect, also closing the door on the smallest legitimate wholesalers.
Chinese Trucks Took Two-Thirds of the Market, Then Gave Some Back
New heavy-truck brand share in Russia swung sharply in both directions within a single year, and the swing matters for which fluid specifications blenders need to stock.
Chinese commercial truck brands, led by Sitrak, Shacman and FAW, captured 64% of heavy-commercial-vehicle segment sales value in 2024. In 2025 that share fell to 49% (RUB 277.6 billion) as domestic manufacturer KAMAZ recovered to 41% of segment value (RUB 230.6 billion). Neither figure is small, and the swing means blenders must keep supplying both fluid families at scale: Chinese platforms typically specify low-viscosity, low-SAPS synthetic formulations aligned with newer emissions architecture, while KAMAZ and other domestic heavy trucks continue to run on more conventional high-viscosity HDDO grades.
A Fleet Split Between Two Very Different Viscosity Worlds
Russia's vehicle parc is aging and modernizing at the same time, in different vehicles, and that split is dictating a genuinely bifurcated product strategy.
More than 70% of the passenger fleet is older than 10 years, and the average domestic-nameplate vehicle is 18.7 years old. These vehicles develop wider mechanical clearances and elevated oil consumption, sustaining continuous top-up demand largely independent of economic cycles, and typically call for higher-viscosity 10W-40 and 15W-40 grades. At the same new-vehicle boundary, Chinese passenger platforms, Haval, Geely, Chery and Changan among them, have expanded to over 5% of the operating passenger fleet and specify ultra-low-viscosity 0W-20 formulations engineered against low-speed pre-ignition. Blenders are formulating for both ends of this spread simultaneously, not transitioning from one to the other.
What the Ruble Assumption Does to the Growth Number
The same market can report two very different growth rates depending on which currency does the counting, and the gap here is unusually wide.
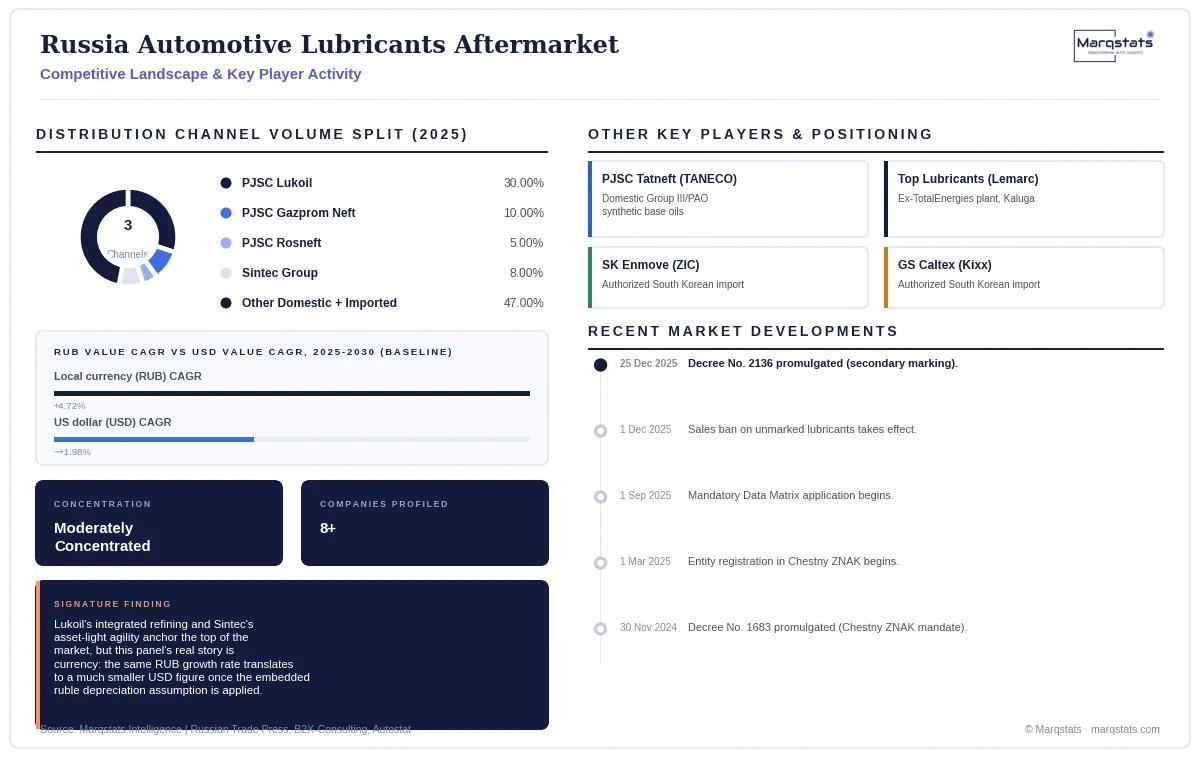
In local-currency terms, Baseline value grows 4.72% a year, from RUB 347.8 billion to RUB 438.0 billion by 2030. But the underlying USD conversion embeds a meaningful assumption: 2025 converts at 83.21 RUB per dollar, while the 2030 scenario figures convert at an assumed 95 RUB per dollar, a material ruble depreciation over the forecast window. Recomputing the same RUB growth at each year's own implied rate yields a USD CAGR closer to 2% a year, not the higher local-currency figure. The precise path of the ruble between 2025 and 2030 is not confirmed in the source data, so this USD figure should be read as one plausible translation, not a forecast in its own right.
Two Business Models Competing for the Same Independent Workshop
Russia's largest lubricant sellers reach the independent workshop channel through opposite structural paths, and both are scaling at once.
PJSC Lukoil built its position through vertical integration: it refines its own crude, blends at company-owned plants including the acquired ex-Shell Torzhok facility, whose nameplate capacity it expanded from 160,000 to 240,000 metric tons a year, and distributes through its own retail fuel-station network under the Lukoil Genesis and Teboil brands. Sintec Group, by contrast, holds no upstream refining assets at all. It wins the independent workshop and digital marketplace channel through agile procurement, aggressive digital marketing, and a multi-brand portfolio, Sintec, Rolf, Takayama and Mirax, that covers every price tier from premium to budget under one blending operation in the Kaluga region. An integrated major and an asset-light independent blender are both gaining share in the same channel, through opposite playbooks.
Where the Departed Western Additive Suppliers Have Been Replaced
A single supply-chain choke point explains much of what changed in Russian lubricant formulation after 2022, more than the departure of the finished-oil brands themselves.
Before 2022, more than 85% of high-tier automotive engine oils blended in Russia used additive chemistry supplied by the Western 'Big Four': Lubrizol, Infineum, Afton Chemical and Chevron Oronite. Their suspension of direct shipments was arguably a bigger structural shock than the exit of Shell, BP/Castrol, TotalEnergies and ExxonMobil as finished-product brands, because additive packages, not base oil, determine whether a formulation actually meets a modern API or ACEA specification. Russian blenders redirected procurement toward Chinese suppliers, principally Xinxiang Richful Lube Additive and Kangtai (Betchem), for detergent-inhibitor packages, ZDDP, and viscosity index improvers, while domestic institutions including VNII NP and Lukoil's and Gazprom Neft's own R&D subsidiaries built out parallel domestic synthesis capacity. Because formal API licensing and OEM approvals (Mercedes-Benz, Volkswagen, BMW) are no longer granted to Russian blenders at all, products are now validated instead through bench-engine dynamometer testing and fleet trials run by the domestic certification body MIC GSM, and marketed on that certification rather than an international OEM approval mark.
Sump Size Is Quietly Reshaping Retail Packaging
A market's packaging strategy can be dictated by something as mundane as crankcase capacity, and Russia's retail lubricant shelf shows exactly that.
Roughly 27% of passenger cars in Russia carry crankcase capacities around 5.0 litres, a figure that falls awkwardly between the two standard retail formats: a 4-litre canister leaves the job unfinished, forcing the buyer to purchase a second, smaller 1-litre bottle alongside it, while a genuinely matched 5-litre format has only recently reached wide retail availability. Light commercial vehicles show the same mismatch one size up: standard factory sump capacities of 6.0 to 6.5 litres have prompted domestic blenders to introduce dedicated 7-litre canisters specifically to eliminate the multi-canister purchase. Heavy commercial vehicles, with sump capacities of 20 to 35 litres, skip retail packaging altogether and procure through bulk drums and pails. None of this is cosmetic: getting container sizing wrong for the dominant sump capacity in a fleet segment either strands margin in an underfilled second purchase or pushes a buyer toward a competitor's better-matched format.
A Regulatory Regime With No International Precedent Check
Because Russian blenders can no longer obtain formal API licensing or OEM approvals from Mercedes-Benz, Volkswagen or BMW, the market has effectively built its own closed certification loop, and that has implications well beyond formulation chemistry.
Bench-engine dynamometer evaluation and fleet validation trials run through MIC GSM, alongside certifications from domestic and Eurasian manufacturers such as AVTOVAZ, UAZ, KAMAZ and GAZ, now stand in for the international approval marks a buyer would once have looked for on a bottle. For a blender, this changes what counts as proof of quality: domestic fleet trial data and MIC GSM sign-off carry the commercial weight that an ACEA or API license used to. For an importer or exporter trying to sell into Russia, it means an international specification claim alone is no longer sufficient market access, domestic certification is now the operative gate.
A Digital Retail Channel That Favours the Blender Over the Middleman
E-commerce growth in most lubricant markets favours whichever retailer stocks the widest range. In Russia it is favouring the manufacturers themselves.
Major domestic blenders operate direct storefronts on Ozon and Wildberries, letting consumers buy straight from the producer rather than through a regional wholesale markup. This has two effects at once: it compresses the margin regional distributors used to earn as an intermediary, and it reassures buyers worried about counterfeit product, since a purchase made directly from a verified manufacturer storefront carries less of the packaging-fraud risk associated with open-air markets and unorganized retail. As Data Matrix serialization verification integrates directly into these digital transaction records, the manufacturer storefront becomes not just a cheaper channel but a more trustworthy one, at the direct expense of the traditional wholesale layer.
Market Dynamics
Key Drivers
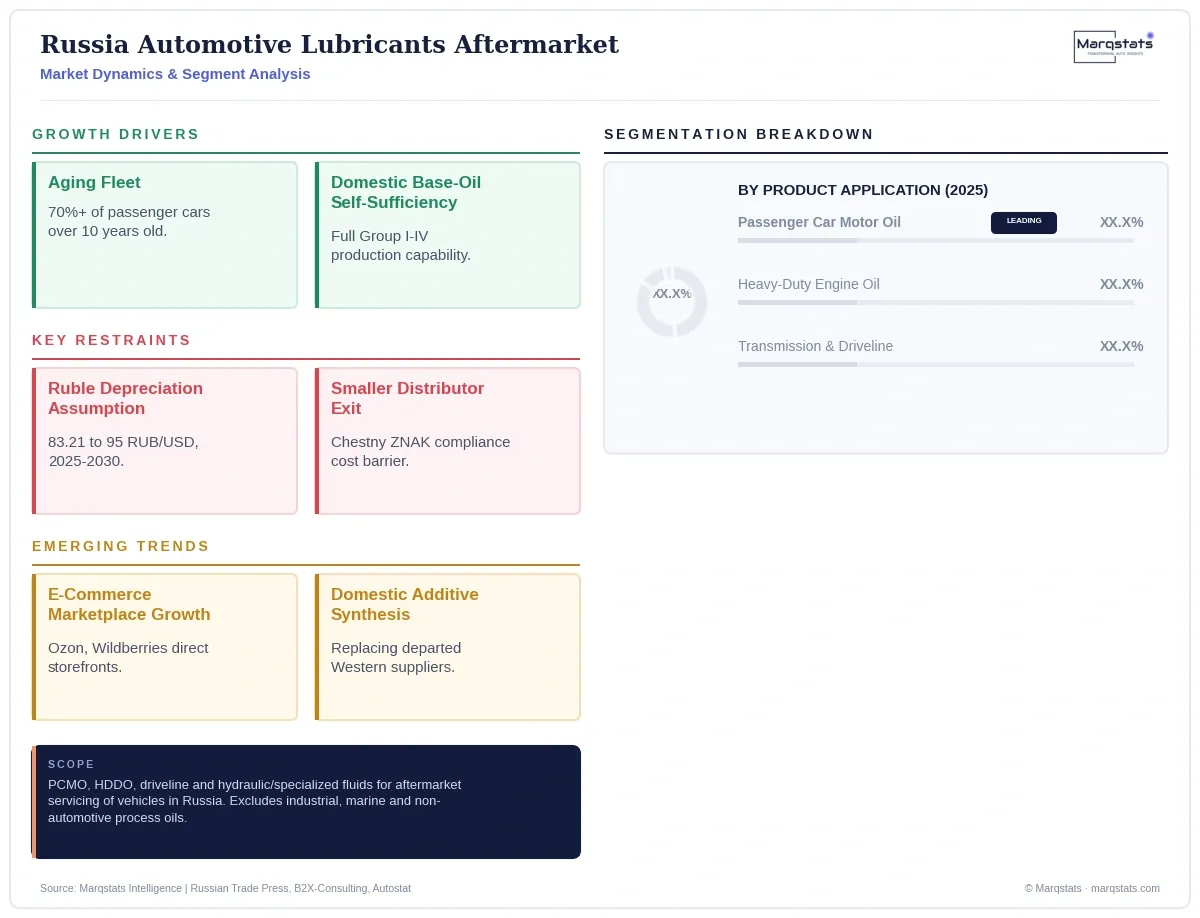
- An aging fleet, over 70% past 10 years old, sustains continuous top-up demand largely independent of new-vehicle sales cycles.
- Full domestic base-oil self-sufficiency, including Group III VHVI and PAO synthetic production at TANECO, Volgograd and Omsk, supports rapid synthetic-formulation growth.
- Chestny ZNAK compliance is consolidating wholesale distribution into larger, better-capitalized national players able to absorb the digital tracking investment.
- Expanding Chinese vehicle platforms, in both passenger and heavy-commercial segments, are driving demand for ultra-low-viscosity, low-SAPS synthetic formulations.
- Extended eastward freight corridors toward China and Central Asia lengthen average haul distances, accelerating heavy-duty diesel oil drain cycles.
Key Restraints
- A material assumed ruble depreciation between the 2025 base year and the 2030 forecast moderates the market's growth rate when measured in US dollars rather than local currency.
- Smaller regional distributors unable to fund Chestny ZNAK compliance hardware and software are exiting the sector, concentrating channel access.
- Ongoing technological transition in additive chemistry, away from the departed Western 'Big Four' suppliers toward Chinese chemical manufacturers, introduces short-term formulation and performance-validation risk.
- Potential broadened secondary sanctions on intermediate chemical components represent a downside risk to continued additive localization, per the Downside scenario.
Key Trends
- E-commerce marketplaces (Ozon, Wildberries, Yandex Market) are the fastest-growing distribution channel, with online commercial-vehicle lubricant sales share rising from 11.4% to 17.0%.
- Domestic additive synthesis programs, led by VNII NP and Lukoil and Gazprom Neft R&D subsidiaries, are expanding to reduce dependency on Chinese additive imports.
- Digital lubricant-selection and fluid-matching tools, deployed by Gazprom Neft among others, are becoming a competitive differentiator in consumer retention.
- Container formats are being redesigned around real-world sump sizes: 5-litre passenger car bottles and 7-litre commercial canisters, reducing multi-canister purchasing friction.
Strategic Implications
- Domestic integrated majors should direct capital toward synthetic base stocks (PAO, alkylated naphthalenes, synthetic esters) to protect refining margins as commodity blending compresses, and should expand retail-network and digital fluid-matching tools to defend share against agile independents.
- Independent blenders should maintain diversified additive sourcing across multiple international suppliers and continue leveraging direct e-commerce sales models to bypass regional wholesale markups.
- Asian exporters should integrate export pipelines with Chestny ZNAK pre-labeling requirements at bonded logistics hubs, and should formulate products bridging European OEM and Chinese automaker specifications.
- Independent workshops should complete Electronic Document Flow integration ahead of the 1 April 2026 deadline and prioritize bulk 200-litre synthetic 5W-30/5W-40 stocking to protect service margins.
- Investors evaluating this market in US dollars should model the ruble-depreciation assumption explicitly rather than relying on the higher local-currency growth figure alone, since the gap between the two measures is wide enough to change the commercial case for entry or expansion on its own.
Outlook
The underlying research presents three scenarios tied to sanctions, trade-corridor and fleet-renewal conditions. Value CAGRs below are stated in US dollars (USD); the 2030 figures convert at an assumed 95 RUB/USD against 83.21 RUB/USD for the 2025 base year, a material embedded ruble-depreciation assumption disclosed in the Analytical Deep-Dive section above.
Under the Downside scenario (High Friction), broadened secondary sanctions restrict intermediate chemical components, domestic additive scaling faces technical delays, and high inflation limits fleet renewal. Volume reaches 460.0 million litres and value reaches RUB 395.0 billion (about USD 4.15 billion at 95 RUB/USD), a -0.14% USD-value CAGR.
Under the Baseline scenario (Steady Localization), Chinese trade corridors continue, domestic Group III refining stays at steady uptime, and the fleet expands gradually. Volume reaches 485.0 million litres and value reaches RUB 438.0 billion (about USD 4.61 billion), a 1.98% USD-value CAGR.
Under the Upside scenario (Accelerated Renewal), fleet modernization accelerates via domestic and Chinese platforms, additive packages fully localize, and counterfeit trade is eliminated. Volume reaches 510.0 million litres and value reaches RUB 465.0 billion (about USD 4.89 billion), a 3.19% USD-value CAGR. Synthetic formulation share ranges from 52.5% in the Downside scenario framing to 65.0% under Accelerated Renewal.
Market Segmentation
48.5% of 2025 volume, moving to 48.8% by 2026e. Sustained by personal vehicle reliance and cold-start requirements in continental climates.
36.0% of 2025 volume, moving to 35.8% by 2026e. Supported by the eastward shift in freight logistics toward Chinese and Central Asian corridors, extending routes and drain cycles.
12.0% of 2025 volume, moving to 12.1% by 2026e. Automatic, dual-clutch and CVT fluids achieving higher value growth through complex friction-modifier chemistry.
3.5% of 2025 volume, moving to 3.3% by 2026e. Commercial auxiliary systems and power steering units.
49.5% of 2024 volume, moving to 52.5% by 2026e.
36.0% of 2024 volume, moving to 34.0% by 2026e.
14.5% of 2024 volume, moving to 13.5% by 2026e.
By Geography
National Coverage
The source publishes no regional or federal-district volume split; Russia is analysed as a single national market, reflecting the fully domestic, integrated nature of the post-2022 supply chain.
Distribution Channel Split
Independent service stations (СТО) account for 42.0% of aftermarket volume, authorized dealership service centres (ДЦ) 16.0%, and direct retail (fuel stations, auto parts retailers, e-commerce) 42.0%.
Eastward Freight Reorientation
National freight logistics have shifted toward Chinese and Central Asian corridors, extending average transport routes and accelerating heavy-duty lubricant drain cycles.
How Competition Is Evolving
Domestic producers control more than 80% of total consumption. The top three vertically integrated oil majors, PJSC Lukoil, PJSC Gazprom Neft and PJSC Rosneft, hold a combined motor oil market share of approximately 45%.
PJSC Lukoil (LLK-International) leads with approximately 30% of total Russian finished lubricant production, operating blending assets in Perm, Volgograd, Tyumen and Torzhok, the latter an acquired ex-Shell facility whose nameplate capacity Lukoil expanded from 160,000 to 240,000 metric tons a year to scale its premium Teboil brand.
PJSC Gazprom Neft (Gazpromneft-SM) operates the Omsk and Moscow (Fryazino) lubricants plants under the Gazpromneft and G-Energy brands, deploying digital lubricant-selection tools to match viscosity to duty cycle and climate. PJSC Rosneft (RN-Lubricants) supplies state transport fleets and commercial freight operators from Novokuibyshevsk, Angarsk and Ryazan under the Rosneft Magnum and Revolux lines.
Sintec Group, the leading independent domestic blender, operates from its Obninsk complex in the Kaluga region, supplying the Sintec, Rolf, Takayama and Mirax brands primarily to independent workshops and digital marketplaces. PJSC Tatneft (TANECO) is the key domestic merchant producer of Group III VHVI and Group IV PAO synthetic base oils. Top Lubricants (Lemarc) operates a former TotalEnergies plant in the Kaluga region producing high-tier synthetic formulations.
Imported product retains a specialized footprint: South Korean blenders SK Enmove (ZIC) and GS Caltex (Kixx) hold authorized distribution channels, while parallel-imported Western brands (Mobil 1, Castrol, Shell Helix) have contracted to roughly 6% of aftermarket volume, carrying retail premiums of 80% to 120% over domestic synthetic equivalents.
Companies Covered
Companies covered in the report include:
Recent Market Activity
Table of Contents
Coverage & Segmentation
The analysis measures passenger car motor oils, heavy-duty diesel engine oils, transmission and driveline fluids, and hydraulic and specialized automotive fluids bought for aftermarket servicing and retail top-up of vehicles in Russia, for a 2025 base year and a 2026 to 2030 forecast, in United States dollars and Russian rubles. Values are converted at the official Central Bank of the Russian Federation average rate for the relevant year. Industrial, marine and non-automotive process oils are excluded.
The analysis covers two segmentation dimensions, product application and base-stock formulation, and eight profiled entities. The volumetric consumption series carries a partial sourcing flag; see the verification log. Company market shares carry no such flag.