Market Snapshot
Key Takeaways
Market Overview & Analysis
Report Summary
Kenya's electric bus market is not a procurement story and treating it as one produces the wrong forecast. Unlike the Gulf or Europe, where state buyers and purchase mandates set volumes, Kenyan deployment runs through private matatu operators, transport cooperatives, schools and corporate fleets, each financing its own vehicles. The question is not whether a government will order buses but whether an operator can afford one and charge it.
The measure is new battery-electric buses deployed or registered in Kenya for public transport, school, institutional and private fleet use, counted as annual flow rather than cumulative stock. Two adjacent series are carried as named dimensions rather than merged into the headline: electric vans and matatus, which share the same assembly lines, charging depots and financing programmes, and commercial DC fast-charging points, which determine whether either vehicle class can operate.
The analysis is written for bus manufacturers and assemblers assessing entry into an operator-led market, transport operators and cooperatives modelling total cost of ownership against diesel, financiers structuring asset finance against fleet cash flow, and charging and energy operators sizing depot and corridor demand. It treats financing conversion and charging availability, not vehicle supply, as the variables that decide deployment.
Kenya Electric Bus Market Size and Forecast
Electric bus deliveries are estimated at 55 units in 2025, rising to approximately 145 in 2026 and 820 by 2031, an increase of 765 units a year across the window. Market value moves from USD 9.35 million to USD 114.80 million on a per-bus convention falling from about USD 170,000 to USD 140,000. The model triangulates operator deployment milestones, local assembly ramp, reservation pipelines and disclosed institutional orders.
Two growth rates apply and both are published. The six-year unit rate connecting 2025 and 2031 is 56.88%. The five-year rate connecting 2026 and 2031 is 41.41%, and the 15.47-point gap is the widest in this programme. The cause is a documented 2026 capacity event rather than a demand shift: local assembly of more than 20 buses a month began during the year, taking deliveries from 55 to roughly 145.
Value compounds behind units at 51.89% against 56.88%, a 4.99-point inversion, which is the second time in this session a reference series has run below its panel and the mechanism is the same. Local assembly reduces import friction, duty exposure and freight, so the per-bus convention falls 17.65% across the forecast rather than rising with specification.
Confidence is graded low and the reason is the base rather than the method. A market delivering 55 units in its base year carries high year-to-year volatility, a single fleet order can move annual volume by tens of percent, and the difference between a reservation, a financed commitment and a delivered bus is large enough to change the panel materially.
The cumulative fleet matters more commercially than the annual flow and is carried separately. On this path roughly 2,450 buses are delivered across the 2026 to 2031 window, which means the widely cited ambition of 1,000 electric buses on Kenyan roads is reached around 2029 rather than at the end of the forecast.
Reservations Are Not Deliveries
Every published figure in this market is a pipeline number and almost none is a delivery number, which is the single most common error in analysis of Kenyan e-mobility. The correction available is specific: one operator reserved 68 electric buses and had received fewer than 30 by early 2026, a conversion of at most 44.12%.
That ratio should be applied to every other pipeline figure on this page rather than treated as an isolated disappointment. A reservation pipeline exceeding 500 electric vans, a financing programme covering 1,000 vans and an assembly ambition of 1,000 buses are all commitments rather than deliveries, and each faces the same financing approval, charging readiness and production sequencing that produced the 44.12% figure.
The gap is not evidence of weak demand and reading it that way misses the mechanism. Reservations convert slowly because an operator must secure financing, arrange depot charging and schedule the vehicle into a route before taking delivery, and any one of those can delay a unit by quarters without cancelling it.
The commercial implication is that conversion capability, not order book, distinguishes participants. A supplier that can finance, charge and deliver a bus within an operator's decision cycle converts pipeline faster than one selling a better vehicle, which is why the leading platform bundles vehicle, battery, charging and service rather than selling buses.
Local Assembly Is the Economic Event
The most consequential development in this market is industrial rather than commercial. A partnership between Kenya's leading electric bus platform, a Chinese bus manufacturer and a Kenyan vehicle assembler brought the KL-9 electric city bus into local assembly, with announced production of more than 20 units a month during 2026.
Twenty units a month is approximately 240 buses of annual capacity against 145 modelled deployments in 2026, a utilisation of 60.42%. That is the same condition documented across African assembly programmes: capacity arrives ahead of offtake, and the constraint is demand conversion rather than manufacturing capability.
Capacity at the announced rate is also insufficient for the later forecast, which is worth stating plainly. Six years at 240 units a year yields 1,440 buses against roughly 2,450 cumulative deliveries in this forecast, so the 2031 figure requires capacity expansion rather than utilisation improvement alone, and the expansion decision is a function of order conversion rather than of market size.
Local assembly changes the price trajectory as well as the supply chain. Removing import friction, completed-vehicle duty and freight is what allows the per-bus convention to fall from approximately USD 170,000 to USD 140,000 across the forecast, and it is also what creates the service and parts capability that fleet buyers evaluate before price.
The same industrial base serves the absorbed van series. Local assembly of electric vans began at a Mombasa assembler during 2026 with an initial run of 22 locally built units, against a reservation pipeline exceeding 500, which is a ratio of 22.73 reservations for every unit in the first production batch.
Charging Is Growing Slower Than the Fleet It Serves
Commercial DC fast-charging points in Kenya are estimated at 70 in 2025, rising to approximately 120 in 2026 and 520 by 2031, a six-year rate of 39.69% and a 2026 to 2031 rate of 34.08%. Both sit below the vehicle growth rates the network has to serve.
Set the combined vehicle series against it and the divergence is measurable. Buses and vans together account for roughly 325 new units in 2026 and 3,020 by 2031, a 56.18% rate over the same window, which means new commercial electric vehicles per fast-charge point rise from 2.71 to 5.81, an increase of 2.14 times.
Depot capacity is where the constraint currently binds rather than corridor coverage. Nairobi depots operating DC fast chargers up to 160 kW can sequentially support charging of approximately 100 buses a day, which is adequate for today's fleet and would need to multiply many times over to serve the cumulative fleet this forecast implies by 2031.
Corridor charging opened in July 2026 and changes the geography rather than the capacity. A partnership between the bus platform and a fuel retailer opened a first site at Sabaki with further sites scheduled at Meru, Nanyuki and Nyeri, using CCS2 and GB/T 100 kW DC chargers designed for buses, vans, trucks and passenger vehicles, which is what makes intercity electric operation possible at all.
Multi-vehicle utilisation is the bankability mechanism and the reason siting on fuel forecourts works. A corridor charger serving only buses waits between services; one serving buses, vans, trucks and passenger cars on an existing retail site with power, permits and customer habit already in place reaches a utilisation that justifies the connection cost.
Buses Already Dominate Kenya's Metered Charging Load
Kenya Power reported 8.43 million kWh of electric vehicle charging in 2025, up 188.70% from 2.92 million kWh, across 205 e-mobility tariff accounts, with associated revenue of KSh 190.8 million against KSh 64.8 million the previous year.
A single electric bus dwarfs every other vehicle class in energy terms. On a disclosed duty cycle of roughly 250 kilometres a day at about 1.2 kWh per kilometre across 300 operating days, one bus consumes approximately 90,000 kWh a year, so around 70 buses operating in Kenya would consume about 6.30 million kWh, or 74.73% of the entire metered total.
That arithmetic carries two conclusions and both are commercially useful. Electric buses are already the dominant load on Kenya's measured charging network despite numbering in the dozens, and the tens of thousands of electric motorcycles in the country must therefore be charging largely outside the e-mobility tariff, on ordinary domestic and small commercial connections.
Effective pricing is above the headline tariff and a charging operator should model it that way. Metered revenue of KSh 190.8 million against 8.43 million kWh implies roughly KSh 22.63 per kWh, above both the KSh 16 peak and KSh 8 off-peak energy rates, which indicates demand and standing charges that materially change depot economics.
Grid adequacy is a smaller concern here than in most markets. Kenyan electricity is overwhelmingly renewable, and the government has set a target of 10,000 electric vehicle charging stations by 2030, though that target counts all charging points rather than the commercial DC fast-charge connectors modelled here, and the two figures are not comparable.
The Scheduled Service Is a Different Product
The most instructive commercial experiment in this market is small and easy to overlook. A scheduled electric bus service began testing in Nairobi during February 2026 with three buses, drawing around 300 unique riders a week at approximately 80% average occupancy, running fixed non-stop routes between residential estates and commercial districts.
Its pricing tells the real story. Fares of KES 200 between Nyayo Estate and Westlands and KES 150 between Mwiki and Upper Hill sit against a standard diesel matatu fare of KES 80 to 120, which means the service charges roughly two times the incumbent price and sells on a claimed saving of up to 40 minutes per one-way trip.
Ninety per cent of riders are corporate employees, which confirms that this is not matatu replacement. It is a new segment built on time and reliability for passengers who can pay a premium, and it converts the operator from a vehicle supplier into a service operator retaining a share of fare revenue rather than selling an asset once.
The commercial architecture is explicit in the revenue split, with operators retaining 75% and the platform taking 20%. That structure gives the platform recurring revenue tied to utilisation rather than to unit sales, which is a materially different business from selling 820 buses a year and is the model most likely to attract imitation.
Market Dynamics
Key Drivers
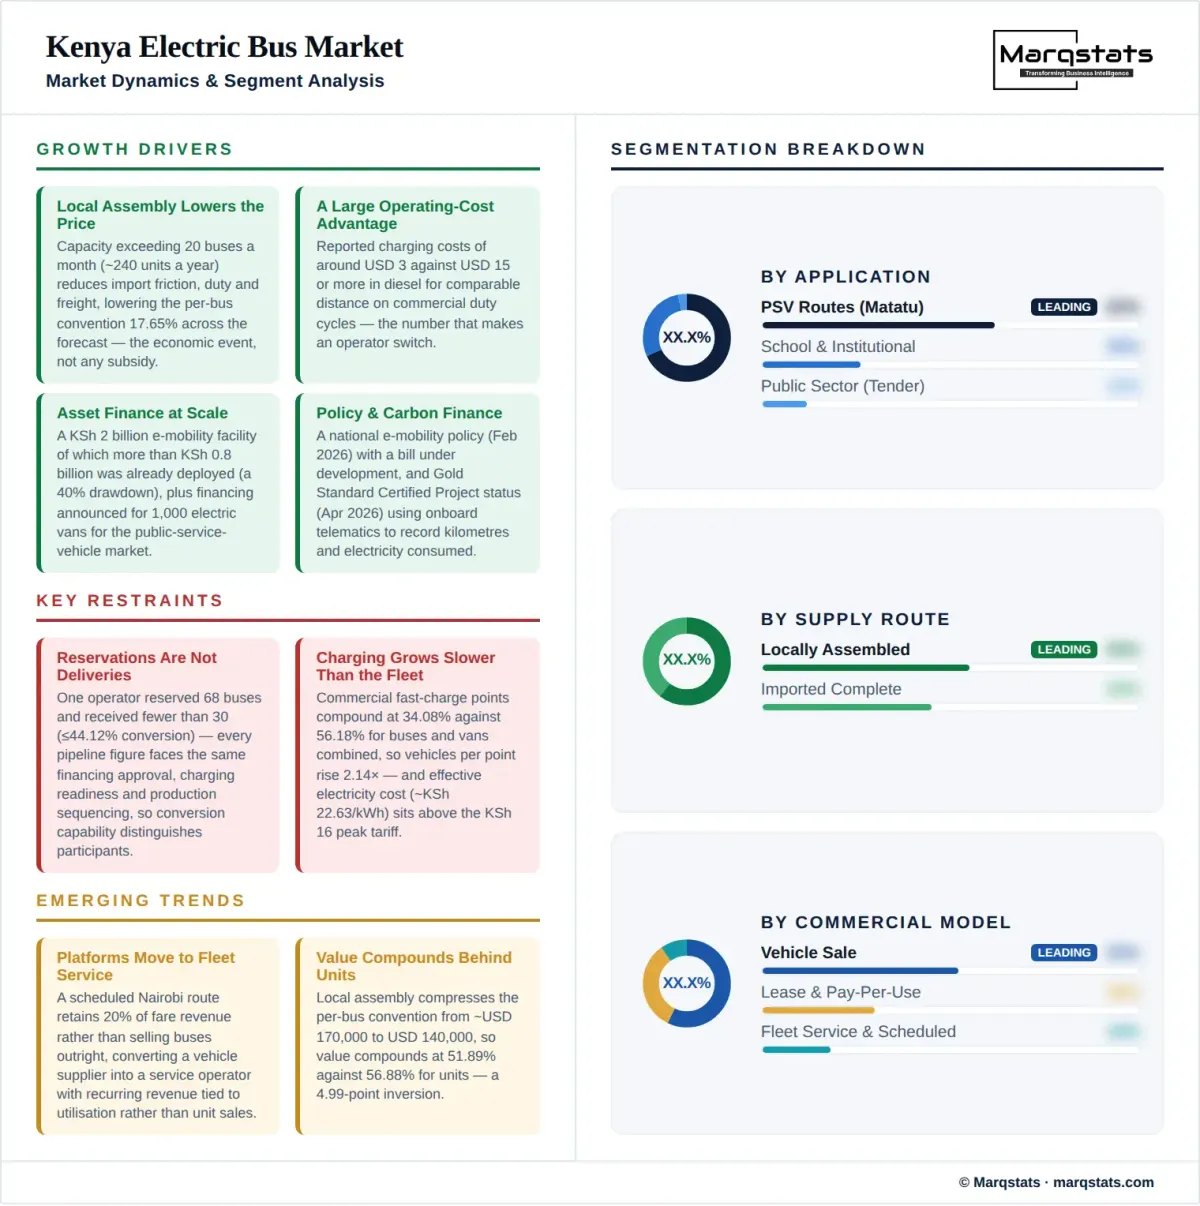
- Local assembly capacity exceeding 20 buses a month, roughly 240 units a year, reducing import friction and lowering the per-bus convention 17.65% across the forecast.
- Operating cost advantage, with reported charging costs of around USD 3 against USD 15 or more in diesel for comparable distance on commercial duty cycles.
- Asset finance at scale, including a KSh 2 billion e-mobility facility of which more than KSh 0.8 billion was already deployed, a drawdown of 40.00%.
- Policy formalisation through a national electric mobility policy launched on 3 February 2026, with an e-mobility bill and implementing regulations under development from August 2026.
- Carbon finance, with the leading platform securing Gold Standard Certified Project status in April 2026 using telematics to record kilometres and electricity consumption.
Key Restraints
- Reservation-to-delivery conversion, demonstrated at most 44.12% where one operator reserved 68 buses and received fewer than 30.
- Charging growing slower than the fleet, with commercial fast-charge points compounding at 34.08% against 56.18% for buses and vans combined.
- A base of 55 units creating extreme year-to-year volatility, where a single fleet order moves annual volume by tens of percent.
- Effective electricity cost above headline tariffs, at roughly KSh 22.63 per kWh implied against a KSh 16 peak energy rate.
Key Trends
- Value compounding behind units at 51.89% against 56.88% as local assembly compresses the per-bus convention from about USD 170,000 to USD 140,000.
- Platforms moving from vehicle sales to fleet service, with a scheduled Nairobi route retaining 20% of fare revenue rather than selling buses outright.
- Corridor charging opening intercity operation, with a first site at Sabaki in July 2026 and three further locations scheduled.
- Institutional fleets entering, with a school programme delivering 11 electric vehicles comprising one bus and 10 vans from March 2026.
Market Segmentation
The core segment and the basis of the 55 to 820 unit panel, covering urban route buses such as the KL-9 now assembled locally at more than 20 units a month. Predictable daily distance and depot return make this the easiest commercial vehicle class to electrify.
Longer-distance operation dependent on the corridor charging network opened in July 2026 at Sabaki with three further sites scheduled. A 320 kilometre vehicle range makes intercity viable only where 100 kW charging exists at the route midpoint.
The absorbed series, growing from approximately 180 units in 2026 to 2,200 by 2031 at 64.98%, covering electric matatus and shuttle vans with up to 300 kilometres of rated range. It outgrows buses and shares the same assembly lines, charging depots and financing programmes.
Matatu and bus routes operated by transport cooperatives, the largest application by units and the one where financing conversion determines deployment. A financing programme covering 1,000 electric vans is aimed squarely at this application and represents more than five years of deliveries at the 2026 rate.
Schools, universities and institutions procuring small mixed fleets, demonstrated by a March 2026 programme delivering 11 electric vehicles comprising one electric school bus and 10 electric vans. Fixed routes, overnight parking and predictable distance make this the lowest-risk application to electrify.
Employer-run and contracted staff transport, and the application behind a scheduled Nairobi service where 90% of riders are corporate employees paying roughly twice the matatu fare. Willingness to pay for time and reliability rather than price is what distinguishes this application.
Public sector and parastatal transport, currently the smallest application in a market delivering 55 units in 2025 and the one most dependent on the implementing regulations being developed from August 2026. Procurement here is tender-led rather than operator-led.
Buses and vans assembled in Kenya from complete knocked-down kits, at an announced rate exceeding 20 buses a month plus an initial run of 22 locally built vans. Local assembly is what allows the per-bus convention to fall 17.65% and builds the service capability fleet buyers evaluate.
Fully built vehicles landed complete, the route that carried the market to its 55-unit 2025 base and the one local assembly is progressively displacing. Imports carry duty, freight and foreign exchange exposure that a locally assembled equivalent partly avoids.
Operator depots running DC fast chargers up to 160 kW, collectively able to sequentially support charging of approximately 100 buses a day in Nairobi. This is where the binding capacity constraint currently sits rather than in corridor coverage.
Highway and intercity sites using CCS2 and GB/T 100 kW DC chargers, beginning with Sabaki in July 2026 and extending to Meru, Nanyuki and Nyeri. Serving buses, vans, trucks and passenger vehicles together is what lifts utilisation to a bankable level.
Lower-power charging at schools, institutions and corporate premises where vehicles stand for long periods, suiting the 11-vehicle institutional fleets and staff shuttles rather than high-utilisation route buses. It requires no fast-charge connector and does not appear in the 520-point commercial forecast.
Cash acquisition by better-capitalised operators, institutions and corporates, a minority route in a market where a bus costs approximately USD 170,000 falling toward USD 140,000. Its share is highest in school and institutional applications.
Bank and platform financing matched to operating cash flow, underpinned by facilities such as a KSh 2 billion e-mobility line with more than KSh 0.8 billion deployed. This is the route that converts the reservation pipelines which otherwise stall at 44.12%.
The platform operates or co-operates the service and retains a share of revenue, demonstrated by a Nairobi route where operators keep 75% and the platform takes 20%. It converts a one-off vehicle sale into recurring revenue tied to utilisation.
By Geography
Nairobi Metropolitan Area
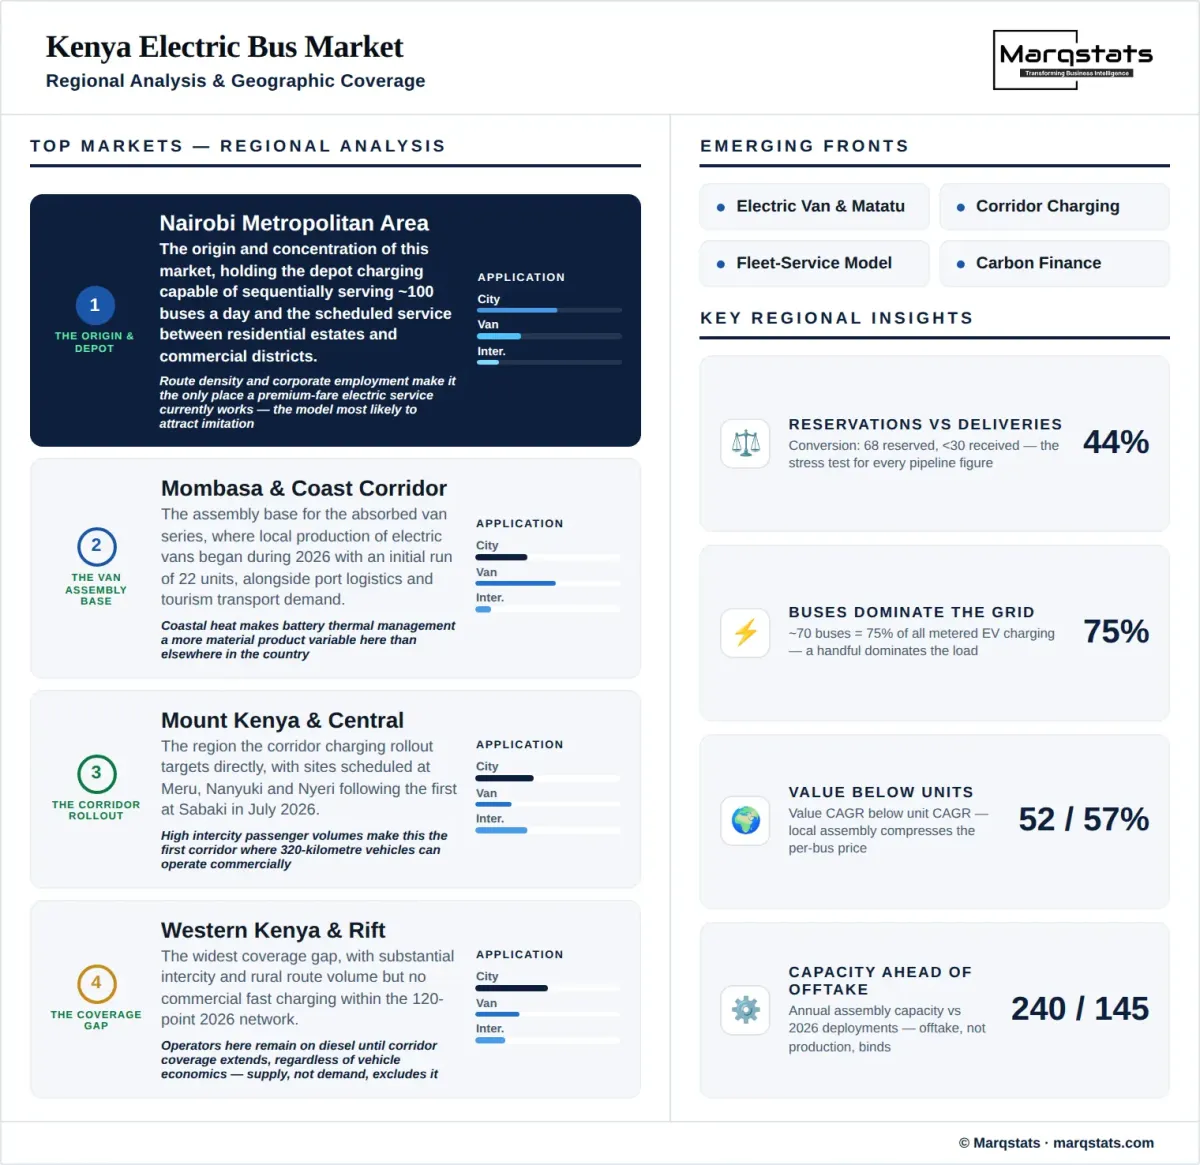
The origin and concentration of this market, holding the depot charging capable of sequentially serving approximately 100 buses a day and the scheduled service running between residential estates and commercial districts. Route density and corporate employment make it the only place a premium-fare electric service currently works.
The Mombasa and Coast Corridor
The assembly base for the absorbed van series, where local production of electric vans began during 2026 with an initial run of 22 units, alongside port logistics and tourism transport demand. Coastal heat makes battery thermal management a more material product variable here.
Mount Kenya and Central Corridor
The region the corridor charging rollout targets directly, with sites scheduled at Meru, Nanyuki and Nyeri following the first at Sabaki in July 2026. High intercity passenger volumes make this the first corridor where 320 kilometre vehicles can operate commercially.
Western Kenya and the Rift Valley
The widest coverage gap, with substantial intercity and rural route volume but no commercial fast charging within the 120-point 2026 network. Operators here remain on diesel until corridor coverage extends, regardless of vehicle economics.
How Competition Is Evolving
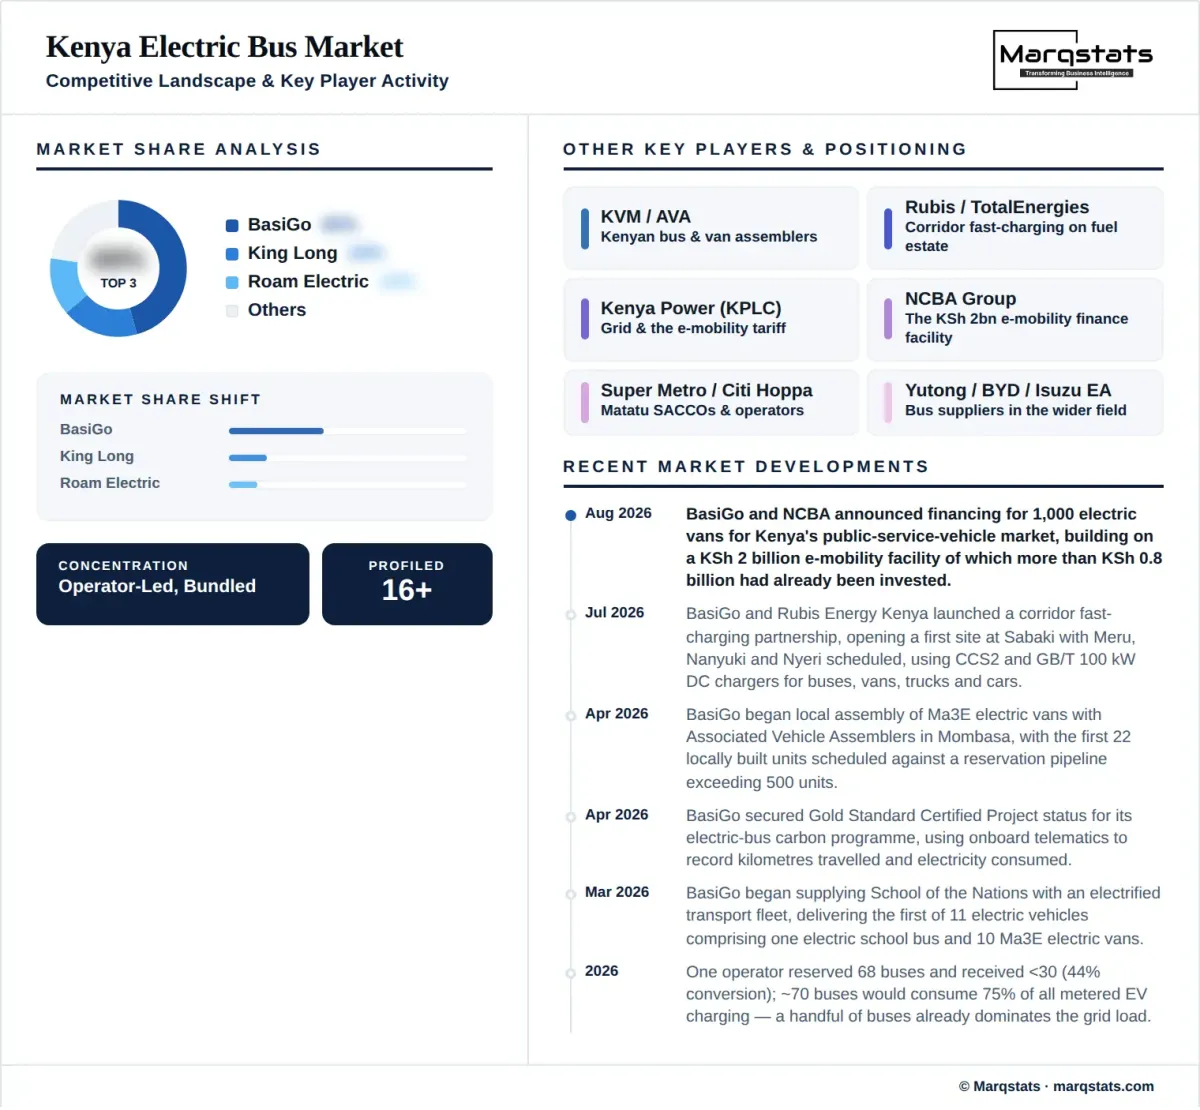
This market currently has one platform and a queue of prospective entrants, which is unusual and unstable. BasiGo holds the assembly partnership, the depot charging, the financing relationships, the carbon certification and the scheduled service, and that vertical integration rather than the vehicle itself is what competitors would have to replicate.
The vehicle layer is the least defensible part of that position. The KL-9 is a King Long design assembled locally at Kenya Vehicle Manufacturers, and Chinese bus manufacturers including Yutong and BYD can supply comparable vehicles to any distributor, which means product differentiation in this market has a short half-life.
Energy is where the second position is being built. A fuel retailer partnership opened corridor charging from July 2026 on existing forecourt estate, and a utility supplying a dedicated e-mobility tariff sits behind every depot, which makes the charging network a jointly held asset rather than a proprietary one.
Financing is the third and the one most likely to attract new entrants. A bank facility of KSh 2 billion with more than KSh 0.8 billion deployed demonstrates that lenders will underwrite these assets, and once that is established any distributor with a credit partner can compete for the same operator cooperatives.
For an entrant the practical judgement is which layer to contest. Vehicles are available to anyone, charging is being built as shared infrastructure, and the genuinely scarce capabilities are conversion of reservations into financed deliveries and the operator relationships that make a 44.12% conversion rate look good rather than poor.
Companies Covered
The report profiles 15+ companies with full strategy and financials analysis, including:
Recent Market Activity
Table of Contents
Coverage & Segmentation
This analysis measures new battery-electric buses deployed or registered in Kenya from 2021 to 2031 for public transport, school, institutional and private fleet use, with 2025 as the base year and 2026 to 2031 as the forecast period. The panel is annual flow rather than cumulative fleet stock, and the two are reported separately throughout. Market value is expressed directly in USD on a disclosed per-bus convention that falls across the forecast as local assembly replaces imported vehicles.
Coverage spans three vehicle types, four applications, two supply routes, three charging infrastructure classes and three commercial models, with four regional clusters analysed on route density, assembly presence and charging coverage rather than quantified share. Two adjacent markets are carried as named dimensions with their own series and are never merged into the headline: electric vans and matatus, rising from approximately 180 units in 2026 to 2,200 by 2031, and commercial DC fast-charging points, rising from 70 to 520. Fifteen entities are profiled across platforms, manufacturers, assemblers, energy partners, financiers and operators.