Market Snapshot
Middle bar: base-year value × (1 + CAGR), rounded to two decimals. This is a calculated illustration, not a separately researched annual estimate.
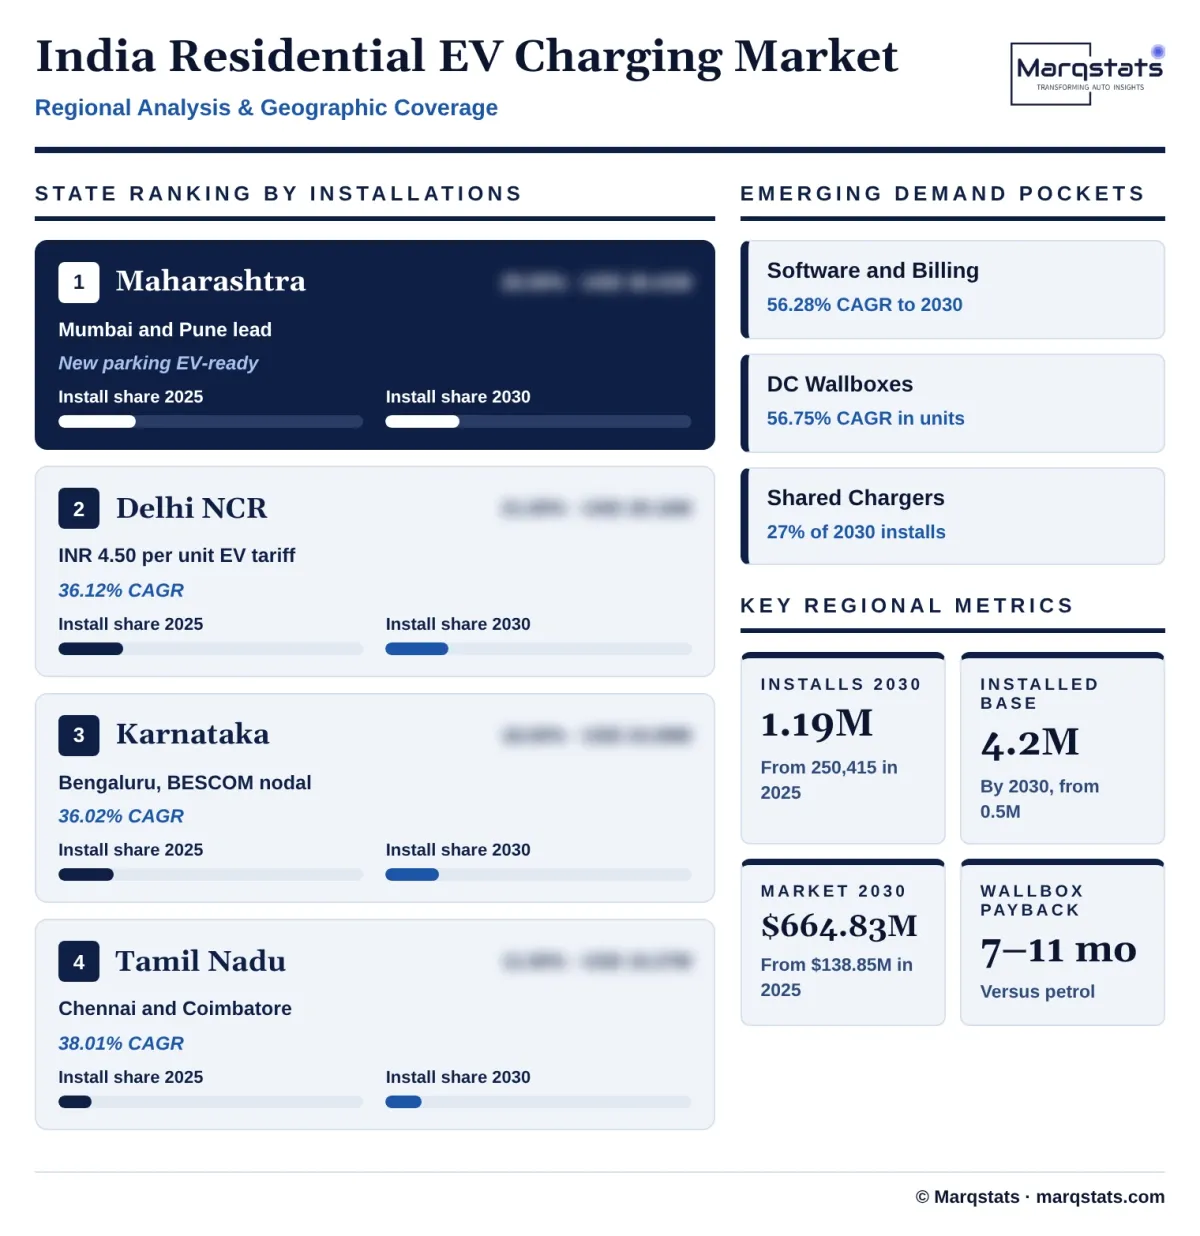
The India residential EV charging market size is estimated at USD 138.85 million in 2025 and is projected to reach USD 664.83 million by 2030, growing at a CAGR of 36.78% over 2026 – 2030. Annual installations of dedicated residential chargers rise from about 250,415 to 1,185,000, a 36.46% annual rate, and the installed base grows from about 512,800 to 4,215,000 chargers.
Marqstats defines the market as spending on dedicated EV charging at homes and in housing societies in India. It covers charger hardware, from 3.3 kW smart sockets to 7.4 kW to 22 kW AC wallboxes and 11 kW to 25 kW DC wallboxes, installation and electrical work including cabling, protection devices and sub-meters, and charging management software and billing services for housing societies. Ordinary 15 A wall sockets used without a dedicated charger, public and fleet charging, and electricity sales are excluded. In rupee terms the market grows from about INR 1,208 crore in 2025 to about INR 5,784 crore in 2030, at INR 87.00 per US dollar.
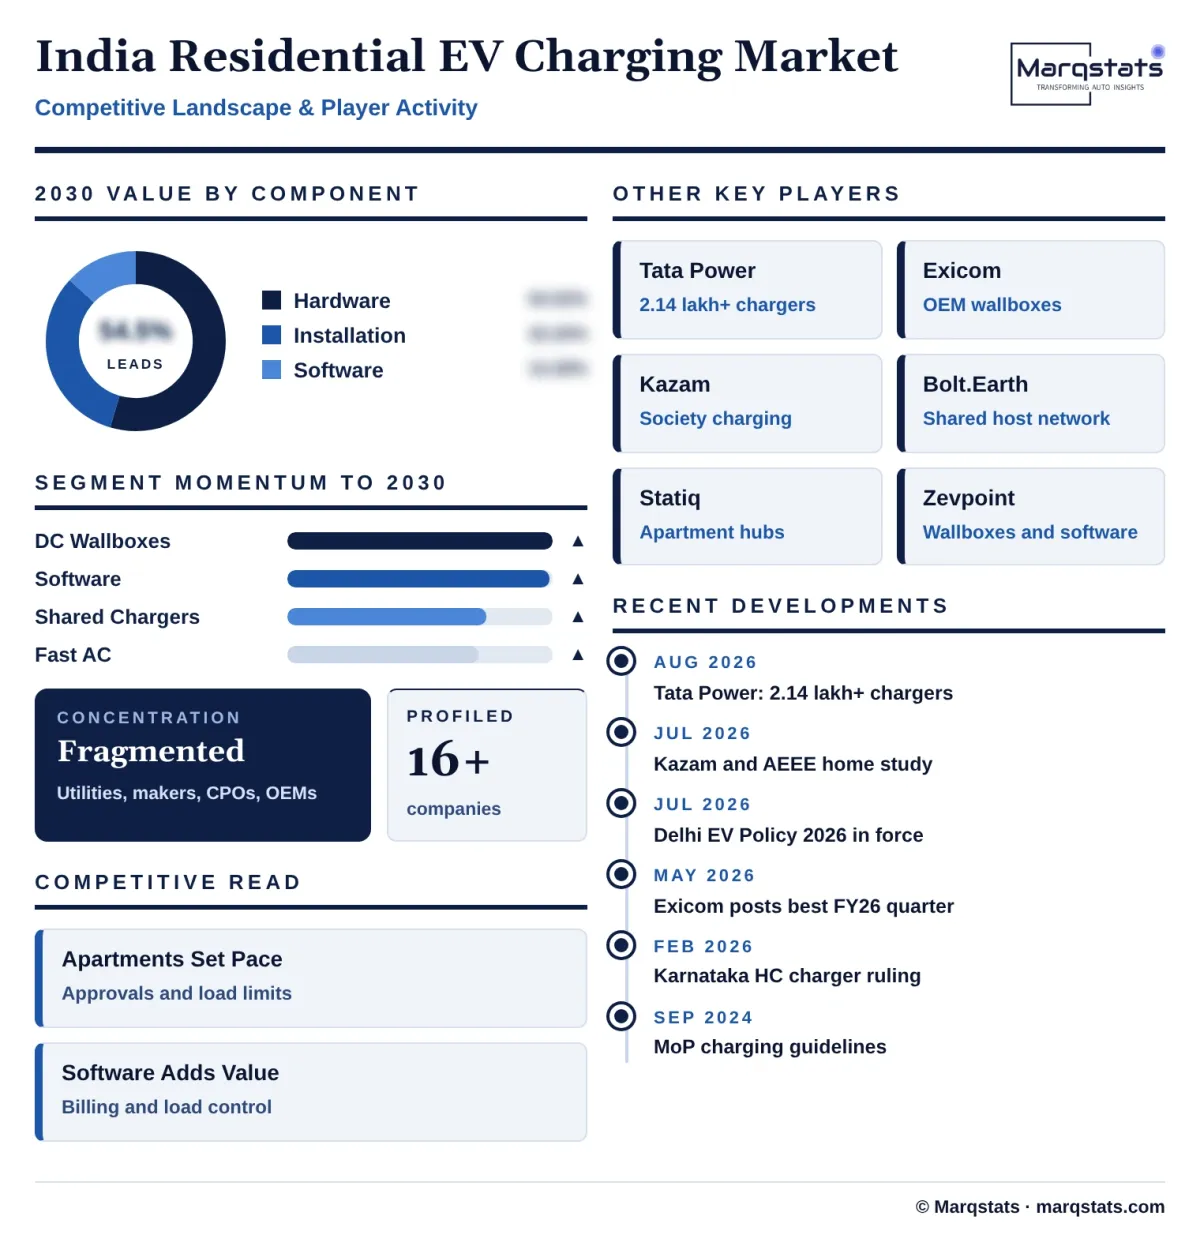
Charger hardware accounts for 58.98% of 2025 value, installation and electrical work for 34.20% and software for 6.82%. Gated societies and apartment buildings account for 54.00% of installations, and Maharashtra for 25.50%. The study segments the market by component, property type, power output, ownership model and state.
Key Takeaways
Market Overview & Analysis
Report Summary
Marqstats sizes the India residential EV charging market as annual spending on dedicated chargers, installation and software at private homes and in housing societies. In 2025 about 250,415 dedicated residential chargers were installed, worth an estimated USD 138.85 million, or about INR 1,208 crore.
The 2025 total comprises about 167,215 private wallboxes for electric cars, 65,000 dedicated smart sockets or wallboxes for electric two-wheelers in apartment buildings and 18,200 shared community chargers in housing society parking. Charger hardware sold at an average of about INR 28,450 per unit, generating USD 81.89 million. Installation, cabling and switchgear averaged about INR 16,500 per point, generating USD 47.49 million, and software subscriptions, cloud charging management and housing society billing fees added USD 9.47 million.
Most EV charging in India happens at home. The Kazam and Alliance for an Energy Efficient Economy study, published in July 2026 and covering more than 80,000 residential installations in more than 10,000 pin codes, found that home charging supplies about 80% to 90% of daily EV energy and is typically two to four times cheaper than public charging. About 85% of private electric car buyers install a dedicated wallbox, usually a 7.4 kW Type 2 unit supplied by the car maker. Most electric two-wheeler owners still use ordinary 15 A sockets, but housing society restrictions on extension cables are driving demand for dedicated smart sockets.
India's EV market is growing quickly. Total EV sales passed 2.36 million in 2025, 8.36% of all vehicle sales. Electric car sales rose 85.1% to 196,724, lifting penetration to 4.3% from 2.5% in 2024, and electric two-wheeler sales reached about 1.35 million. Tata Motors led electric cars with a 39.1% share, while Mahindra and JSW MG Motor grew fastest, widening the range of models sold with home chargers.
The market grew from about 18,200 chargers worth USD 11.07 million in 2021 to 46,500 worth USD 27.68 million in 2022, 102,400 worth USD 59.93 million in 2023 and 148,600 worth USD 85.37 million in 2024. Marqstats expects about 342,000 installations worth USD 189.88 million in 2026.
Housing type shapes cost and complexity. In independent houses and villas, the parking space is next to the home's meter and switchboard, so installation is simple and needs no approvals. In gated societies and high-rise apartments, cables must run from basement meter rooms across common areas, residents need approval from the resident welfare association, and the building's transformer may limit how many chargers can be added. About 70% to 75% of urban households live in apartments or multi-family buildings, so solving the apartment problem is central to growth.
India Residential EV Charging Market Size and Forecast
The India residential EV charging market grows from USD 138.85 million in 2025 to USD 664.83 million in 2030, a CAGR of 36.78%. Marqstats expects USD 266.03 million in 2027, USD 371.51 million in 2028 and USD 500.98 million in 2029, with annual installations of about 478,000, 665,000 and 895,000 chargers in those years, before reaching 1,185,000 in 2030.
Hardware remains the largest component. Charger hardware grows at 34.65% a year from USD 81.89 million to USD 362.47 million, but its share falls from 58.98% to 54.52%. Installation and electrical work grows at 35.14% a year from USD 47.49 million to USD 214.07 million, holding about a third of the market, because more chargers are installed in apartment basements that need longer cable runs, sub-meters and protection devices.
Software grows fastest. Charging management, load balancing and billing services grow at 56.28% a year from USD 9.47 million to USD 88.29 million, doubling their share from 6.82% to 13.28%, as housing societies install shared chargers that need user authentication, per-unit billing and load control, and as private wallboxes connect to apps and smart meters.
Installed cost depends on charger type. Marqstats estimates a 3.3 kW smart socket costs about INR 24,500 to 37,500 installed, a 7.4 kW wallbox INR 49,000 to 79,000, a shared 22 kW society charger INR 1.03 lakh to 1.49 lakh and a shared 25 kW DC charger INR 2.88 lakh to 3.95 lakh, including cabling, protection devices, metering, labour and utility fees.
Payback periods are short. A smart socket for an electric two-wheeler typically pays back in three to five months against petrol, a private 7.4 kW wallbox in 7 to 11 months, a shared society 22 kW charger in 12 to 18 months and a shared DC charger operated by a charging company in 24 to 36 months.
Marqstats tracks four indicators to monitor the forecast: monthly electric car and two-wheeler registrations, the share of new car buyers taking a bundled wallbox, approvals of chargers in housing societies, and the adoption of separate EV meters and time-of-day tariffs by distribution companies.
Volume and value grow at almost the same rate. Installations grow at 36.46% a year and value at 36.78%, because falling hardware prices are offset by a rising share of more complex apartment installations, shared society chargers and DC wallboxes, and by faster growth in software and services.
Market Dynamics
Key Drivers
Five forces are expanding home and housing society EV charging in India.
- Electric car sales are rising fast. Electric car sales grew 85.1% in 2025 to 196,724, and about 85% of private buyers install a dedicated home wallbox, often supplied by the car maker.
- Home charging is cheaper. Charging at home at domestic or EV tariffs costs a fraction of public fast charging or petrol, giving buyers a quick payback on a home charger.
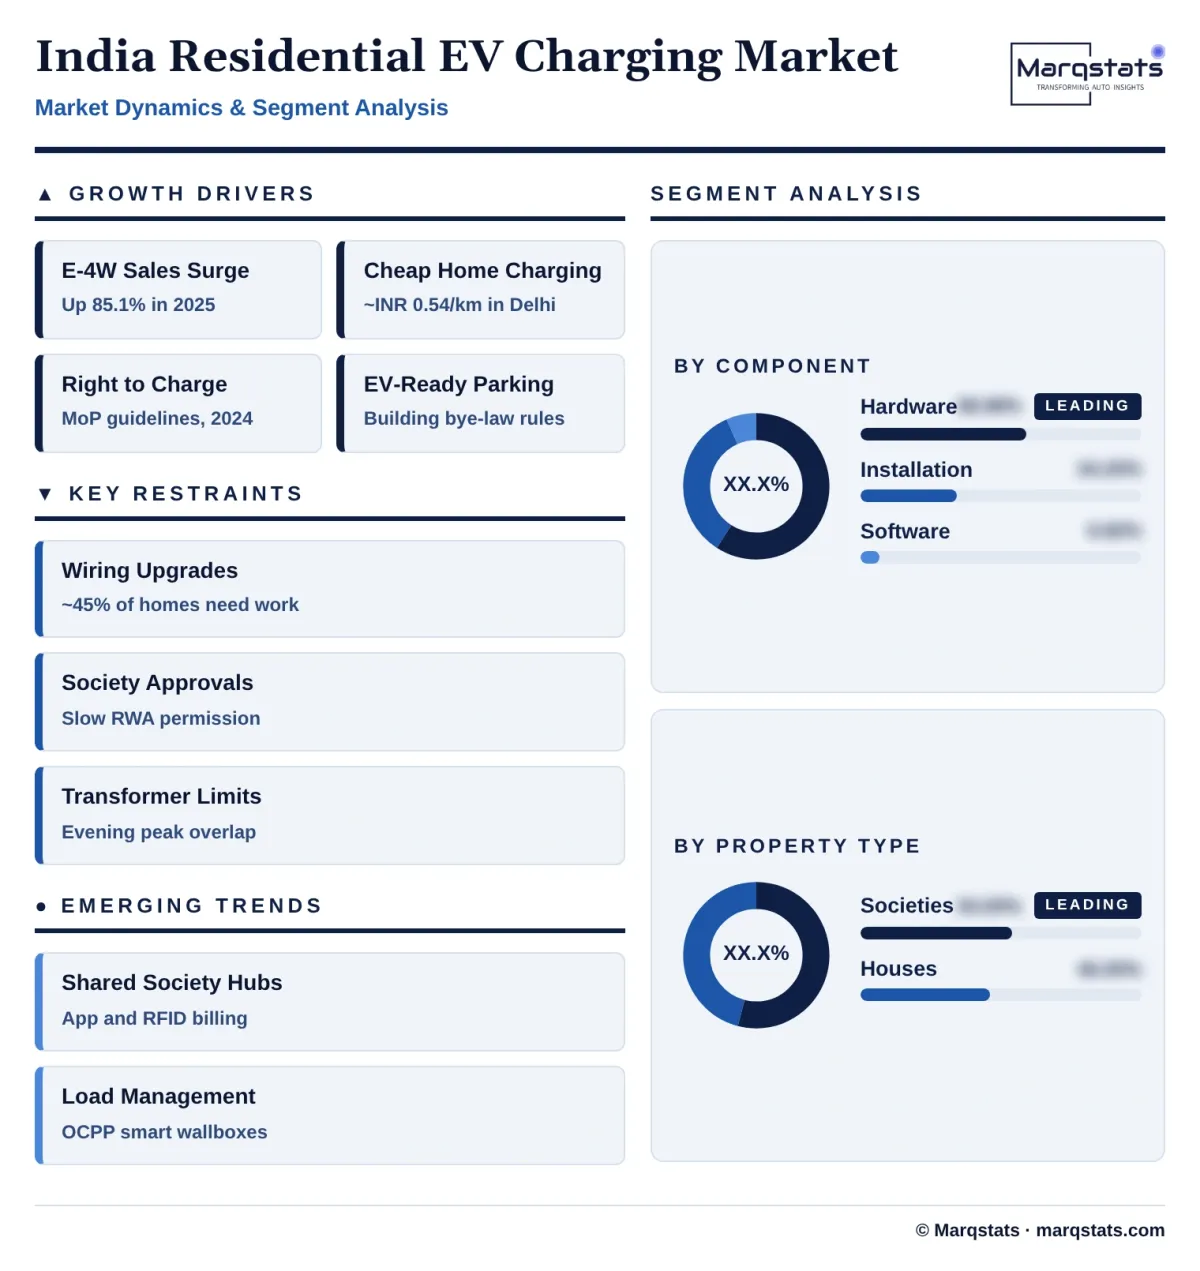
- Rules protect the right to charge. The Ministry of Power's 2024 charging guidelines let residents charge on existing domestic connections, request separate EV connections and use sub-meters behind a society's bulk connection.
- Building rules require EV-ready parking. Model building bye-laws require 20% of parking in new buildings to be EV-ready, Haryana requires chargers for 20% of parking in new group housing, and Maharashtra's EV policy requires new residential parking to be fully EV-ready.
- Car and two-wheeler makers bundle chargers. Tata Motors, JSW MG Motor, Mahindra, Hyundai, Ather and others supply home chargers with vehicles, linking vehicle sales directly to charger installations.
Key Restraints
Four constraints slow residential charger installation in Indian homes and apartments.
- Many homes need electrical work. About 45% of Indian homes need wiring, panel or load upgrades before they can charge safely, and about 15% of prospective buyers are blocked by lack of parking or long cable runs.
- Housing society approvals are slow. Resident welfare associations often delay or refuse permission for cables across common areas, and residents may need legal help, as in a February 2026 case in the Karnataka High Court.
- Transformers lack spare capacity. Evening charging coincides with household peak demand, and older buildings may need transformer upgrades before many chargers can be added.
- Power quality is poor in some areas. Voltage drops to 180 V to 190 V and faulty earthing in older buildings cause charger fault trips that users mistake for product failures, raising service costs.
Key Trends
Four shifts are changing how Indian homes and housing societies charge EVs.
- Shared society charging hubs. Housing societies and charging companies are installing banks of shared chargers with app-based billing instead of allowing individual cables through basements.
- Zero-upfront-cost models. Charging companies such as Kazam, Bolt.Earth and Statiq offer chargers to housing societies with no upfront cost in return for a share of charging revenue.
- Smart chargers with load management. Wallboxes using the Open Charge Point Protocol connect to cloud software that limits power draw when household or building demand peaks.
- Separate EV metering and time-of-day tariffs. Distribution companies and regulators are offering dedicated EV tariffs and lower rates outside peak hours to move charging to late night.
Strategic Implications
- For charger makers, load management and robustness matter more than headline power. Wallboxes that balance load automatically, tolerate low voltage and detect earthing faults will reduce service calls and win approval from housing societies.
- For charging companies, housing societies are a recurring revenue base. Zero-upfront-cost hubs with billing software and maintenance contracts turn one-off installations into long-term relationships.
- For car and two-wheeler makers, the home charger is part of the product. Fast, well-installed chargers improve the ownership experience, while delays caused by society approvals or electrical upgrades can slow vehicle deliveries.
- For housing societies, planned infrastructure avoids disputes. Shared cable trays, central EV distribution boards and clear approval procedures make it easier to add chargers safely as more residents buy EVs.
- For distribution companies, visibility is the priority. Smart meter data, separate EV connections and time-of-day tariffs help utilities plan transformer upgrades before charging loads cause local overloads.
- For state governments, approval rules unlock demand. Fixed timelines for housing society permission, clear safety standards and support for building transformer upgrades through schemes such as PM E-DRIVE would help apartment residents install chargers as quickly as house owners.
Market Segmentation
Charger hardware, including smart sockets, AC wallboxes and DC wallboxes, accounts for 58.98% of 2025 value, USD 81.89 million, at an average of about INR 28,450 per charger. It grows at 34.65% a year to USD 362.47 million by 2030, while its share falls to 54.52% as competition and local manufacturing reduce prices.
Installation, armoured cabling, protection devices, sub-meters and certified electrical labour account for 34.20% of 2025 value, USD 47.49 million, averaging about INR 16,500 per point, and grow at 35.14% a year to USD 214.07 million, 32.20% of 2030 value.
Charging management software, load management, billing apps for housing societies and maintenance contracts account for 6.82% of 2025 value, USD 9.47 million, and grow fastest, at 56.28% a year, to USD 88.29 million and 13.28% of 2030 value.
Gated societies and apartment buildings account for 54.00% of 2025 installations, about 135,224 chargers, rising at 40.96% a year to 752,475 and 63.50% by 2030, driven by urban apartment living and building rules in large cities.
Independent houses, plotted developments and villas account for 46.00% of 2025 installations, about 115,191 chargers, rising at 30.29% a year to 432,525 by 2030, while their share falls to 36.50%. Installation is simple because parking is next to the home's own meter.
Smart sockets and low-power chargers up to 3.3 kW for electric two- and three-wheelers account for 43.50% of 2025 installations, about 108,930 units, rising to 379,200 by 2030, a 28.33% annual rate, while their share falls to 32.00%.
Type 2 wallboxes of 7.4 kW to 22 kW for electric cars account for 54.50% of 2025 installations, about 136,476 units, rising at 40.92% a year to 758,400 and 64.00% by 2030. A 7.4 kW unit fully charges a 30 to 50 kWh car battery overnight.
Compact DC chargers of 11 kW to 25 kW in premium societies and shared visitor parking account for 2.00% of 2025 installations, about 5,009 units, and grow fastest, at 56.75% a year, to 47,400 and 4.00% by 2030.
Chargers bought by individual owners and installed in their own parking space account for 78.50% of 2025 installations, about 196,576 units, rising at 34.49% a year to 865,050, 73.00% of 2030 installations.
Shared chargers installed by housing societies or charging companies in common parking account for 21.50% of 2025 installations, about 53,839 units, and grow at 42.82% a year to 319,950, 27.00% of 2030 installations. Residents pay about INR 8 to 12 per kWh through apps or RFID cards.
By Geography
Maharashtra
Maharashtra is the largest market, with an estimated 25.50% of 2025 installations, about 63,856 chargers, and USD 35.41 million of value, rising to USD 159.56 million by 2030, a 35.13% CAGR. Demand is concentrated in the Mumbai Metropolitan Region and Pune. The Maharashtra EV Policy 2025 requires parking in new residential buildings to be EV-ready, and the Bombay High Court has asked the state to finalise a legal framework for charging in housing societies. MSEDCL, Tata Power and Adani Electricity Mumbai supply power.
Delhi NCR
Delhi NCR accounts for 21.00% of 2025 installations, about 52,587 chargers, and USD 29.16 million of value, rising to USD 136.29 million by 2030, a 36.12% CAGR. Delhi's EV tariff of about INR 4.50 per unit makes home charging very cheap, and the Delhi EV Policy 2026, effective from 1 July 2026, encourages resident welfare associations and housing societies to provide charging. Haryana requires chargers for 20% of parking in new group housing in Gurugram and Faridabad, while approvals in Noida have been slower.
Karnataka
Karnataka accounts for 18.00% of 2025 installations, about 45,075 chargers, and USD 24.99 million of value, rising to USD 116.35 million by 2030, a 36.02% CAGR. Bengaluru leads demand. BESCOM is the state nodal agency for charging, and in February 2026 the Karnataka High Court allowed an apartment owner in Bengaluru to install a charger in his parking slot under BESCOM's guidelines for residential complexes.
Tamil Nadu
Tamil Nadu accounts for 11.00% of 2025 installations, about 27,546 chargers, and USD 15.27 million of value, rising to USD 76.46 million by 2030, a 38.01% CAGR, led by Chennai and Coimbatore. Approvals in apartment buildings are handled case by case by society general bodies.
Telangana
Telangana accounts for 9.00% of 2025 installations, about 22,537 chargers, and USD 12.50 million of value, rising to USD 63.16 million by 2030, a 38.26% CAGR, led by Hyderabad's IT corridor, where simplified load approvals help societies add shared chargers.
Rest of India
The rest of India accounts for 15.50% of 2025 installations, about 38,814 chargers, and USD 21.52 million of value, and grows fastest, at 39.34% a year, to USD 113.01 million by 2030, mainly in independent houses in smaller cities where installation needs no society approval.
How Competition Is Evolving
The India residential EV charging market is fragmented. Utilities, charger makers, charging companies, car makers and electrical equipment brands all compete, and no single company controls a majority of installations.
Tata Power leads among integrated players. Its EV charging business had installed more than 2.14 lakh home chargers by the end of FY26 and has more than 5.6 lakh registered users on its EZ Charge app, and it works closely with Tata Motors, the largest electric car seller.
Charger makers supply car makers and charging companies. Exicom, Servotech, Zevpoint, ABB, Schneider Electric, Legrand and Havells make residential wallboxes and electrical equipment, and Exicom supplies home chargers to leading car makers.
Charging companies focus on housing societies. Kazam, Bolt.Earth, Statiq, ChargeZone, Magenta ChargeGrid and IONAGE offer shared chargers, billing software and zero-upfront-cost contracts to resident welfare associations.
Competition will be decided by installation quality, software and partnerships. Companies that install quickly and safely, manage loads across a building and work with car makers and distribution companies will win the largest share as installations grow.
Car makers shape hardware choice. Buyers of Tata, MG, Mahindra and Hyundai electric cars usually receive a 7.4 kW wallbox through the dealer, installed by a partner charging company or certified electrician, so supply agreements with car makers decide which charger brands reach most homes.
Companies Covered
Companies covered in the report include:
Recent Market Activity
Table of Contents
Coverage & Segmentation
The study covers the India residential EV charging market, with 2025 as the base year, 2021 – 2025 as the historical period and 2026 – 2030 as the forecast period. Values are in US dollars, converted at INR 87.00 per US dollar, and volumes are annual installations of dedicated chargers. The market is segmented by component, property type, power output, ownership model and state.
Charging through ordinary wall sockets without a dedicated charger, public and fleet charging, battery swapping and electricity sales are excluded. State values and the split of value by state are Marqstats estimates built on registration data, charger shipments, installation costs and utility and housing society data.