Market Snapshot
Middle bar: base-year value × (1 + CAGR), rounded to two decimals. This is a calculated illustration, not a separately researched annual estimate.
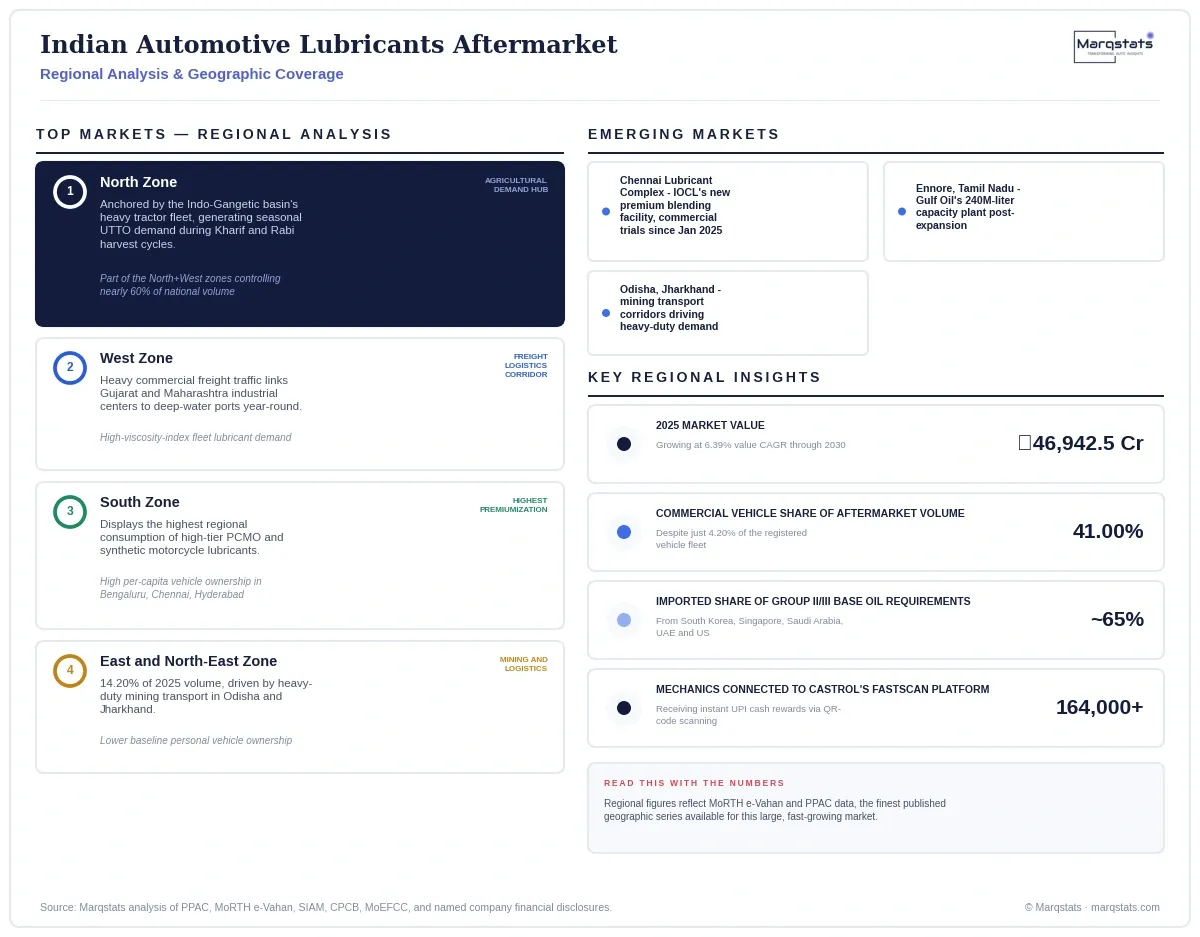
The Indian automotive lubricants aftermarket generated ₹46,942.50 Crore (USD 5.500 billion) in 2025, even as India runs a structural domestic deficit in high-purity Group II and Group III base oils, importing approximately 65% of these grades from South Korea, Singapore, Saudi Arabia, the United Arab Emirates and the United States, while commercial vehicles comprising just 4.20% of the 389.77 million-unit registered fleet absorb 41.00% of aftermarket volume, since a single multi-axle freight truck consumes between 28 and 42 liters of crankcase, transmission and differential lubricants annually, equal to the annual fluid requirement of roughly 15 to 20 entry-level commuter motorcycles.
Domestic consumption of all petroleum products in India reached approximately 238.50 million metric tonnes during the 2024-2025 period. Within this aggregate volume, total finished lubricants and greases accounted for 2.82 MMT, with the automotive segment capturing 55.32% (1.56 MMT). Deducting factory-fill applications of roughly 75,000 metric tonnes leaves an addressable automotive replacement aftermarket of 1,485.00 thousand metric tonnes (1,650.00 million liters) for the 2025 base year, valued at ₹46,942.50 Crore (USD 5.500 billion at ₹85.35 per USD).
The market's defining structural finding is a genuine imbalance between fleet composition and volumetric demand concentration. While commercial vehicles (medium and heavy trucks plus light commercial vehicles) comprise just 4.20% of India's 389.77 million-unit registered vehicle fleet, they absorb 41.00% of total aftermarket volume, since a single multi-axle freight truck operating on inter-state logistics routes consumes between 28 and 42 liters of crankcase, transmission and differential lubricants annually, equal to the annual fluid requirement of roughly 15 to 20 entry-level commuter motorcycles. Simultaneously, India runs a structural domestic deficit in high-purity Group II and Group III Lube Oil Base Stocks: while domestic public refineries including HPCL, IOCL Haldia, and Chennai Petroleum Corporation Limited produce substantial Group I and Group II volumes, approximately 65% of the country's Group II and Group III base oil requirements are imported from merchant refiners in South Korea, Singapore, Saudi Arabia, the United Arab Emirates and the United States, exposing domestic blenders to currency and international shipping volatility.
Key Takeaways
Market Overview & Analysis
Report Summary
This analysis sizes the Indian automotive lubricants aftermarket by isolating the addressable automotive replacement layer from total petroleum product consumption, industrial processing fluids, and OEM factory-fill volume procured directly by automotive manufacturers. The market is valued at net realization wholesale and retail service level, reflecting transaction prices inclusive of blender margins, distribution commissions and applicable taxes. The market is sized in thousand metric tonnes and INR Crore/USD billion across a 2021-2025 historical period and a 2026-2030 forecast period, with 2025 as the base year.
The Indian automotive lubricants aftermarket registered 1,485.00 thousand metric tonnes valued at ₹46,942.50 Crore (USD 5.500 billion) in 2025, following historical volume expansion from 1,305.00 TMT in 2021, a 3.28% compound annual growth rate. By 2030, physical volume is projected to reach 1,757.50 thousand metric tonnes, a 3.43% compound annual growth rate, while market value expands to ₹63,980.00 Crore, a 6.39% compound annual growth rate. This value premium over volume growth reflects the structural migration of the fleet from low-cost monograde mineral oils toward higher-margin semi-synthetic and full-synthetic formulations required by BS-VI Phase II emissions standards and CAFE III fuel economy targets.
The Baseline Industry Outlook (60% probability) assumes Indian real GDP grows at 6.5% to 7.0% annually, sustaining 7% to 9% annual inter-state freight growth, with two-wheeler EV sales penetration plateauing between 18% and 22% by 2030 and semi-synthetic and synthetic oils reaching 43% volume share, yielding 1,757.50 TMT (3.43% CAGR) and ₹63,980.00 Crore (6.39% CAGR) by 2030. The Accelerated Transition and Strict Policy Enforcement scenario (25% probability), reaching only 1,620.00 TMT (1.76% CAGR) but ₹68,500.00 Crore (7.85% CAGR), is triggered if MoRTH strictly enforces mandatory scrappage for commercial vehicles over 15 years old, removing approximately 15 million older, high-oil-consuming vehicles, alongside early gazetting of CAFE Phase III standards mandating ultra-low-viscosity synthetic oils with drain intervals exceeding 20,000 kilometers. The Delayed Fleet Modernization and High Freight Utilization scenario (15% probability), reaching 1,845.00 TMT (4.44% CAGR) but only ₹58,200.00 Crore (4.39% CAGR), is triggered if economic headwinds slow commercial EV fleet adoption and weak scrappage enforcement allows older BS-III and BS-IV commercial vehicles to remain in secondary regional service.
Market Dynamics
Key Drivers
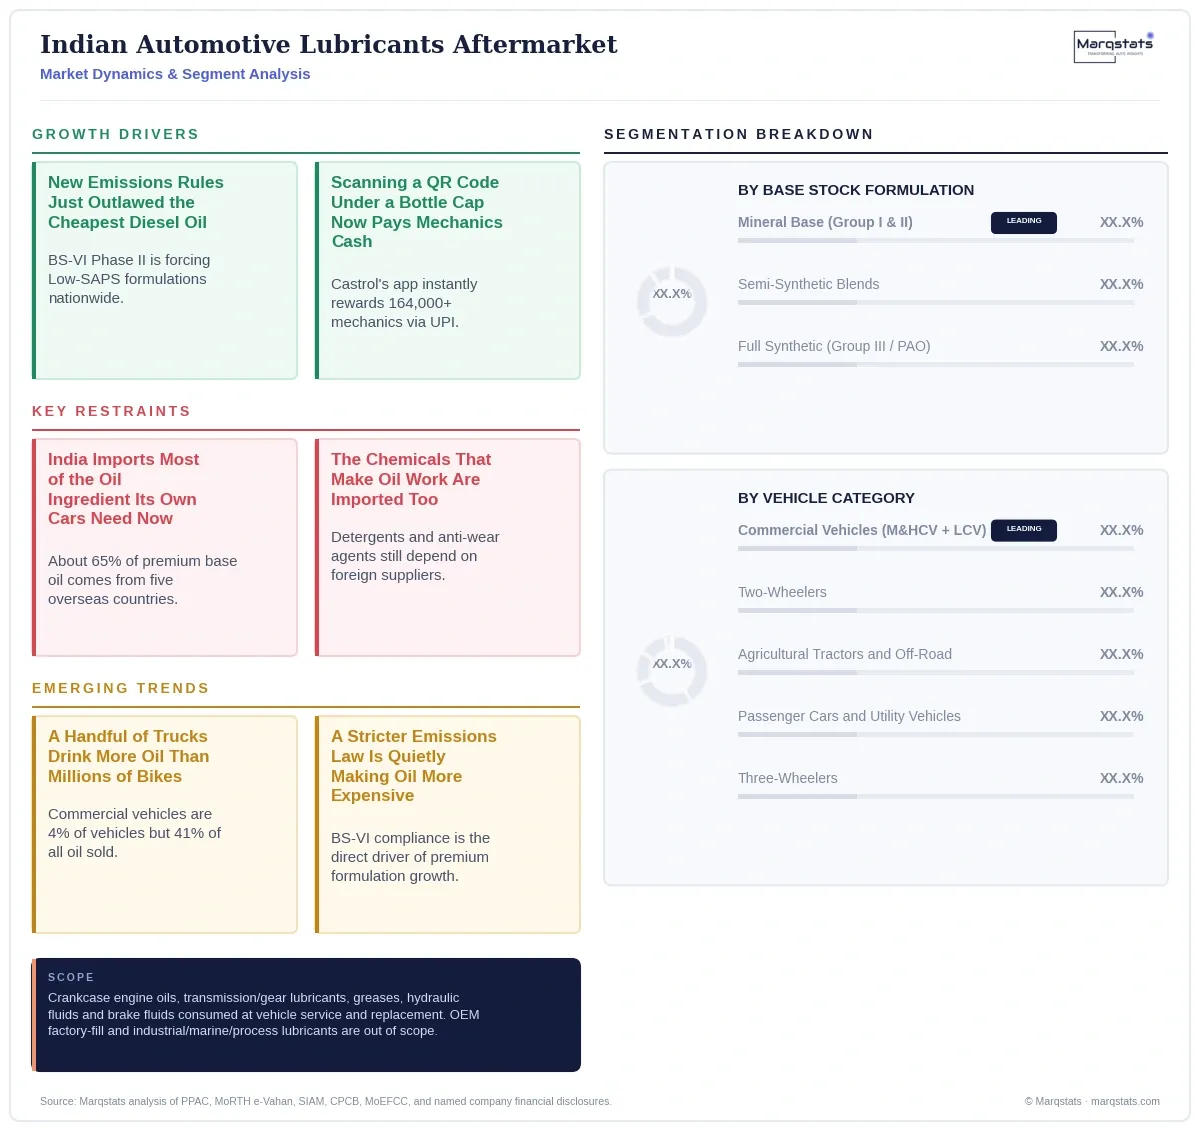
- Statutory BS-VI Phase II emissions enforcement anchors baseline reformulation demand, exemplified by Real Driving Emissions standards with on-board diagnostics taking effect 1 April 2023 for passenger and commercial vehicles and 1 April 2025 for two-wheelers, requiring Low-SAPS chemistries restricting sulfated ash to under 1.0% to avoid poisoning diesel particulate filters and selective catalytic reduction systems.
- Direct-to-mechanic digital loyalty architectures are reshaping bazaar trade competition, exemplified by Castrol India's FastScan application connecting over 164,000 registered mechanics to instant UPI cash rewards via QR-code scanning, while Gulf Oil operates comparable Gulf Smart and Gulf Uno contractor platforms to secure independent workshop brand loyalty.
- Domestic capacity expansion is directly substituting imported base oils, exemplified by Chennai Petroleum Corporation Limited's Group II/Group III LOBS expansion at its Manali refinery, backed by ₹1,620 Crore approved capital expenditure to add 250,000 metric tonnes per annum of domestic base oil processing capacity supplying Indian Oil Corporation's new Chennai Lubricant Complex.
- Extended Producer Responsibility mandates are formalizing closed-loop used-oil collection ecosystems, exemplified by Tata Motors and Castrol India jointly launching a used engine oil recycling circularity pilot across franchised service workshops in Karnataka in June 2026, alongside Hindustan Petroleum Corporation Limited partnering with Tata Motors to aggregate hazardous used oil across HPCL's 28 exclusive lube depots.
- Indigenous additive synthesis partnerships are reducing import dependency on global additive majors, exemplified by Indian Oil Corporation Limited signing a memorandum of understanding with Godrej Chemicals in March 2026 to co-develop domestically manufactured detergents, dispersants and anti-wear chemistries meeting API SP and API CK-4 performance standards.
Key Restraints
- India's structural domestic deficit in high-purity Group II and Group III base oils compels blenders to import approximately 65% of these grades from South Korea, Singapore, Saudi Arabia, the United Arab Emirates and the United States, exposing the market to foreign exchange volatility and international shipping rate fluctuations that domestic capacity additions like CPCL's Manali expansion only partially address in the near term.
- Performance additives including detergents, dispersants, anti-wear agents, viscosity index improvers and pour point depressants have historically presented even higher import dependencies than base stocks, with domestic blenders traditionally relying on imports from global manufacturers including Lubrizol, Infineum, Afton Chemical and Chevron Oronite, creating genuine cost and supply chain exposure ahead of nascent indigenous synthesis partnerships reaching commercial scale.
- The independent bazaar trade channel, controlling 67.50% of total replacement volume across an extensive network of over 150,000 retail spare parts counters and roadside multi-brand mechanics, structurally favors incumbent brands with established mechanic loyalty programs, creating a genuine barrier for new entrants lacking comparable digital engagement infrastructure or distribution scale.
- Escalating Extended Producer Responsibility recycling targets, rising from 5% to 10% of base volume sold in FY2024-25 toward 40% to 50% by FY2028-29 under Central Pollution Control Board enforcement, impose genuine compliance costs and administrative complexity on lubricant marketers, with full regulatory enforcement and penalties beginning FY2027-28 threatening to exclude non-compliant unorganized blenders from supply chains entirely.
Key Trends
- The finding that commercial vehicles comprising just 4.20% of India's registered fleet absorb 41.00% of aftermarket volume, while two-wheelers comprising 74.50% of the fleet generate only 28.50% of volume, demonstrates that per-unit sump capacity and duty cycle intensity, not fleet population, is the primary determinant of aftermarket lubricant demand concentration in India.
- The consistency between BS-VI Phase II Low-SAPS chemistry requirements and semi-synthetic and full synthetic formulations expanding at 8.05% and 12.16% annual volume growth respectively, even as mineral base formulations stagnate at a negative 0.01% annual rate, demonstrates that statutory emissions regulation, not consumer discretionary premiumization alone, is the primary structural driver of India's formulation mix shift.
- The finding that India imports approximately 65% of its Group II and Group III base oil requirements despite operating substantial domestic Group I and Group II refining capacity indicates that India's lubricants aftermarket carries genuine geopolitical and currency supply chain risk concentrated in specific international shipping corridors, a structural vulnerability that CPCL's Manali expansion only partially addresses in the near term.
- The fact that Castrol India generates an operating EBITDA margin between 21% and 26%, more than double the 10% to 14% margins typical of public-sector and private competitors, despite public-sector Maharatna OMCs controlling roughly 46.50% of total aftermarket volume, demonstrates that brand equity and distribution channel positioning, not upstream refining integration alone, drive superior profitability in this market.
- The finding that electric three-wheelers have already achieved 55% to 60% new sales penetration while medium and heavy commercial freight trucks remain under 0.2% electrified indicates that India's electrification trajectory is genuinely bifurcated by vehicle class, meaning aggregate EV statistics substantially overstate near-term lubricant demand contraction across the volumetrically dominant commercial trucking segment.
Strategic Implications
For a market entrant, competing directly against the independent bazaar trade's entrenched mechanic loyalty programs and public-sector OMCs' institutional fleet contracts presents substantial structural barriers; capital is better directed toward specialized BS-VI Phase II Low-SAPS commercial diesel formulations, dedicated EV driveline and dielectric immersion cooling fluids, or securing toll-blending and re-refined base oil supply agreements that position the entrant favorably ahead of escalating Extended Producer Responsibility enforcement.
For an established lubricant blender or marketer, managing the structural transition from mineral to semi-synthetic and full synthetic formulations requires expanding digital mechanic engagement platforms following the model demonstrated by Castrol's FastScan and Gulf's Gulf Smart, while building formal used-oil collection networks across dealership and bazaar service points ahead of the FY2027-28 full regulatory enforcement threshold to avoid EPR credit penalties and non-compliance exclusion from supply chains.
For an upstream refiner or base oil investor, addressing India's structural 65% Group II/III import dependency requires prioritizing domestic hydrocracking capacity investment following the model demonstrated by Chennai Petroleum Corporation Limited's Manali expansion, while forming indigenous additive synthesis partnerships following Indian Oil Corporation's memorandum of understanding with Godrej Chemicals to reduce foreign import reliance on international additive majors including Lubrizol, Infineum, Afton Chemical and Chevron Oronite.
Outlook
Baseline Industry Outlook (60% Probability): 1,757.50 TMT by 2030 (3.43% five-year volume CAGR) and ₹63,980.00 Crore (6.39% five-year value CAGR). This trajectory assumes Indian real GDP grows at 6.5% to 7.0% annually, sustaining 7% to 9% annual inter-state freight movement, with two-wheeler EV sales penetration plateauing between 18% and 22% by 2030, electric commercial freight adoption remaining confined to last-mile urban logistics, and semi-synthetic and synthetic engine oils expanding to 43% of total volume.
Accelerated Transition and Strict Policy Enforcement (25% Probability): 1,620.00 TMT by 2030 (1.76% five-year volume CAGR) and ₹68,500.00 Crore (7.85% five-year value CAGR). The specific trigger is MoRTH strictly enforcing mandatory scrappage for commercial vehicles over 15 years old, removing approximately 15 million older, high-oil-consuming vehicles from the operating parc, combined with early gazetting of CAFE Phase III standards forcing passenger car manufacturers to mandate ultra-low-viscosity synthetic oils with drain intervals exceeding 20,000 kilometers, contracting total volumetric consumption while accelerating market value through higher average realization per liter.
Delayed Fleet Modernization and High Freight Utilization (15% Probability): 1,845.00 TMT by 2030 (4.44% five-year volume CAGR) and ₹58,200.00 Crore (4.39% five-year value CAGR). The specific trigger is economic headwinds slowing commercial EV fleet adoption combined with weak scrappage enforcement allowing older BS-III and BS-IV commercial vehicles to remain in secondary regional service, while high road transport activity elevates operating hours and aggregate lubricant consumption, but price resistance in rural and independent bazaar channels sustains consumption of low-margin Group I and Group II mineral formulations, constraining overall value realization.
Market Segmentation
Commercial vehicles generated 608.85 TMT (41.00% share) in 2025, expanding to 711.79 TMT (40.50% share) by 2030, anchored by Tata Motors and Ashok Leyland fleets requiring API CK-4 and CI-4 Plus formulations, remaining the largest single volume segment given severe duty cycles logging 60,000 to 90,000 kilometers annually.
Two-wheelers generated 423.23 TMT (28.50% share) in 2025, expanding to 483.31 TMT (27.50% share) by 2030, anchored by Hero MotoCorp, Bajaj Auto and TVS fleets requiring JASO MA2/MB formulations, supporting high-margin individually packaged retail lubricant sales across a 225 million-unit active fleet.
Passenger cars and utility vehicles represent the fastest-growing vehicle segment, expanding from 190.08 TMT (12.80% share) in 2025 to 254.84 TMT (14.50% share) by 2030, anchored by Maruti Suzuki, Hyundai India and Tata Motors fleets requiring API SP and ILSAC GF-6A formulations, supported by expanding private car ownership and high urban annual distances.
Crankcase Engine Oils
Mineral base formulations remain the largest single category at 1,002.37 TMT (67.55% share) in 2025, but stagnate at a negative 0.01% annual growth rate through 2030 (57.00% share), sustained by cost-sensitive commercial bazaar trade and older two-wheeler parc segments resistant to premium formulation migration.
Semi-synthetic blends expand from 334.13 TMT (22.50% share) in 2025 to 492.10 TMT (28.00% share) by 2030, an 8.05% annual growth rate, driven directly by BS-VI Phase II requirements for 10W-30 and 15W-40 formulations meeting Low-SAPS aftertreatment compatibility standards.
Full synthetic formulations, though the smallest base stock category at 148.50 TMT (9.95% share) in 2025, exhibit the fastest growth trajectory at 12.16% annual volume growth, reaching 263.62 TMT (15.00% share) by 2030, driven by CAFE III compliance requirements for 0W-16 and 0W-20 low-viscosity oils.
By Geography
North Zone
The North Zone leads Indian regional consumption as part of the combined North and West zones controlling nearly 60% of national volume, anchored by the heavy agricultural tractor fleet across the Indo-Gangetic basin generating substantial seasonal demand for Universal Tractor Transmission Oils during post-monsoon Kharif and Rabi harvest cycles.
West Zone
The West Zone sustains year-round demand for high-viscosity-index fleet lubricants, driven by heavy commercial freight traffic linking industrial centers in Gujarat and Maharashtra to deep-water ports, anchoring the nation's core inter-state logistics corridor lubricant demand.
South Zone
The South Zone displays the highest regional consumption of high-tier passenger car motor oils and synthetic motorcycle lubricants, supported by high per-capita vehicle ownership in urban centers including Bengaluru, Chennai and Hyderabad, reflecting the region's more premiumized formulation mix.
East and North-East Zone
The East and North-East Zone accounted for 210.87 TMT (14.20% share, contracting to 14.00% by 2030) of national volume in 2025, driven by heavy-duty mining transport demand in Odisha and Jharkhand and East-West logistics corridors, despite a lower baseline of personal vehicle ownership relative to other zones.
How Competition Is Evolving
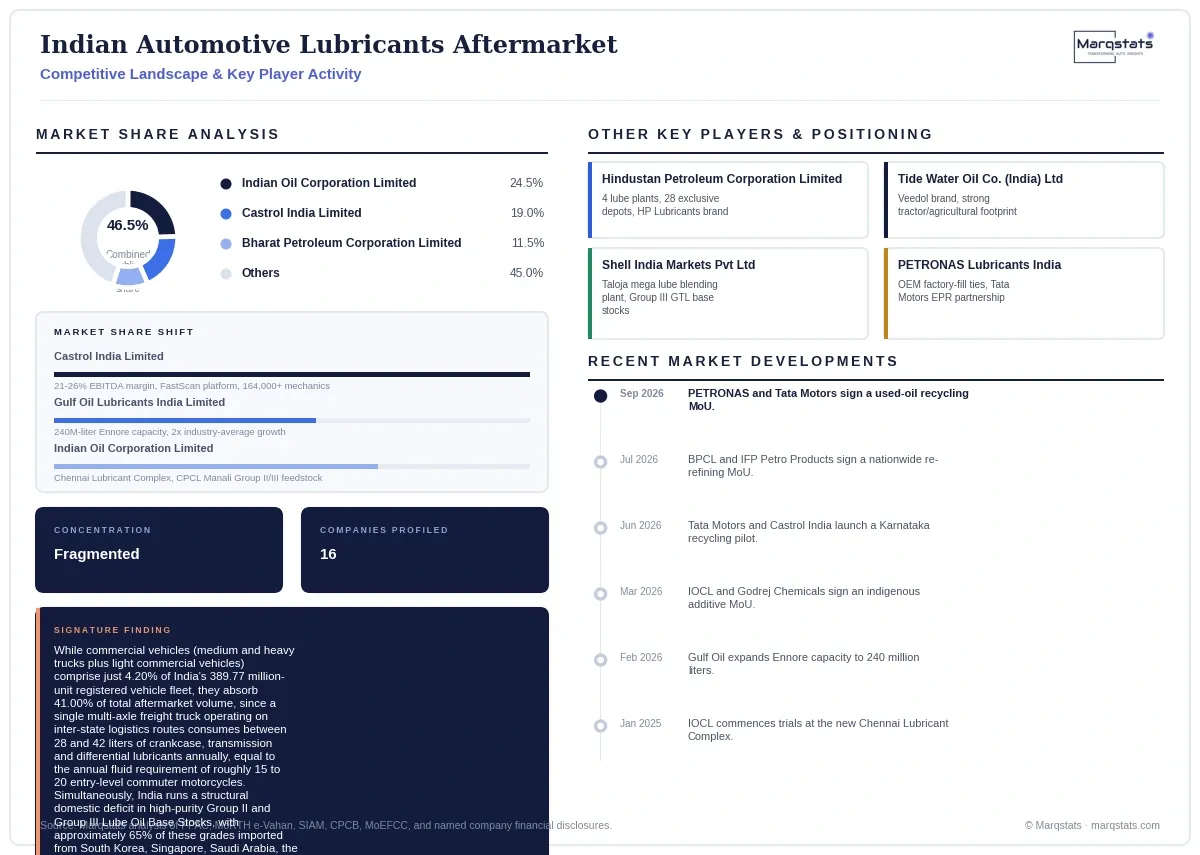
The competitive structure of India's automotive lubricants aftermarket features a clear divide: public-sector Maharatna Oil Marketing Companies, Indian Oil Corporation Limited, Bharat Petroleum Corporation Limited and Hindustan Petroleum Corporation Limited, control roughly 46.50% of total aftermarket volume through upstream refining integration and extensive fuel retail forecourts, while private multinational and domestic blenders including Castrol India, Gulf Oil and Tide Water Oil lead in the independent bazaar trade, high-end passenger vehicle segments, and mechanic loyalty programs.
Firms compete differently by tier: Indian Oil Corporation Limited maintains the largest individual volume share through its SERVO brand, supported by integrated base oil units at Haldia and Gujarat and large institutional fleet contracts, Castrol India Limited maintains retail bazaar leadership through its FastScan mechanic engagement platform generating an operating EBITDA margin between 21% and 26%, and Gulf Oil Lubricants India pursues a volume-driven expansion strategy achieving growth at twice the underlying market rate by securing commercial vehicle fleet accounts and OEM factory partnerships.
The most significant recent competitive-landscape development is the wave of used-oil circularity partnerships launched across 2025 and 2026 to satisfy Central Pollution Control Board Extended Producer Responsibility mandates, exemplified by PETRONAS Lubricants India and Tata Motors signing a memorandum of understanding in September 2026 for structured collection and recycling of used automotive lubricants, establishing a closed-loop pilot across commercial vehicle service networks in Maharashtra and Tamil Nadu.
Companies Covered
Companies covered in the report include:
Recent Market Activity
Table of Contents
Coverage & Segmentation
Coverage spans the Indian automotive lubricants aftermarket, isolating the addressable automotive replacement layer from total petroleum product consumption, industrial processing fluids, and OEM factory-fill volume procured directly by automotive manufacturers. The market is sized in thousand metric tonnes and INR Crore/USD billion across a 2021-2025 historical period and a 2026-2030 forecast period, with 2025 as the base year. Three segmentation dimensions are quantified: vehicle category, functional product category, and base stock formulation.
Excluded from scope: OEM factory-fill applications installed at vehicle assembly plants, industrial and process lubricants including metalworking fluids, turbine oils and transformer oils, and marine lubricants. A separate Marqstats study addresses the global automotive lubricants aftermarket on a comparable basis.