Market Snapshot
Middle bar: base-year value × (1 + CAGR), rounded to two decimals. This is a calculated illustration, not a separately researched annual estimate.
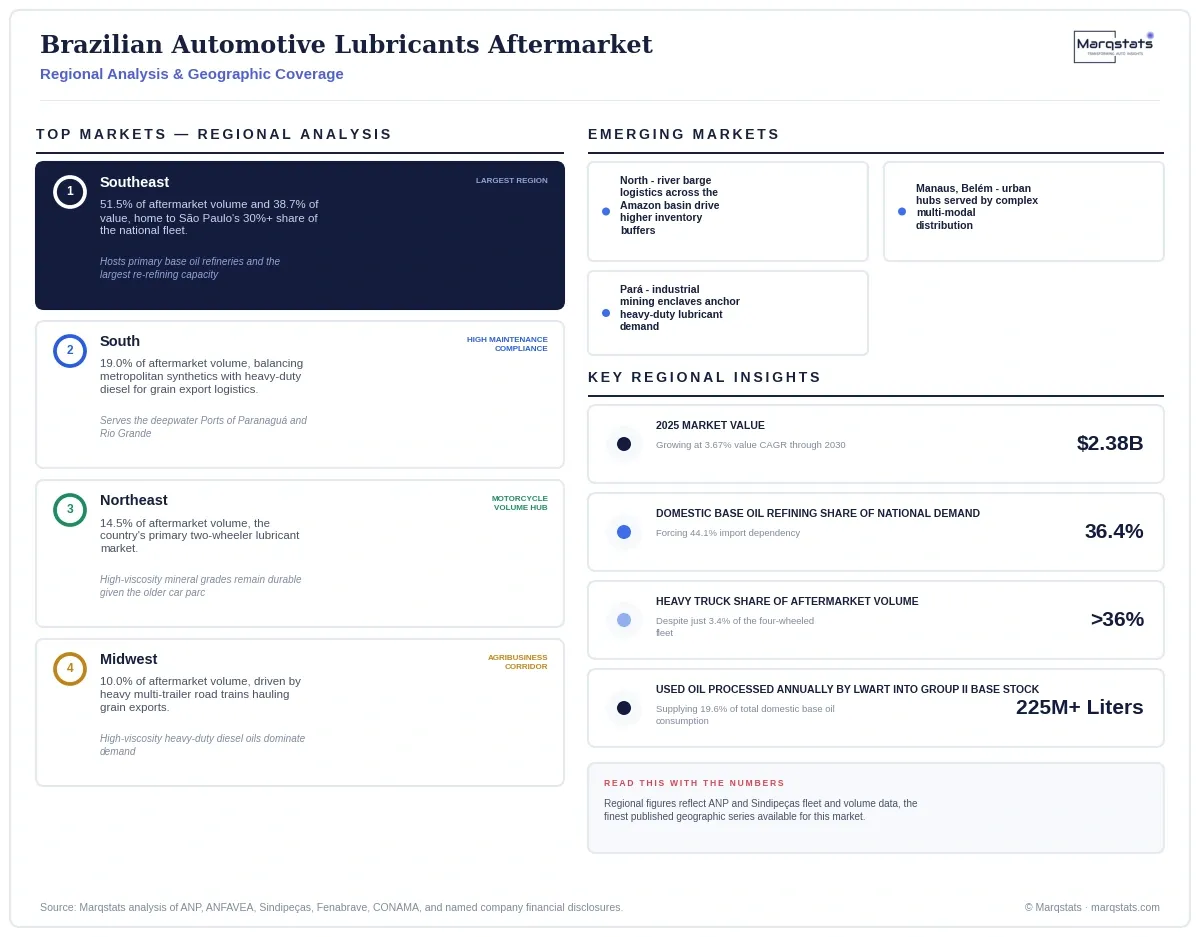
The Brazilian automotive lubricants aftermarket generated USD 2.38 billion in 2025. Market value is projected to reach USD 2.85 billion by 2030 from USD 2.38 billion in 2025 — a 3.67% CAGR and an absolute increase of USD 0.47 billion — even as Brazil's own domestic base oil refineries satisfy only 36.4% of national demand, forcing blenders to import 44.1% of base stocks (751,469 cubic meters, USD 489 million) primarily from the United States, South Korea, Bahrain and Qatar, while a domestic re-refining circular economy anchored by Lwart Soluções Ambientais supplies the remaining 19.6% by converting more than 225 million liters of collected used crankcase oil annually into Group II base stocks, providing blenders a currency-hedged, statutorily mandated alternative to volatile virgin imports.
Finished lubricating oil consumption in Brazil reached 1,524,596 cubic meters in 2025, an annual volume expansion of 1.6% relative to 2024, according to consolidated regulatory data from the National Agency of Petroleum, Natural Gas and Biofuels. Automotive formulations, including internal combustion engine oils and auxiliary fluids such as transmission fluids, gear oils, hydraulic fluids, greases and brake fluids, absorb approximately 63.5% of this volume. The commercial automotive aftermarket replacement segment specifically, excluding OEM factory-fill, reached approximately 883,000 cubic meters valued at USD 2.38 billion in 2025.
The market's defining structural finding is a genuine technological imbalance between upstream base oil refining capacity and downstream specification mandates. Brazilian domestic petroleum refineries, led by Petrobras' Duque de Caxias Refinery producing Group I paraffinic base stocks almost exclusively, satisfy only 36.4% of national base oil demand. Because Group I base oils carry elevated sulfur content and lower viscosity indexes, they cannot be used to blend modern API SP, ILSAC GF-6, or Low-SAPS API CK-4 formulations required by Proconve L7/L8 and P8 emissions standards. This structural limitation forces blenders to import 44.1% of national base oil supply, exposing the market to foreign exchange fluctuations and maritime shipping rates. Brazil's statutory reverse logistics mandate for used lubricating oil provides a genuine offset: Lwart Soluções Ambientais alone processes over 225 million liters of collected waste oil annually into Group II re-refined base stocks, supplying 19.6% of total domestic base oil consumption.
Key Takeaways
Market Overview & Analysis
Report Summary
This analysis sizes the Brazilian automotive lubricants aftermarket, encompassing internal combustion engine oils, manual and automatic transmission fluids, hypoid gear oils, hydraulic power steering fluids, greases and brake fluids consumed as commercial replacement volume across the operational four-wheeled and two-wheeled vehicle parc. The market explicitly excludes OEM factory-fill volumes delivered at vehicle assembly, industrial, marine and other non-automotive lubricant applications. The market is sized in cubic meters and USD billion across a 2021-2025 historical period and a 2026-2030 forecast period, with 2025 as the base year.
The Brazilian automotive lubricants aftermarket generated USD 2.38 billion on 883,000 cubic meters of replacement volume in 2025. By 2030, physical volume is projected to expand to 1,026,000 cubic meters, a 3.05% compound annual growth rate, while market value expands to USD 2.85 billion, a 3.67% compound annual growth rate. This value premium over volume growth reflects fleet modernization: tightening emissions baselines and complex powertrain tolerances are compelling workshops to shift from legacy mineral formulations to higher-margin semi-synthetic and fully synthetic fluids required by Proconve L7, L8 and P8 standards.
The Baseline Projection Scenario assumes Brazilian GDP expands at 1.8% to 2.3% annually with flex-hybrid vehicles scaling steadily across the light fleet while pure battery-electric vehicles remain under 2% of the operating parc, yielding 1,026,000 cubic meters (3.05% volume CAGR) and USD 2.85 billion (3.67% value CAGR) by 2030. The Accelerated Value Growth Scenario, reaching 1,105,000 cubic meters (4.58% volume CAGR) and USD 3.20 billion (6.10% value CAGR), is triggered if real GDP growth exceeds 3.0% annually alongside stricter ANP enforcement and rapid Proconve L8 phase-in boosting synthetic formulation penetration above 60% in the passenger segment. The Constrained Growth Scenario, reaching only 945,000 cubic meters (1.36% volume CAGR) and USD 2.45 billion (0.58% value CAGR), is triggered if GDP growth slows below 1.0% annually alongside currency depreciation elevating imported base oil costs, pushing consumers to extend drain intervals and down-trade to entry-level mineral grades.
Market Dynamics
Key Drivers
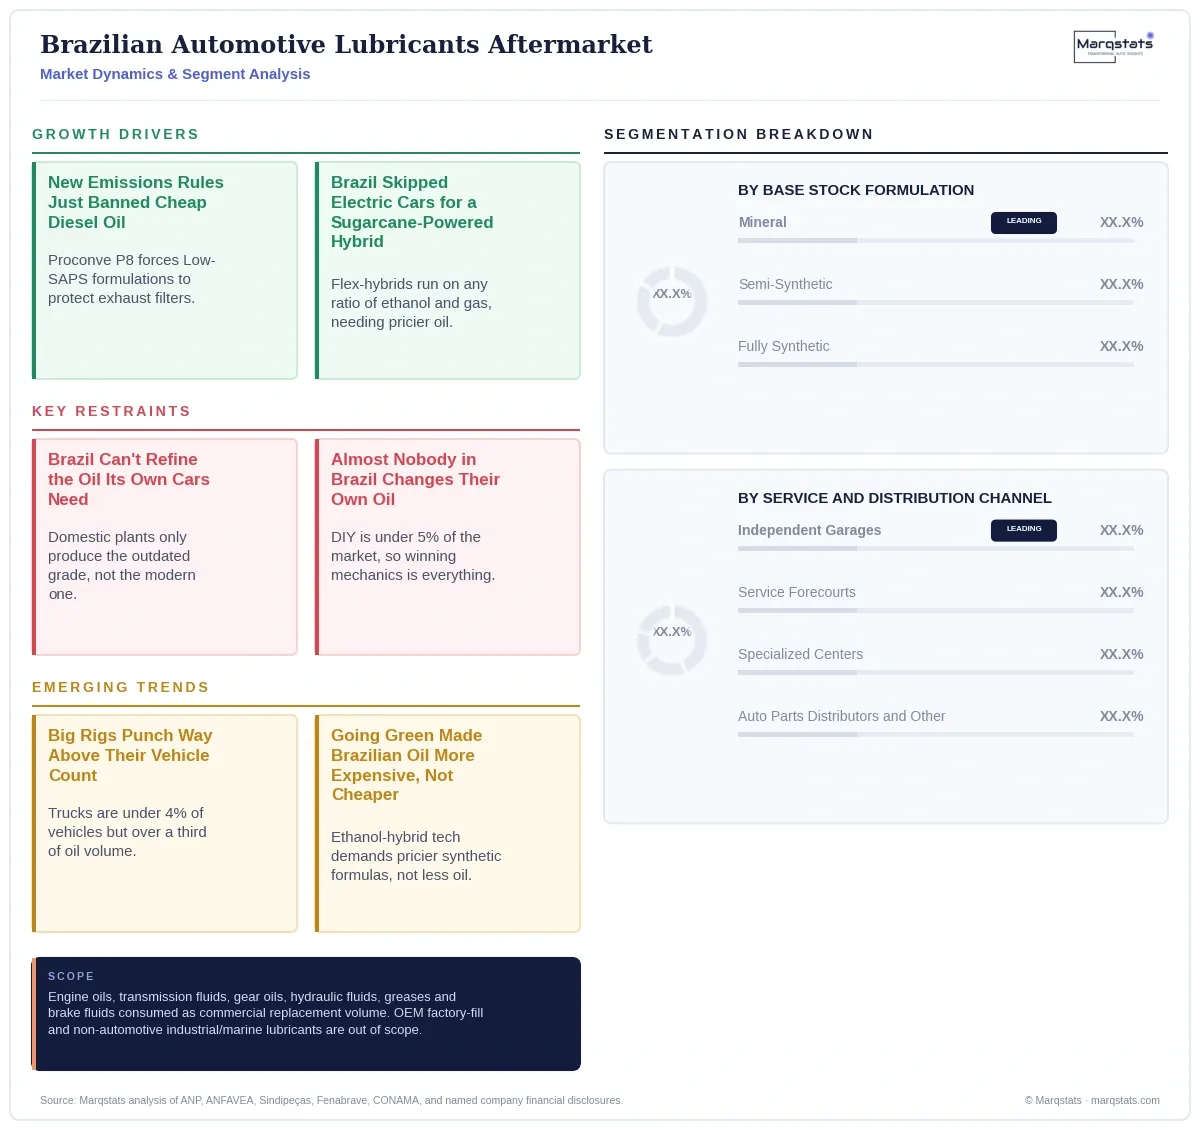
- Statutory emissions mandates anchor baseline reformulation demand, exemplified by Proconve P8, introduced 1 January 2023 as Brazil's equivalent to Euro VI, mandating Low-SAPS chemical limits across heavy commercial diesel fleets to prevent sulfated ash from blinding Diesel Particulate Filter honeycomb channels, accelerating the obsolescence of legacy API CI-4 and CH-4 oils in favor of API CK-4 and ACEA E6/E9 formulations.
- Brazil's unique flex-fuel hybrid powertrain strategy is elevating value density per liter of replacement fluid, exemplified by major manufacturers including Stellantis, Toyota, Volkswagen and General Motors directing local capital expenditure toward flex-hybrid engine programs engineered to run on any ratio of hydrous ethanol and gasoline, requiring advanced low-viscosity SAE 0W-16 and 0W-20 synthetic formulations to resist water emulsification and acidic corrosion from ethanol's water content.
- The domestic circular re-refining economy is scaling to meaningfully offset import exposure, exemplified by Lwart Soluções Ambientais completing performance validation of its expanded re-refining complex in Lençóis Paulista, São Paulo in June 2026, establishing the facility as the second-largest Group II re-refinery globally with production capacity exceeding 240 million liters per year of circular EcoBase stock.
- Retail fuel distributors are defending point-of-service relationships by expanding branded quick-lube micro-franchise networks, exemplified by Vibra Energia's Lubrax+ centers, Ipiranga's Jet Oil network operated by Iconic, and Raízen's Shell Helix Oil Change bays, converting fuel forecourt footprint into dedicated fluid service capacity as complex underbody shields and electronic oil reset protocols push motorists toward specialized centers.
- Major distributors are actively restructuring corporate architecture to capture lubricant growth specifically, exemplified by Vibra Energia establishing a dedicated business unit for its Lubrax brand in November 2025, reporting a 33% year-over-year increase in net profit for full-year 2025 with lubricants explicitly cited as a strategic growth pillar and record sales volume in the Lubrax brand's history.
Key Restraints
- Brazil's domestic base oil refineries, concentrated almost entirely in Group I paraffinic and naphthenic chemistries, cannot blend modern API SP, ILSAC GF-6 or Low-SAPS API CK-4 formulations, since Group I base oils carry elevated sulfur content, lower viscosity indexes and high evaporative loss, structurally compelling blenders to import 44.1% of national base oil supply and exposing the market to foreign exchange fluctuations and maritime shipping rate volatility.
- Because oil changes in Brazil remain an installer-executed operation, with the Do-It-Yourself segment representing less than 5% of total volume due to disposal regulations and limited consumer interest, commercial strategies must focus entirely on winning point-of-service repair professionals rather than direct-to-consumer retail channels, a structurally different go-to-market requirement than markets with meaningful DIY penetration.
- Flex-hybrid powertrains subject crankcase oil to genuine chemical stress, since frequent engine stop-start transitions during urban driving prevent the crankcase oil from maintaining optimal operating temperatures, inhibiting thermal evaporation of accumulated moisture, and because hydrous ethanol contains up to 7% water by volume, unburned fuel blow-by can cause oil dilution and water emulsification, accelerating acidic corrosion and thinning hydrodynamic oil films.
- Regional logistics in Brazil's North region depend on complex river barge networks across the Amazon basin outside urban centers like Manaus and Belém, requiring distributors to maintain higher local inventory buffers against extended transit times and high freight costs, a structural distribution constraint that does not apply across the more logistically connected Southeast and South regions.
Key Trends
- The finding that heavy freight trucks comprise just 3.4% of Brazil's circulating four-wheeled vehicles yet absorb more than 36% of automotive aftermarket lubricant volume demonstrates that Class 8-equivalent diesel engines with 28-to-42-litre crankcase sumps function as the volumetric backbone of the Brazilian industry even as passenger vehicles dominate unit counts.
- The consistency between Brazil's flex-hybrid powertrain strategy, directed by major manufacturers including Stellantis, Toyota, Volkswagen and General Motors, and rising synthetic formulation penetration projected to surpass 50% of passenger car motor oil volume by 2030 demonstrates that Brazil's unique ethanol-compatible electrification pathway is elevating lubricant value density per liter rather than reducing aftermarket demand the way pure battery-electric transitions do in other major automotive markets.
- The finding that Brazil's re-refining sector, anchored by Lwart Soluções Ambientais processing over 225 million liters of used oil annually, already supplies 19.6% of total domestic base oil consumption indicates that circular base oil capacity represents a genuine, statutorily mandated structural hedge against import volatility rather than a niche sustainability initiative.
- The fact that the top five finished lubricant distributors command slightly over 70% of total national volume, while independent multi-brand repair shops representing 43.5% of aftermarket volume make brand selection decisions primarily through mechanic recommendation rather than consumer choice, demonstrates that winning technician relationships at approximately 100,000 independent repair shops is the primary commercial battleground in this market, not conventional consumer retail marketing.
- The finding that Brazil's electrified vehicle share of the circulating fleet reached just 1.4% in 2025, with pure battery-electric vehicles representing less than 0.5% of total circulating vehicles, while flex-hybrid vehicles combining electric powertrains with ethanol-compatible internal combustion engines represent the dominant medium-term transition pathway, indicates that Brazil's automotive electrification trajectory is structurally distinct from China, Western Europe or North America and will not produce comparable aftermarket lubricant volume contraction through 2030.
Strategic Implications
For a market entrant, competing directly against the consolidated top-five distributors commanding over 70% of national volume presents substantial structural barriers given entrenched mechanic relationships and jobber distribution networks; capital is better directed toward specialized flex-hybrid-compatible synthetic formulations, direct supply agreements with Brazil's approximately 100,000 independent repair shops, or securing re-refined Group II base stock offtake agreements with processors like Lwart Soluções Ambientais to hedge against import cost volatility.
For an established lubricant blender or distributor, managing the structural Group I-to-Group II/III chemistry transition requires accelerating hydroprocessing investment or securing long-term re-refined base stock supply agreements ahead of continued Proconve L8 phase-in through 2027, while expanding branded quick-lube micro-franchise networks following the model demonstrated by Vibra's Lubrax+ and Iconic's Jet Oil to defend point-of-service relationships as service station forecourts face competition from specialized independent centers.
For an upstream refiner or re-refining investor, addressing Brazil's structural 44.1% base oil import dependency requires prioritizing domestic hydrocracking capacity investment to produce Group II and Group III cuts locally, following the model of scaling circular re-refining capacity demonstrated by Lwart's expansion to over 240 million liters annually, since currency-hedged domestic base stock supply provides a genuine competitive advantage against blenders exposed to United States, South Korean, Bahraini and Qatari import volatility.
Outlook
Baseline Projection Scenario: 1,026,000 cubic meters by 2030 (3.05% five-year volume CAGR) and USD 2.85 billion (3.67% five-year value CAGR). This trajectory assumes Brazilian GDP expands at 1.8% to 2.3% annually, flex-hybrid vehicles scale steadily across the light fleet while pure battery-electric vehicles remain under 2% of the operating parc, Proconve P8 heavy commercial vehicles expand to represent approximately 38% of circulating diesel trucks, and the circulating four-wheeled fleet expands at 1.6% annually to 52.8 million units.
Accelerated Value Growth Scenario: 1,105,000 cubic meters by 2030 (4.58% five-year volume CAGR) and USD 3.20 billion (6.10% five-year value CAGR). The specific trigger is real GDP growth exceeding 3.0% annually, driving freight transport activity and accelerating commercial vehicle renewal, combined with stricter ANP and environmental enforcement reducing the sale of sub-standard mineral oils, rapid Proconve L8 phase-in accelerating the retirement of older vehicles, and synthetic formulation penetration surpassing 60% in the passenger segment.
Constrained Growth Scenario: 945,000 cubic meters by 2030 (1.36% five-year volume CAGR) and USD 2.45 billion (0.58% five-year value CAGR). The specific trigger is GDP growth slowing below 1.0% annually, accompanied by currency depreciation that elevates the cost of imported virgin Group II and Group III base oils, prompting consumers and fleet operators to extend oil drain intervals and postpone non-essential fluid changes, pushing the average age of the four-wheeled fleet past 12.5 years.
Market Segmentation
Heavy trucks generate the single largest volume share at 320,000 cubic meters annually despite comprising just 2.24 million units (3.4% of the four-wheeled fleet), since long-haul diesel tractors operate crankcase sump capacities of 28 to 42 litres with four drain cycles per year under severe operating conditions logging 80,000 to 150,000 kilometers annually, requiring SAE 15W-40, 10W-40 and 5W-30 formulations meeting API CK-4, CJ-4 and CI-4 standards.
Passenger cars generate 215,000 cubic meters annually across a 38.8 million-unit fleet, with average sump capacities of 3.5 to 4.5 litres and 1.3 drain cycles per year, requiring SAE 5W-30, 0W-20 and 10W-40 formulations meeting API SP/SN and ACEA A3/B4 specifications as Brazil's flex-hybrid powertrain transition elevates demand for low-viscosity synthetic grades.
Motorcycles represent the fastest-expanding segment in fluid replacement volume, generating 131,000 cubic meters annually across an 18.0 million-unit fleet with 6.5 drain cycles per year, the highest replacement frequency of any vehicle category, driven by high-revolution engine operation and shared crankcase, transmission and wet-clutch oil requiring dedicated four-stroke JASO MA/MA2 lubricants changed every 1,500 to 3,000 kilometers.
Mineral
Independent multi-brand mechanical repair shops represent the primary fluid dispensing channel, accounting for 43.5% of aftermarket volume across an estimated 100,000 repair shops nationwide, with brand selection heavily driven by mechanics who prioritize brand reputation, ease of acquisition from local parts jobbers, and technical formulation approvals.
Service station forecourts and associated oil change bays represent 21.0% of aftermarket volume, historically the dominant retail venue for passenger vehicle oil changes, now facing competition from specialized independent shops as complex underbody shields and electronic oil reset protocols encourage motorists toward dedicated service centers, prompting fuel distributors to expand branded quick-lube micro-franchises including Lubrax+, Jet Oil and Shell Helix Oil Change.
Specialized lube shops and tire/suspension autocenters represent 15.0% of replacement volume and exhibit the fastest growth trajectory among physical retail formats, utilizing drive-over pits and hydraulic hoists alongside digital cross-referencing catalogs matching OEM vehicle identification numbers to correct lubricant formulations, achieving high sales penetration of high-margin synthetic and semi-synthetic products.
By Geography
Southeast
The Southeast region, comprising São Paulo, Rio de Janeiro, Minas Gerais and Espírito Santo, represents the core of the market, accounting for 51.5% of aftermarket volume and 38.7% of total market value, concentrating the nation's primary base oil production assets at Petrobras REDUC, the largest re-refining capacity at Lwart in São Paulo, and the headquarters of Iconic, Vibra and Moove, with the state of São Paulo alone accounting for more than 30% of Brazil's circulating four-wheeled fleet.
South
The South region, comprising Paraná, Santa Catarina and Rio Grande do Sul, absorbs 19.0% of aftermarket volume, featuring high vehicle density per capita and advanced agricultural mechanization, with fluid demand balanced between passenger vehicle synthetics in metropolitan Curitiba and Porto Alegre and heavy-duty diesel engine oils supporting export grain transport toward the deepwater Ports of Paranaguá and Rio Grande.
Northeast
The Northeast region accounts for 14.5% of aftermarket volume, serving as the country's primary volume hub for motorcycles given lower passenger car density and severe two-wheeler duty cycles providing essential personal mobility and rural transport, sustaining durable demand for high-viscosity mineral grades including SAE 20W-50 and 15W-40 across elevated ambient temperatures and an older average passenger car fleet.
Midwest
The Midwest region, comprising Mato Grosso, Goiás, Mato Grosso do Sul and the Federal District, accounts for 10.0% of aftermarket volume, driven by agribusiness export supply chains generating heavy consumption of commercial transport lubricants, with fleet demand concentrated in heavy multi-trailer road trains hauling grains across unpaved and highway corridors requiring high-viscosity heavy-duty diesel oils and universal tractor transmission oils.
North
The North region consumes 5.0% of national aftermarket volume, shaped by complex geography where product transport outside urban centers like Manaus and Belém relies on river barge networks across the Amazon basin, requiring distributors to maintain higher local inventory buffers against extended transit times, with demand divided between urban motorcycle fleets, marine diesel lubricants and heavy-duty lubricants for industrial mining enclaves in Pará.
How Competition Is Evolving
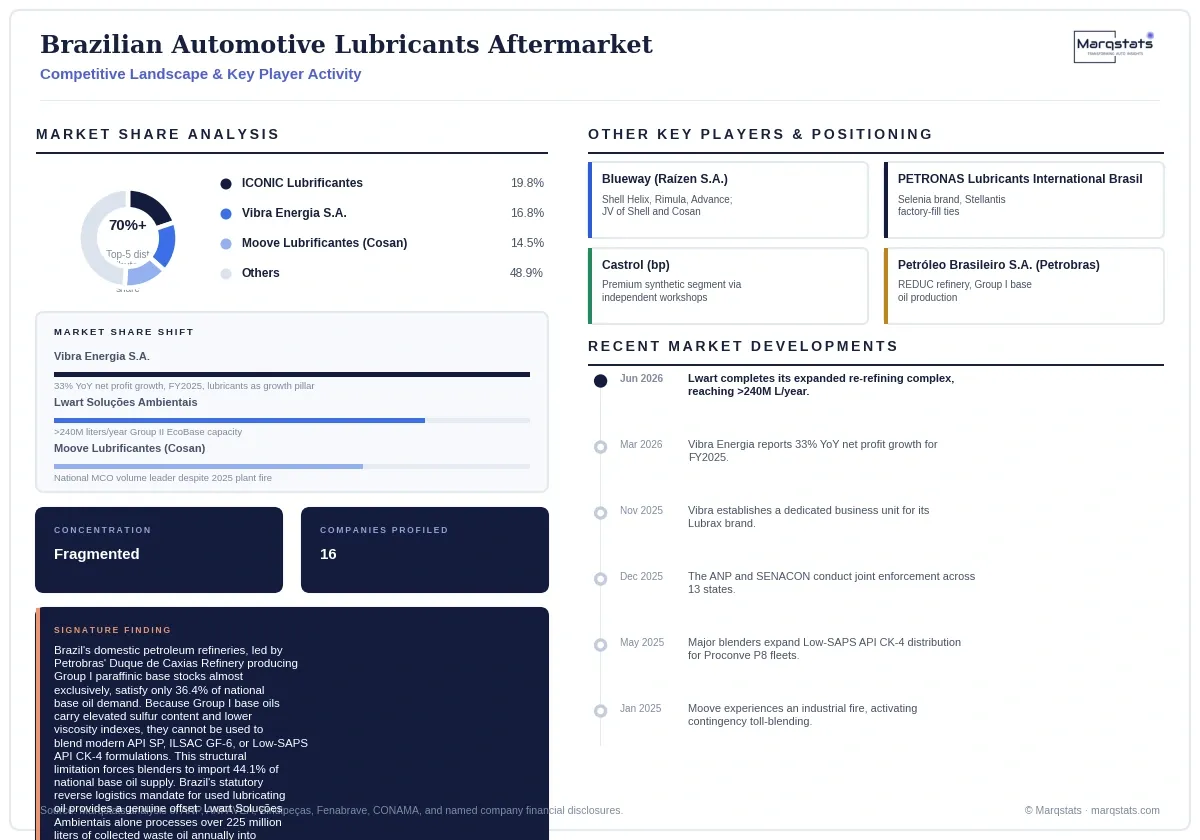
The manufacturing and distribution of finished lubricants in Brazil is characterized by high concentration at the blending tier, with the five largest finished lubricant distributors commanding slightly over 70% of total national volume; ICONIC Lubrificantes leads at approximately 19.8%, followed by Vibra Energia at 16.8%, Moove at 14.5%, Blueway (Raízen) at 11.2%, and PETRONAS Lubricants International at 8.7%, with the remaining 29.0% distributed among Castrol, TotalEnergies, FUCHS and regional independent blenders.
Firms compete differently by tier: consolidated distributors leverage fuel forecourt networks and branded quick-lube micro-franchises to defend point-of-service relationships, exemplified by Iconic's more than 6,000 Ipiranga service stations and 1,700 Jet Oil bays, while OEM-aligned blenders including PETRONAS compete on factory-fill and dealership channel ties through supply relationships with manufacturers like Stellantis, and independent regional blenders compete on cost-sensitive mineral and semi-synthetic products distributed through local auto parts jobbers.
The most significant recent competitive-landscape development is Vibra Energia's establishment of a dedicated business unit for its Lubrax brand in November 2025 to manage supply chain logistics, support international expansion into South and Central America, and grow direct-to-workshop digital sales, followed by full-year 2025 results reported in March 2026 showing a 33% year-over-year increase in net profit with lubricants explicitly cited as a strategic growth pillar.
Companies Covered
Companies covered in the report include:
Recent Market Activity
Table of Contents
Coverage & Segmentation
Coverage spans the Brazilian automotive lubricants aftermarket, encompassing internal combustion engine oils, manual and automatic transmission fluids, hypoid gear oils, hydraulic power steering fluids, greases and brake fluids consumed as commercial replacement volume across the operational four-wheeled and two-wheeled vehicle parc. The market is sized in cubic meters and USD billion across a 2021-2025 historical period and a 2026-2030 forecast period, with 2025 as the base year. Three segmentation dimensions are quantified: vehicle category, base stock formulation, and service and distribution channel.
Excluded from scope: OEM factory-fill volumes delivered at vehicle assembly, industrial lubricants, marine bunkering lubricants, and non-automotive process oils. A separate Marqstats study addresses the global automotive lubricants aftermarket on a comparable basis.
