Market Snapshot
Middle bar: base-year value × (1 + CAGR), rounded to two decimals. This is a calculated illustration, not a separately researched annual estimate.
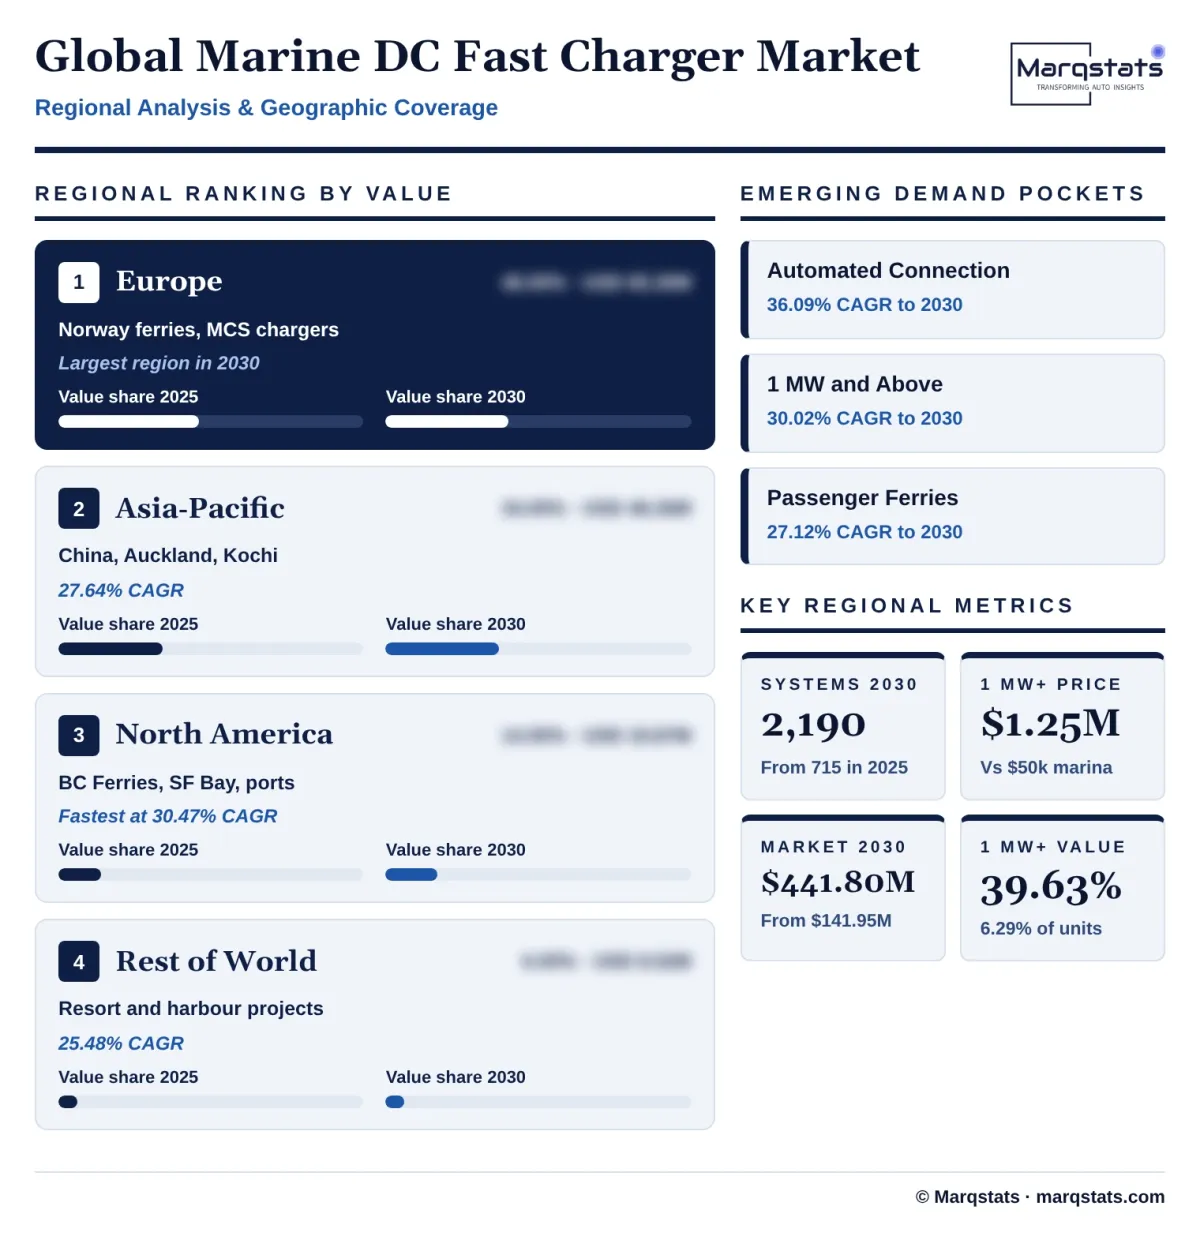
The global marine DC fast charger market size is estimated at USD 141.95 million in 2025 and is projected to reach USD 441.80 million by 2030, growing at a CAGR of 25.49% over 2026 – 2030. Annual installations rise from about 715 charging systems to 2,190, a 25.09% annual rate, as electric ferries, water taxis, workboats and leisure boats need fast, reliable shore charging.
Marqstats defines the market as the delivered equipment value of shore-side DC and megawatt-class charging systems rated 50 kW and above that charge the propulsion batteries of vessels, including power cabinets, dispensers, plug-in and automated connection devices, cable management and integrated shore battery buffers. AC pedestals below 50 kW, AC shore power for hotel loads at berth, onboard batteries, grid connections and civil works are excluded.
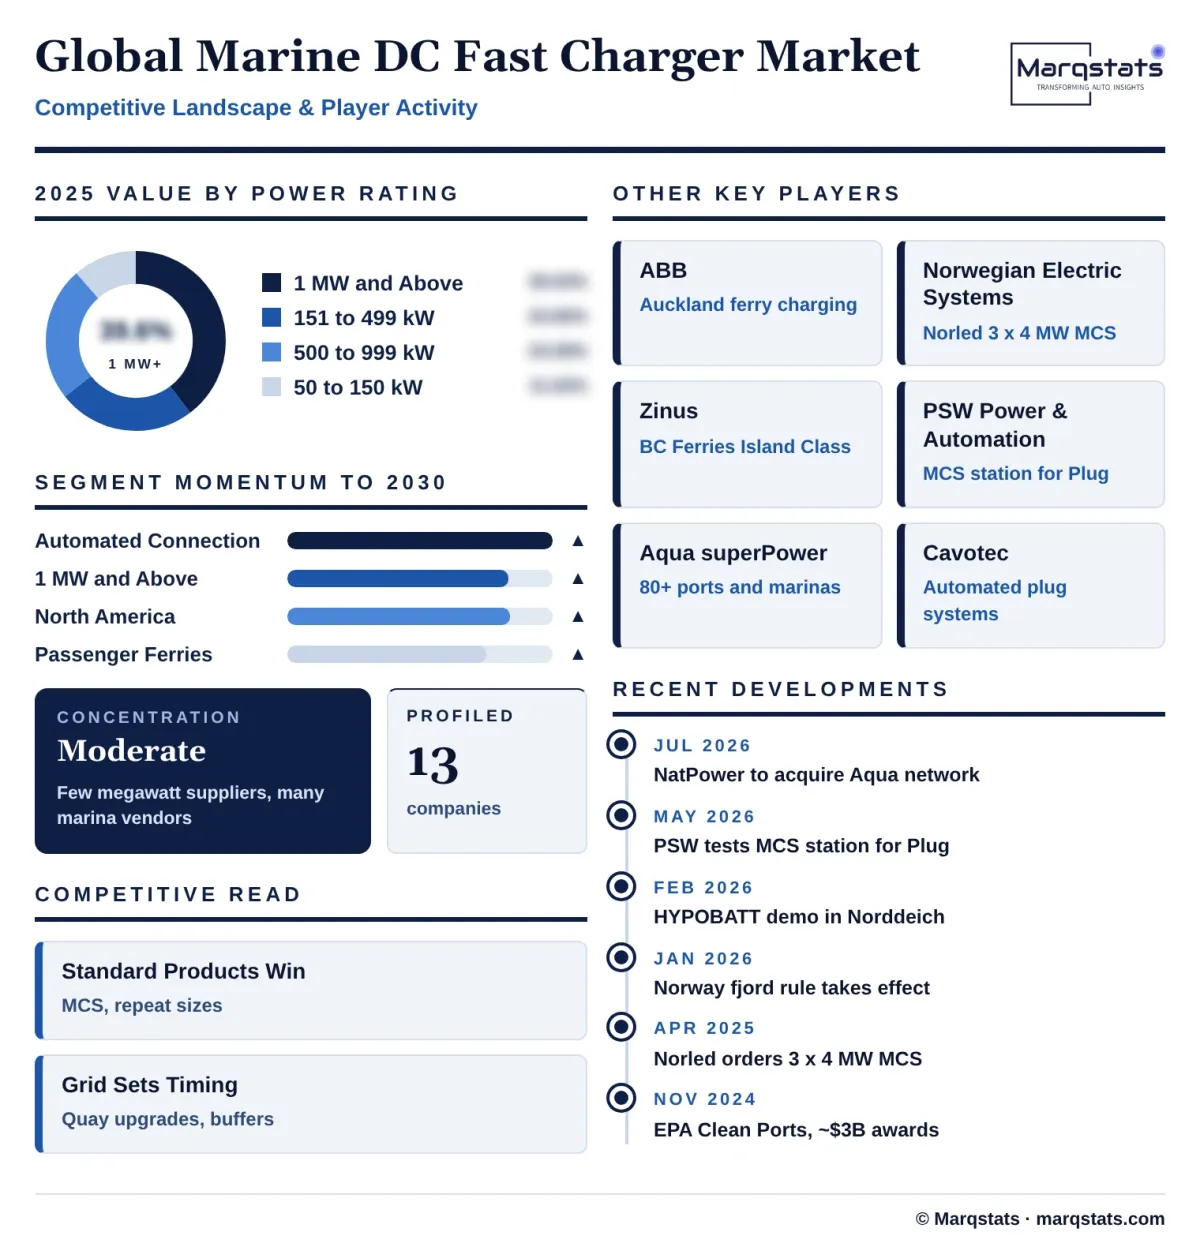
Systems of 1 MW and above account for an estimated 39.63% of 2025 value and Europe for 46.00%. Manual plug-in systems account for 72.00% of value. The study segments the market by power rating, vessel application, connection type and region.
Key Takeaways
Market Overview & Analysis
Report Summary
Marqstats sizes the marine DC fast charger market as the delivered equipment value of shore-side charging systems of 50 kW and above that charge vessel propulsion batteries. In 2025 about 715 such systems were installed worldwide, worth an estimated USD 141.95 million at an average of about USD 198,500 per system.
Electric vessels need very different chargers from cars. A car ferry crossing a Norwegian fjord may have only five to ten minutes at the quay to recover the energy used on the crossing, so it needs several megawatts of power delivered through a connection that works in wind, waves and tides. A water taxi or electric hydrofoil needs 100 kW to 500 kW to recharge during a lunch break, while a leisure boat in a marina can charge overnight but its owner still wants a fast top-up before a trip.
The market therefore spans four power classes. Chargers of 50 kW to 150 kW serve marinas, small water taxis and workboats. Chargers of 151 kW to 499 kW serve hydrofoils, tour boats and fast passenger craft. Chargers of 500 kW to 999 kW serve commuter ferries and crew transfer vessels. Systems of 1 MW and above serve car and Ro-Pax ferries and larger passenger ferries, and include automated plug towers, charging arms and Megawatt Charging System connectors.
Demand follows the electric fleet. The Maritime Battery Forum ship register passed 2,000 battery-powered ships in operation or on order in October 2026, with passenger vessels, including car ferries, the largest group at 570 ships. Every fully electric vessel on a fixed route needs at least one shore charger, and many ferry routes need one at each end.
The market grew from about USD 45.00 million in 2021 to USD 62.00 million in 2022, USD 84.00 million in 2023 and USD 112.00 million in 2024, a 33.27% annual rate from 2021 to 2025. Growth came from Norwegian car ferry routes, Chinese river and lake ferries, the first marina fast-charging networks in Europe and North America and the first electric hydrofoil fleets.
Regulation shapes demand in each region. Norway has made zero emission mandatory for smaller passenger ships in its World Heritage fjords from 2026, and Norwegian county ferry tenders have required electric operation on most short crossings for several years. The European Union requires shore power at major ports from 2030. In the United States, grants rather than mandates drive orders, because California is not enforcing the zero-emission standards for in-use short-run ferries, while the EPA Clean Ports Program pays for port electrification. Classification societies such as DNV set rules for shore connections and battery safety that every commercial charging system must meet.
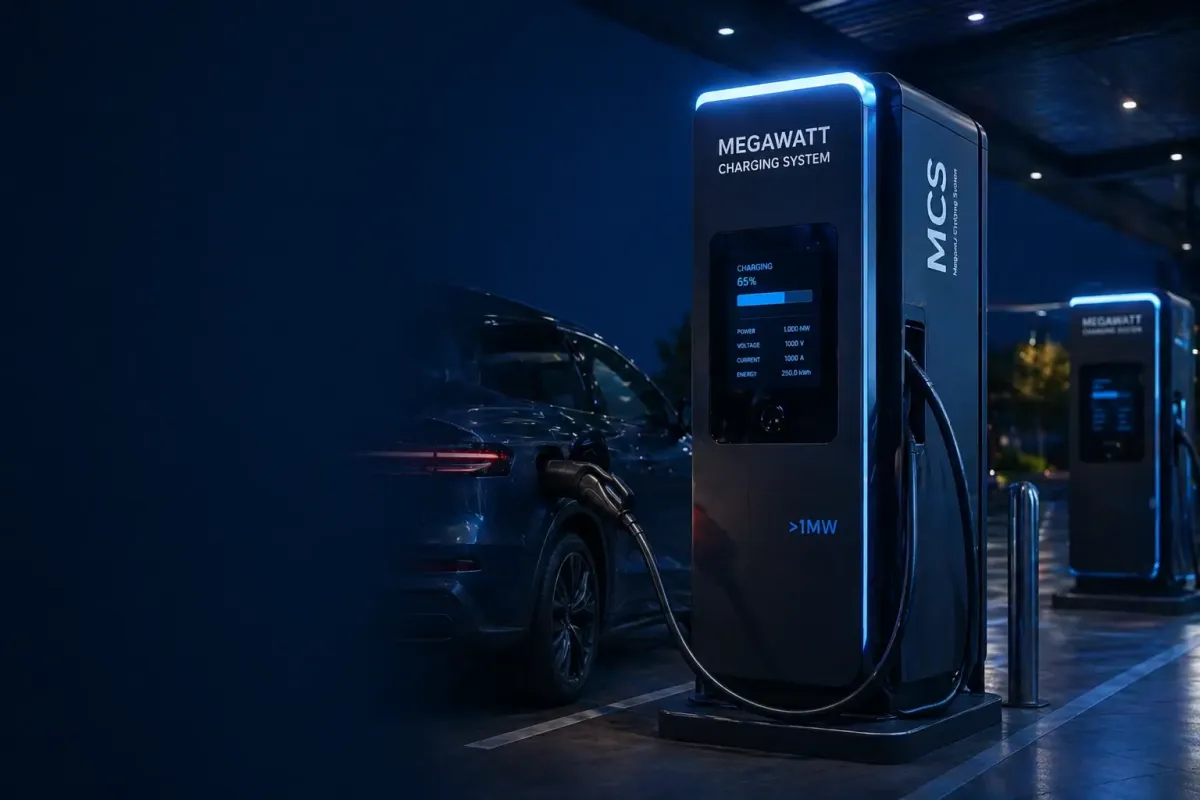
The Megawatt Charging System is becoming the common connector for large vessels. Developed by CharIN for heavy trucks, MCS delivers several megawatts through a single plug. Ferry operators adopted it because it lets them buy standard chargers rather than custom systems, and because vessels from different shipyards can use the same quay equipment. Norled ordered three 4 MW MCS chargers in 2025, and PSW Power & Automation completed factory testing of an MCS charging station with energy storage for Plug in May 2026.
Marina charging is a separate business. Leisure boats need fast top-ups at many sites rather than repeated megawatt charging at one quay. Aqua superPower built a network of DC chargers of up to 350 kW, typically 150 kW, which it installs at no cost to marinas and owns and operates. NatPower Marine agreed to acquire the network in July 2026, when it covered more than 80 ports and marinas in Europe and North America, combining it with its own plans for marine charging hubs.
Global Marine DC Fast Charger Market Size and Forecast
The global marine DC fast charger market grows from USD 141.95 million in 2025 to USD 441.80 million in 2030, a CAGR of 25.49%. Marqstats expects about 880 systems worth USD 178.00 million in 2026, 1,100 worth USD 225.00 million in 2027, 1,380 worth USD 285.00 million in 2028, 1,750 worth USD 358.00 million in 2029 and 2,190 worth USD 441.80 million in 2030.
Price per system varies by a factor of about 25. A 50 kW to 150 kW marina charger costs about USD 50,000 in 2025, a 151 kW to 499 kW charger about USD 140,000, a 500 kW to 999 kW system about USD 380,000 and a system of 1 MW and above about USD 1.25 million. The Norled order for three 4 MW MCS chargers worth about NOK 40 million, or about EUR 3.4 million, works out at about USD 1.28 million per station. Prices in each class fall by about 10% to 16% by 2030, but the average rises slightly, from about USD 198,500 to USD 201,700, because more megawatt systems are installed.
Projects under way support the forecast. Norled expects its three MCS chargers to be installed by the end of 2026 for routes from Stokkvagen to Lovund and Traena from 2027. Auckland Transport is building charging of up to 3 MW at the Downtown Ferry Terminal, with piers 4 and 5 in 2026 and completion expected in mid-2027. Zinus is supplying shore charging towers and onboard units for four BC Ferries Island Class vessels, and San Francisco Bay Ferry has a USD 12.5 million state grant for a charging float with energy storage at Harbor Bay.
Public money and rules set the timing of large orders. Norway requires zero emission for passenger ships below 10,000 gross tonnage in its World Heritage fjords from 1 January 2026. In the United States, the EPA Clean Ports Program announced nearly USD 3 billion of awards in November 2024, and 53 projects in 26 states and territories are now being carried out, several with vessel charging. The European Union requires shore power at major ports from 2030 under the Alternative Fuels Infrastructure Regulation.
Marqstats tracks four indicators to monitor the forecast: electric ferry and workboat orders and delivery dates, port and transit grant awards, utility connection times at ferry quays, and the number of public marina fast chargers in operation.
The mix of systems shifts toward high power and automation. Systems of 1 MW and above rise from 39.63% to 47.31% of value, automated connection from 28.00% to 42.00% and passenger ferries and water taxis from 30.00% to 32.00%. Chargers of 50 kW to 150 kW fall from 11.62% to 8.56% of value even though their number nearly triples, because their price per unit is low and falling. North America rises from 14.00% to 17.00% and Asia-Pacific from 34.00% to 37.00%, while Europe falls from 46.00% to 40.00% but still grows at 22.03% a year.
Shore batteries change the cost of a site. A ferry quay with a weak grid can either pay for a new substation or install a battery that charges from the grid between departures and discharges into the vessel at several megawatts. The second option often costs less and is faster to build, which is why integrated buffers are included in this market, while the grid connection and civil works are excluded.
Market Dynamics
Key Drivers
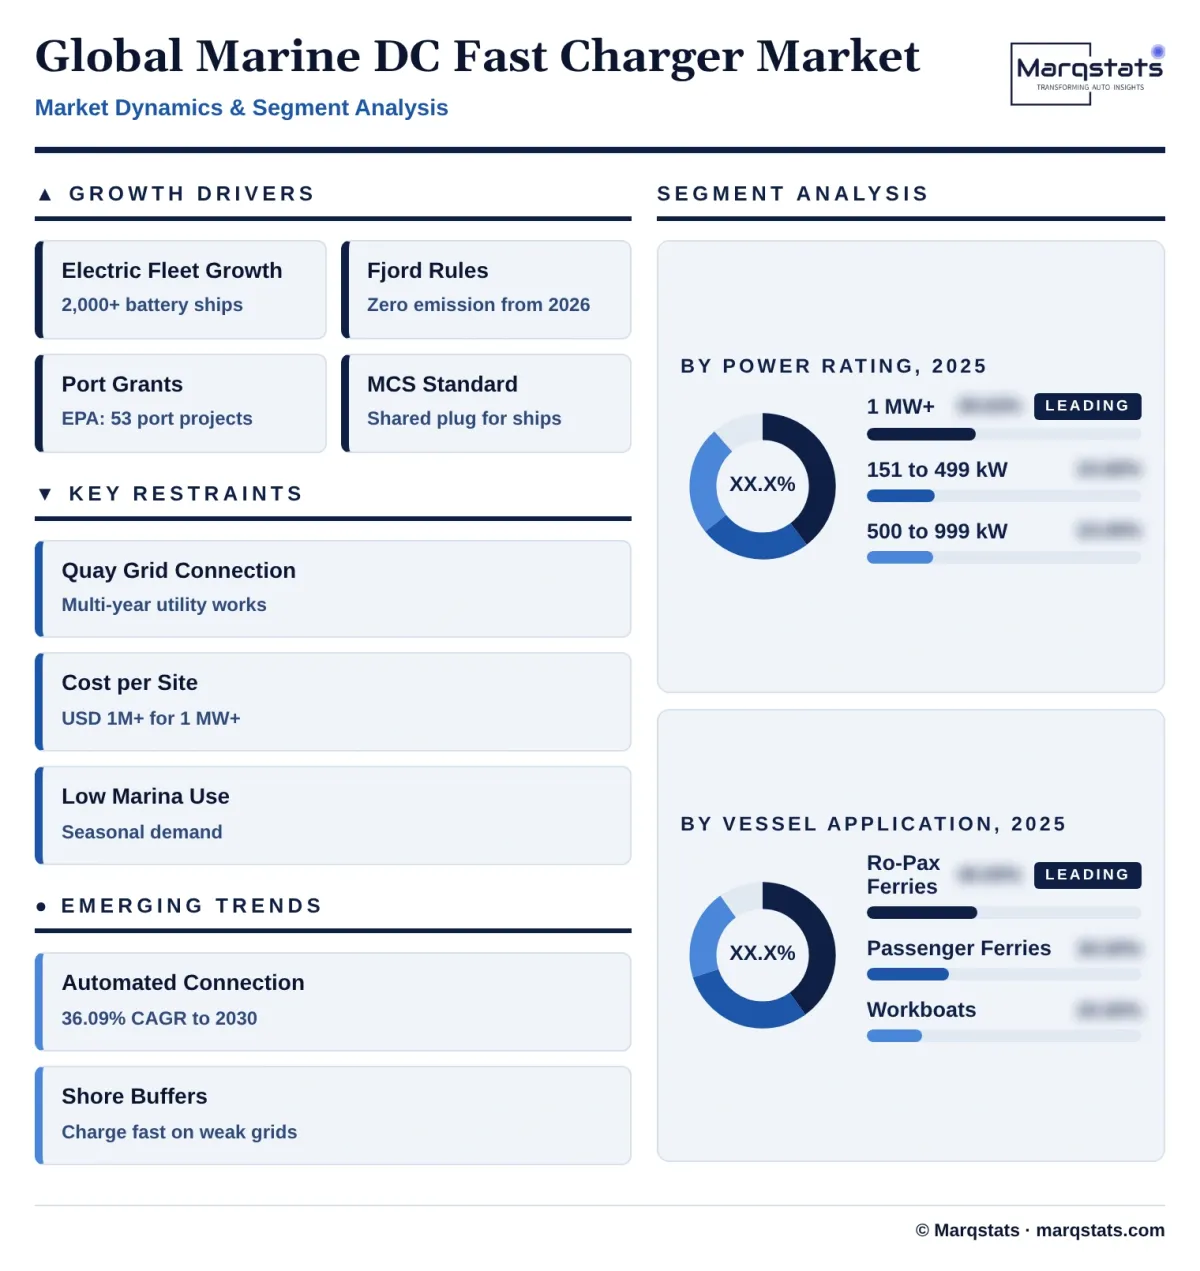
Six forces are pushing ports, ferry operators and marinas to install high-power DC charging for electric vessels.
- Growth of the electric fleet. Every electric ferry, water taxi, hydrofoil and workboat on a fixed route needs shore charging, and the battery ship register passed 2,000 vessels in operation or on order in October 2026.
- Zero-emission rules in sensitive waters. Norway requires passenger ships below 10,000 gross tonnage to run without emissions in its World Heritage fjords from 2026, and public ferry tenders in Norway, Denmark and Sweden increasingly require zero-emission operation.
- Port and transit funding. The EPA Clean Ports Program, US federal ferry grants, state grants in California and public budgets in Norway, New Zealand and Canada pay for shore charging alongside new vessels.
- Megawatt Charging System standards. MCS gives ships the same connector family as heavy trucks, so chargers can be built in volume and vessels from different yards can use the same quay equipment.
- Marina charging networks. Network operators such as Aqua superPower install chargers at marinas at no cost to the marina and earn revenue from charging, which lowers the barrier for leisure boat owners.
- Lower energy cost than diesel. Operators that charge at night or from shore batteries buy electricity at a fraction of the cost per mile of marine diesel, which justifies the charger investment on busy routes.
Key Restraints
Four constraints slow how quickly marine fast chargers are ordered, connected and used.
- Grid connection at the quay. Ferry chargers of several megawatts need new substations or cable upgrades, and utility work at harbours can take several years, delaying new routes and charger orders.
- High cost per site. A megawatt ferry charger with its connection device costs more than USD 1 million before civil and grid works, and many operators depend on grants to fund it.
- Marine environment and safety rules. Salt water, tides, waves and fire safety rules for batteries require marine-grade cabinets, cable handling and class approval, which raises cost and lengthens projects.
- Low use at marinas. Leisure boats are used mostly in summer and at weekends, so public marina chargers often see low utilisation outside peak season, which slows network roll-out.
Key Trends
Four shifts are changing how marine fast chargers are designed, sold and operated.
- Megawatt Charging System for ships. Ferry projects are moving from custom plugs to MCS connectors, as in the Norled order and the Plug charging station, and CharIN is developing marine MCS guidance with shipyards and suppliers.
- Automated connection at ferry quays. Charging towers, robotic arms and plug systems that connect automatically when a ferry docks are becoming standard on high-frequency routes, as on the BC Ferries Island Class.
- Shore batteries built into chargers. Integrated storage lets operators charge vessels at several megawatts from weaker grid connections, as in the PSW Power & Automation station for Plug and the Candela buffer in Stockholm.
- Network consolidation in marinas. Owners of marina chargers are merging into larger networks, as with the NatPower Marine agreement for Aqua superPower, to offer one app and one tariff to boat owners.
Strategic Implications
- For charger makers, standard products win over custom projects. Suppliers that offer MCS-compatible, class-approved chargers in repeatable sizes, with automated connection options, will win most ferry tenders and keep project costs down.
- For ferry operators and transit agencies, charging should be ordered with the vessels. Planning the grid connection, the charger and any shore battery at the same time as the ferries avoids boats waiting for shore power.
- For ports and utilities, the grid connection is the critical path. Early agreements on substation capacity, and shore batteries that limit peak demand, shorten the time from vessel order to service.
- For marina owners, network partners lower the cost of entry. Revenue-sharing models in which a network installs and runs the charger let marinas offer fast charging without capital spending.
- For investors, contracted ferry projects and network scale are the key signals. Suppliers with orders tied to funded ferry routes and marina networks with many sites offer the most visible growth, while timing depends on grid connections and grant awards.
- For regulators, clear deadlines and shared standards bring orders forward. Norway's fjord rule and the move to MCS show that fixed dates and common connectors give operators and suppliers the certainty to invest.
Market Segmentation
Chargers of 50 kW to 150 kW account for 11.62% of 2025 value, USD 16.50 million and about 330 units, rising to USD 37.80 million by 2030, an 18.03% CAGR, while their share falls to 8.56%. They serve marinas, small water taxis and workboats, such as the 150 kW charger Okaya supplied for the Kochi Water Metro.
Chargers of 151 kW to 499 kW account for 24.66% of 2025 value, USD 35.00 million and about 250 units, rising to USD 96.00 million by 2030, a 22.36% CAGR. Electric hydrofoils, tour boats and fast leisure boats use this class, and marina networks typically install 150 kW to 350 kW DC units.
Systems of 500 kW to 999 kW account for 24.09% of 2025 value, USD 34.20 million and about 90 units, rising to USD 99.00 million by 2030, a 23.69% CAGR. Commuter ferries, crew transfer vessels and harbour tugs use this class.
Systems of 1 MW and above account for 39.63% of 2025 value, USD 56.25 million, from only about 45 units, and grow fastest among power classes, at 30.02% a year, to USD 209.00 million and 47.31% of 2030 value. Car ferries in Norway, Denmark and Canada and larger passenger ferries in Auckland and San Francisco use this class, with power of up to 9 MW at the busiest quays.
Chargers for car and Ro-Pax ferries account for 40.00% of 2025 value, USD 56.78 million, rising to USD 181.14 million by 2030, a 26.11% CAGR, and 41.00% of the market. Norway has the largest fleet of battery car ferries, and Bastø Fosen uses 9 MW charging for its large electric ferries across the Oslofjord.
Chargers for passenger-only ferries, water taxis and hydrofoils account for 30.00% of 2025 value, USD 42.59 million, and grow fastest among applications, at 27.12% a year, to USD 141.38 million and 32.00% of 2030 value, as hydrofoil fleets in Norway, India, Thailand and the Maldives and catamaran fleets in Kochi, Auckland and San Francisco enter service.
Chargers for crew transfer vessels, tugs, pilot boats, aquaculture boats and inland cargo vessels account for 20.00% of 2025 value, USD 28.39 million, rising to USD 75.11 million by 2030, a 21.48% CAGR, while their share falls to 17.00%. China leads in electric inland cargo vessels.
Fast chargers for leisure boats in marinas account for 10.00% of 2025 value, USD 14.19 million, rising to USD 44.17 million by 2030, a 25.50% CAGR, and keep a 10.00% share. Networks such as Aqua superPower install DC chargers of up to 350 kW in marinas in Europe and North America.
Systems connected by crew with a plug and cable account for 72.00% of 2025 value, USD 102.20 million, rising to USD 256.24 million by 2030, a 20.18% CAGR, while their share falls to 58.00%. Marinas, water taxis and vessels with long dwell times use manual connection.
Automated charging towers, robotic arms and plug systems account for 28.00% of 2025 value, USD 39.75 million, and grow fastest, at 36.09% a year, to USD 185.56 million and 42.00% of 2030 value. Ferries that charge for a few minutes at every stop need connection within seconds, without crew lifting heavy cables.
By Geography
Europe
Europe is the largest market, with 46.00% of 2025 value, USD 65.30 million, rising to USD 176.72 million by 2030, a 22.03% CAGR, while its share falls to 40.00%. Norway leads, with zero-emission rules in its World Heritage fjords from January 2026, MCS ferry chargers for Norled and Plug, and electric car ferries on most short fjord crossings. Denmark, Sweden, Finland, Germany and the Netherlands add ferry and inland charging, and the HYPOBATT project demonstrated multi-megawatt charging at Norddeich in Germany in February 2026.
Asia-Pacific
Asia-Pacific accounts for 34.00% of 2025 value, USD 48.26 million, and grows at 27.64% a year to USD 163.47 million and 37.00% of 2030 value. China had more than 440 electric ships at the end of 2024, mostly ferries and tour boats, and is adding electric inland cargo vessels. Auckland is building up to 3 MW of ferry charging at its Downtown Ferry Terminal, the Kochi Water Metro charges at its terminals, and Candela hydrofoil orders in Mumbai, Thailand and the Maldives will need new chargers.
North America
North America accounts for 14.00% of 2025 value, USD 19.87 million, and grows fastest, at 30.47% a year, to USD 75.11 million and 17.00% of 2030 value. BC Ferries is putting automated charging on its Island Class routes, San Francisco Bay Ferry has a USD 12.5 million grant for a charging float at Harbor Bay, Washington State Ferries is electrifying its terminals and the EPA Clean Ports Program funds port electrification. California is not enforcing the zero-emission standards for in-use short-run ferries, so grants rather than mandates drive US orders.
Rest of World
The rest of the world accounts for 6.00% of 2025 value, USD 8.52 million, rising to USD 26.50 million by 2030, a 25.48% CAGR, with resort, harbour and lake projects in the Middle East, Latin America and Africa, often supplied as packages with electric vessels.
How Competition Is Evolving
The marine DC fast charger market is moderately concentrated at the high-power end and fragmented at the low-power end. A small group of electrical and port equipment suppliers, including ABB, Siemens, Wartsila, Norwegian Electric Systems, PSW Power & Automation, Cavotec, Zinus and Stemmann-Technik, delivers most megawatt ferry charging systems, while many smaller companies supply marina and workboat chargers.
Two business models compete. Ferry charging is sold as an engineering project, often with the vessel electrical system, the grid connection and the connection device in one contract. Marina charging is increasingly sold as a network service, in which an operator such as Aqua superPower installs and owns the charger and earns revenue per kWh.
Connection devices are a separate battleground. Cavotec, Zinus and Stemmann-Technik make automated plug and cable handling systems that let ferries connect without crew, and these devices can be a large part of the cost of a ferry charging station.
Competition will be decided by standard products, grid know-how and service. Suppliers that offer MCS-compatible chargers in standard sizes, can design shore batteries to work around weak grids and provide long-term service contracts will win the growing number of ferry and port tenders.
Order activity shows where suppliers are scaling. Norwegian Electric Systems holds the Norled MCS order and supplied about 5 MW charging stations to Fjord1 for the Hareid to Sulesund crossing, ABB was selected as the charging supplier for the Auckland Downtown Ferry Terminal, Zinus is supplying the BC Ferries Island Class, and PSW Power & Automation built the MCS station for Plug. Cavotec raised its order intake by 49.6% to EUR 109.1 million in the first half of 2026, mostly from shore power for ships, which builds its base for ferry charging.
Marina networks compete on coverage. Aqua superPower, now being acquired by NatPower Marine, runs one of the largest cross-border networks of marine fast chargers, while boat builders such as Candela pair their vessels with chargers and storage from partners such as Atlas Copco, and Okaya and other Indian suppliers serve water metro and ferry projects in Asia.
Companies Covered
Companies covered in the report include:
Recent Market Activity
Table of Contents
Coverage & Segmentation
The study covers the global marine DC fast charger market, with 2025 as the base year, 2021 – 2025 as the historical period and 2026 – 2030 as the forecast period. Values are in US dollars at delivered equipment prices, and volumes are annual installations of charging systems. The market includes shore-side DC and megawatt-class chargers of 50 kW and above for vessel propulsion batteries, with power cabinets, dispensers, plug-in and automated connection devices, cable management and integrated shore battery buffers. Euro figures are converted at a 2025 average of USD 1.13 per euro.
AC pedestals below 50 kW, AC shore power for hotel loads of ships at berth, onboard batteries and vessel electrical systems, grid connections, substations, civil works and electricity sales are excluded. Vessels themselves are covered in the Marqstats Global Electric Passenger Ferry and Global Electric and Hybrid Boat and Ship reports, which exclude shore charging, so the figures do not overlap. Segment and regional splits are Marqstats estimates built on project disclosures, supplier orders, public grant awards and equipment price benchmarks.