Market Snapshot
Middle bar: base-year value × (1 + CAGR), rounded to two decimals. This is a calculated illustration, not a separately researched annual estimate.
The global peer-to-peer EV charger sharing market size is estimated at USD 232.80 million in 2025 and is projected to reach USD 645.00 million by 2030, growing at a CAGR of 22.61% over 2026 – 2030. The number of privately owned chargers listed for shared use rises from about 180,000 to 1.22 million, a 46.63% annual rate, so market value per shared charger falls from about USD 1,293 to USD 529 a year.
Marqstats defines the market as the revenue earned by platforms that let owners of private chargers, including households, apartment buildings, workplaces and small businesses, rent access to other EV drivers. It covers booking commissions, software subscriptions paid by hosts and building managers, and fees for access hardware and integration services. The electricity value kept by hosts, public charge point operator networks, roaming hubs that serve only public networks and the sale of chargers themselves are excluded.
Single-family homes account for 62.00% of 2025 value and Level 2 chargers for 75.00%. Europe accounts for 42.00% of 2025 value and North America for 32.00%. The study segments the market by host environment, power rating, revenue stream and region.
Key Takeaways
Market Overview & Analysis
Report Summary
Marqstats sizes the peer-to-peer EV charger sharing market as the revenue earned by platforms that connect owners of private chargers with other drivers. In 2025 about 180,000 chargers were listed for shared use worldwide, generating an estimated USD 232.80 million in platform commissions, software subscriptions and hardware and integration fees, or about USD 1,293 per shared node.
The model fills a gap in public charging. About 32.8% of UK households, roughly 9 million, have no driveway, according to Zapmap, and about 20% of UK EV drivers have no home charger. Public charging costs several times more than home electricity: public slow and fast chargers in the UK cost around 50 to 55 pence per kWh and rapid chargers around 75 to 80 pence in 2026, against roughly 25 to 27 pence under the household price cap and under 10 pence on overnight EV tariffs. A host who buys electricity at an off-peak rate and lists a charger at 30 to 40 pence per kWh can undercut public networks and still earn a margin.
Hosts, drivers and platforms each play a part. A host lists a charger in an app, sets availability and price, and receives payment after each session. A driver searches the map, books a slot and pays the platform. The platform handles identity checks, booking, payment, ratings and in some cases insurance, and keeps a commission on each booking. Building managers and workplaces pay monthly software fees for access control, load management and resident billing. Charger makers and integrators earn fees for connecting chargers to booking platforms through cloud links or smart plugs.
The market started with community apps and has moved towards platform partnerships. Co Charger and JustPark's JustCharge built UK host networks, EVmatch built a shared and reservable network in California, Bolt.Earth built a large network of low-cost chargers in India, and Monta, Zaptec and Wallbox added sharing and access features to charger software. Fleet card provider Allstar began giving its fleet drivers access to Co Charger hosts in 2025, and Zapmap shows community chargers alongside public networks in its route planner.
Sharing remains small relative to the home charging base. Zapmap estimated about 1.4 million home chargers in the UK at the end of 2025, against about 6,700 Co Charger hosts and just over 4,000 JustCharge hosts in June 2026, and estimated that community charging is used by just under 1% of EV drivers. The opportunity is large, but conversion of home chargers into active shared chargers is still low.
A University College London study by Zhang and Cao, published in Frontiers in Sustainable Cities in February 2026, interviewed 16 UK hosts in June 2025. Hosts reported small and irregular earnings, concerns about trust, liability and privacy, and difficulty coordinating with drivers, and one reported fewer than one booking every three months. These findings explain why value per node falls as networks grow, and why platforms are turning to fleets, building managers and route planners for steadier demand.
Regulation shapes how sharing works. In the United Kingdom, the Electric Vehicles (Smart Charge Points) Regulations 2021 require new home and workplace chargers to be smart, which makes remote access and metering easier. In the European Union, the Alternative Fuels Infrastructure Regulation (EU) 2023/1804 sets payment and price transparency rules for publicly accessible chargers, and Germany's calibration law requires certified meters for billing by the kWh. In India, the Ministry of Power treats setting up charging stations as an activity that does not need an electricity licence, which lowers barriers for small hosts.
Global Peer-to-Peer EV Charger Sharing Market Size and Forecast
The global peer-to-peer EV charger sharing market grows from USD 232.80 million in 2025 to USD 645.00 million in 2030, a CAGR of 22.61%. Marqstats estimates the market at USD 103.50 million in 2021, USD 128.90 million in 2022, USD 158.00 million in 2023 and USD 192.50 million in 2024, and expects USD 285.20 million in 2026, USD 351.40 million in 2027, USD 432.90 million in 2028 and USD 530.80 million in 2029.
Shared nodes grow faster than value. Marqstats estimates about 18,500 shared nodes in 2021, 180,000 in 2025 and 1.22 million in 2030, a 46.63% annual rate over the forecast. Value per node falls from about USD 5,595 in 2021 to USD 1,293 in 2025 and USD 529 in 2030. The fall reflects a change in mix, not falling prices: early nodes were mainly apartment and workplace chargers whose owners paid software fees, while most new nodes are driveway chargers that hosts list for occasional use.
Driveway hosts earn small amounts. Marqstats estimates a typical active driveway host earns a margin of around 15 to 25 pence per kWh, so a session of 20 to 25 kWh earns only a few pounds, consistent with the University College London finding of small and irregular earnings. Many listed chargers are booked only a few times a month, and some are rarely booked. Platform revenue per driveway node therefore stays low even as total bookings grow.
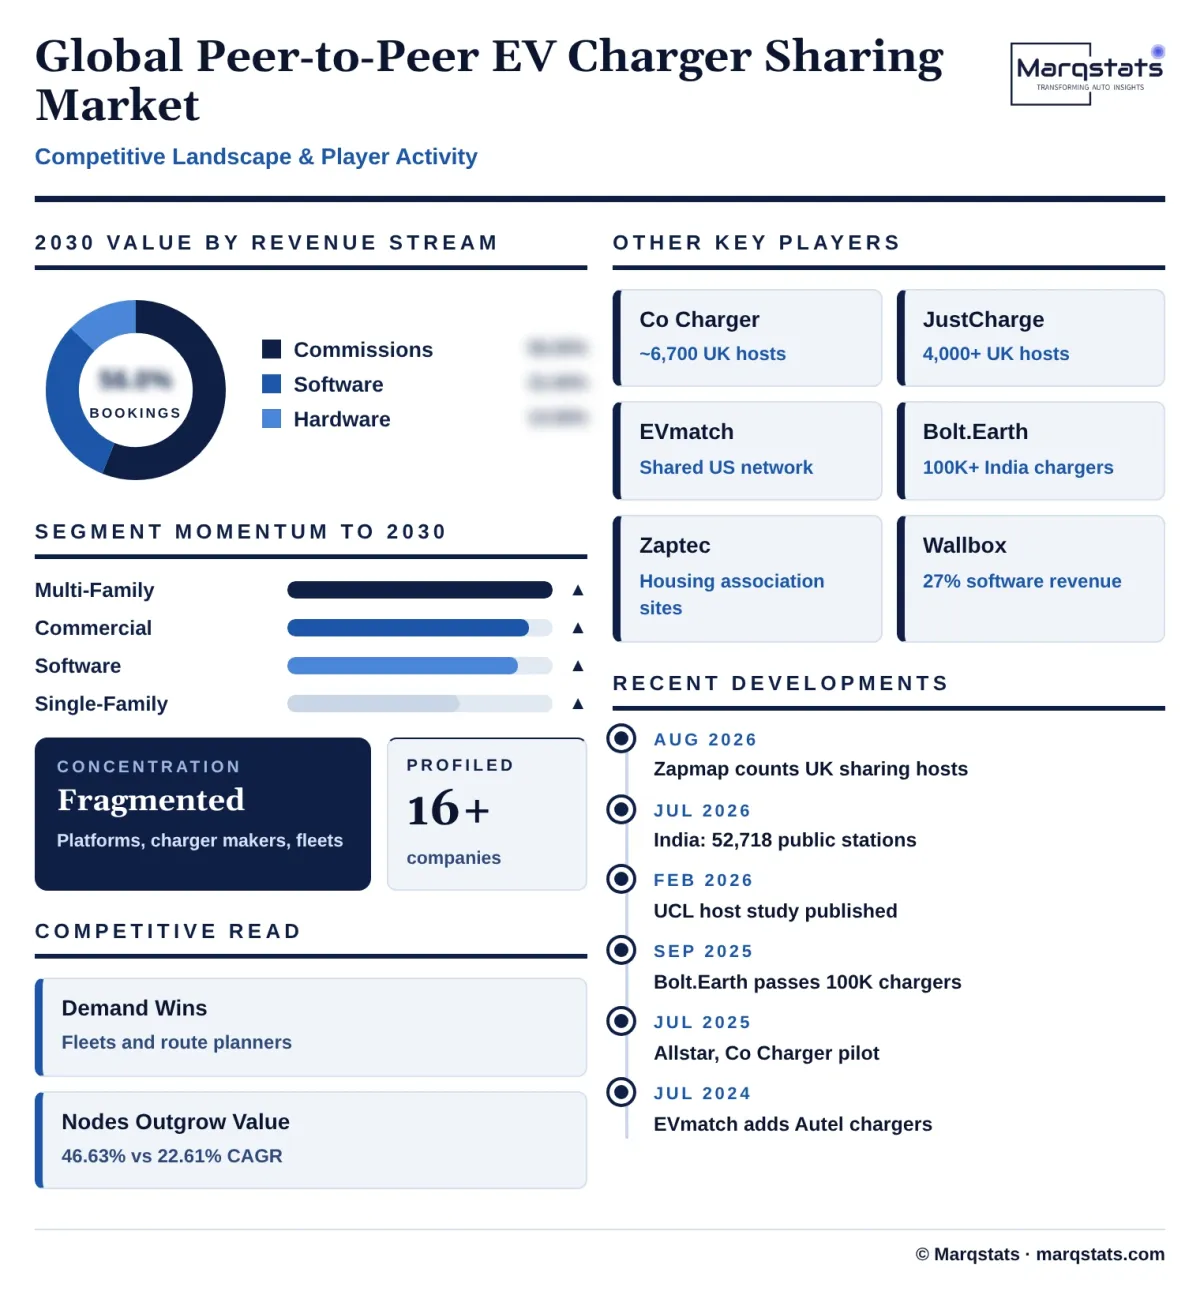
Value moves to buildings, fleets and software. Multi-family residential value grows at 28.81% a year and commercial value at 26.17%, against 18.82% for single-family homes, and software subscriptions grow at 25.13% against 21.75% for booking commissions. Single-family homes still account for 53.00% of 2030 value, but their share falls by nine points.
Marqstats tracks four indicators to monitor the forecast: the number of active hosts on leading platforms, bookings per active node, fleet card and route planner integrations, and the number of apartment buildings using shared charging software. Faster growth in fleet access or building software would raise value per node, while more listings without bookings would lower it.
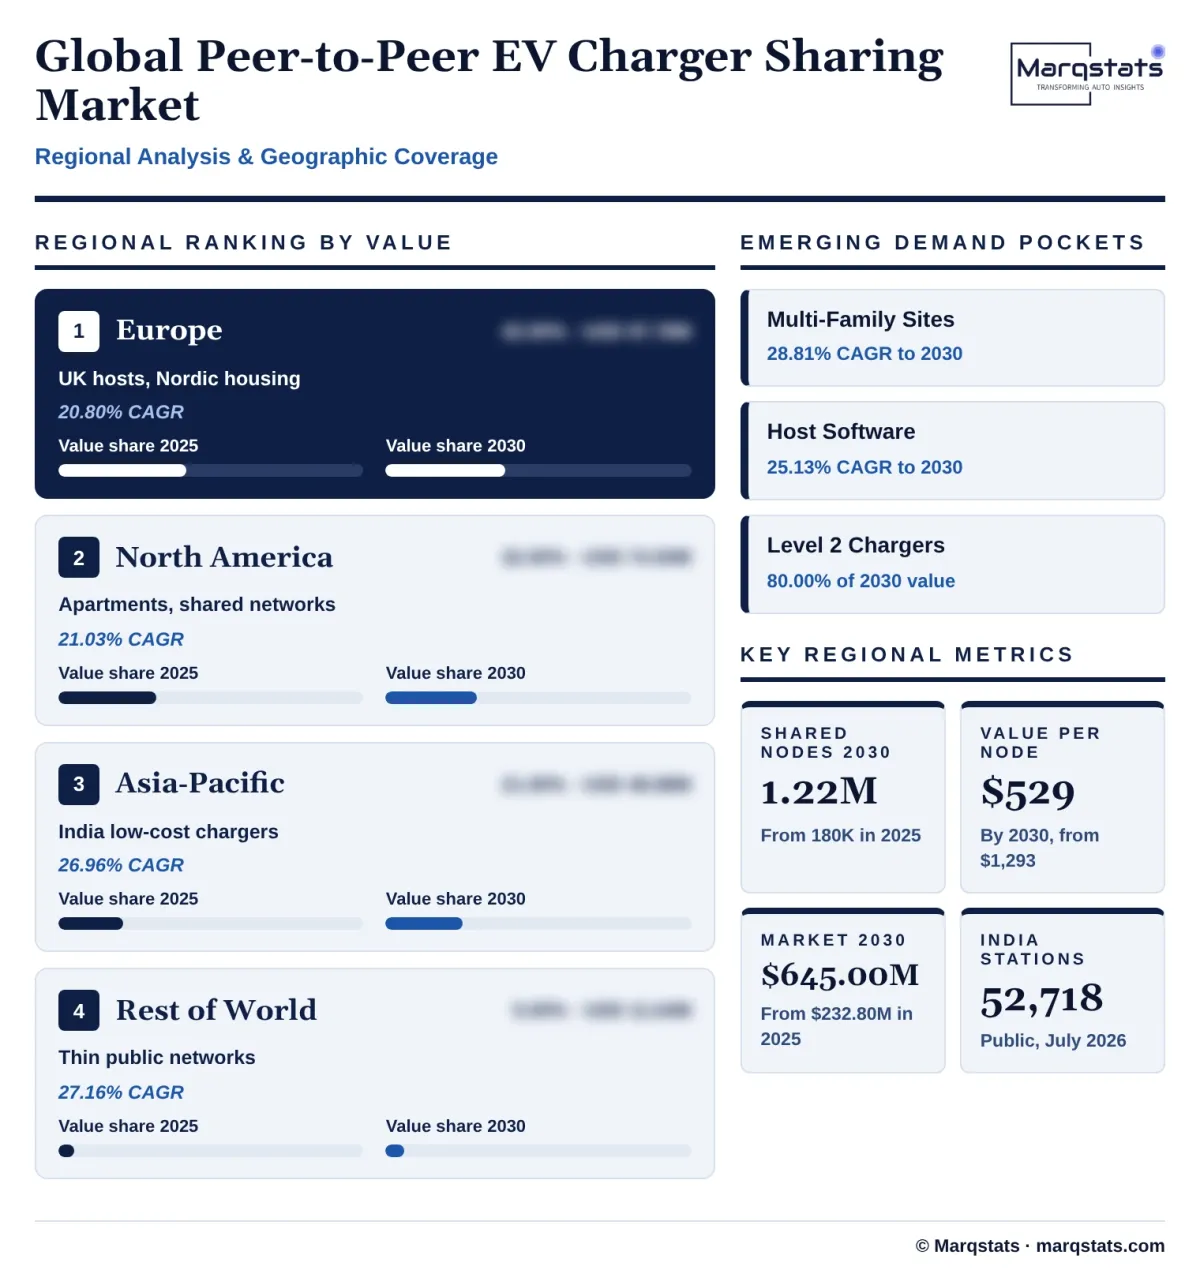
The regional mix shifts towards Asia-Pacific. Europe's share falls from 42.00% to 39.00% and North America's from 32.00% to 30.00%, while Asia-Pacific rises from 21.00% to 25.00% and the Rest of World from 5.00% to 6.00%. Level 2 chargers rise from 75.00% to 80.00% of value as Level 1 sharing declines from 11.00% to 6.00%.
Market Dynamics
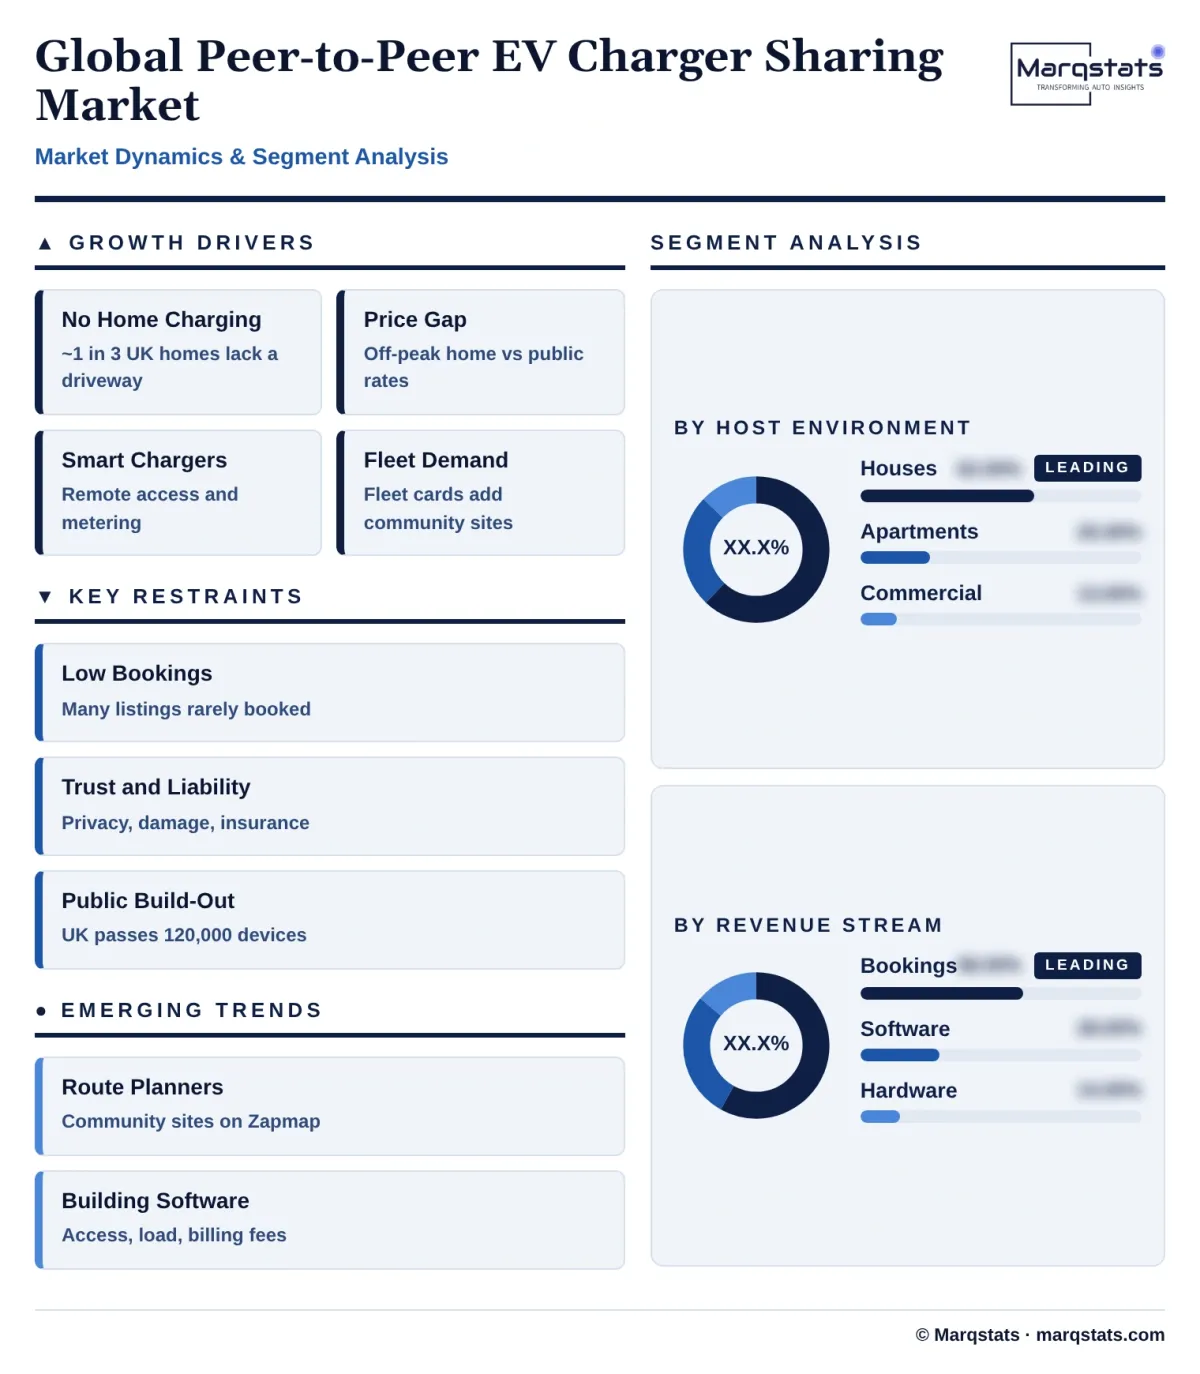
Key Drivers
Five forces are pushing private EV chargers onto shared booking platforms.
- Drivers without home charging. About a third of UK households and large shares of urban households in Europe, North America and India cannot install a charger at home, creating demand for access to nearby private chargers at lower prices than public rapid charging.
- Wide gap between home and public prices. Off-peak home electricity costs a fraction of public charging prices, so hosts can price shared charging below public networks and still earn a margin, giving drivers a clear reason to book.
- Connected chargers make sharing easy. Smart chargers required in the UK under the Electric Vehicles (Smart Charge Points) Regulations 2021, and networked chargers from makers such as Wallbox, Zaptec and Autel, can be locked, unlocked, metered and billed remotely, so hosts can share them without being present.
- Fleets need charging near drivers' homes. Fleet card providers such as Allstar are adding community chargers to their networks so that van and company car drivers without driveways can charge near home, giving hosts steadier bookings.
- Apartment buildings need shared access. Building managers use access control, load management and per-user billing to let residents share a few chargers, turning sharing software into a recurring building service.
Key Restraints
Four constraints hold back how far and how fast private charger sharing can scale.
- Low and irregular demand. Many listed chargers receive few bookings, so hosts lose interest and listings go inactive, as the University College London study of UK hosts found.
- Trust, liability and privacy concerns. Hosts worry about strangers on their property, damage, insurance cover and sharing their home address, and drivers worry about reliability and access.
- Metering, resale and tax rules. Selling charging by the kWh can raise questions about electricity resale, metering accuracy and tax treatment, and in Germany calibration law requires certified meters for billing by the kWh, raising hardware costs.
- Expanding public charging. The UK passed 120,000 public charging devices in 2026 and India had 52,718 public charging stations in July 2026, so more public chargers near homes reduce the need for private sharing in some areas.
Key Trends
Four shifts are changing how shared private chargers are listed, booked and paid for.
- Integration into route planners. Zapmap shows community chargers alongside public networks, putting private chargers in front of drivers who already plan journeys in the app.
- Fleet card access. Fleet card providers are adding community chargers so company drivers can charge near home and bill the cost to the employer.
- Charger makers build sharing into software. Wallbox, Zaptec, Monta and Autel offer access control, pricing and billing features in their charger apps, so sharing becomes a setting on the charger rather than a separate service.
- Shift to building software. Apartment and workplace operators pay monthly fees for access control, load management and resident billing, giving platforms steadier revenue than household commissions.
Strategic Implications
- For sharing platforms, demand is the priority. Partnerships with fleet card providers, route planners and car makers bring steadier bookings than marketing to individual drivers, and raise value per active node.
- For charger makers, sharing features add software revenue. Building access control, pricing and billing into charger apps lets makers earn subscriptions from apartment buildings and workplaces and makes their chargers easier to share.
- For building managers, shared charging is a resident service. Shared chargers with load management and per-user billing let buildings serve more residents without expensive grid upgrades.
- For fleets, community chargers fill a gap for drivers without driveways. Fleet card access to private chargers can lower charging costs compared with public rapid charging and reduce time spent driving to public sites.
- For policymakers, clear metering, resale and tax rules would help. Simple guidance on selling charging from private chargers would let more hosts take part without legal uncertainty.
- For investors, value per active node matters more than the number of listings. Platforms that report active hosts, bookings per node and building or fleet subscriptions give a better view of growth than those that report total listed chargers.
Market Segmentation
Driveway and garage chargers owned by households account for 62.00% of 2025 value, USD 144.34 million, and grow at 18.82% a year to USD 341.85 million by 2030, while their share falls to 53.00%. Most new shared nodes come from households, but many are booked only a few times a month, so value grows more slowly than the number of listings. Platforms such as Co Charger, JustCharge, EVmatch and Joosup recruit hosts through apps, charger maker partnerships and referral schemes.
Shared chargers in apartment buildings, housing associations and condominiums account for 25.00% of 2025 value, USD 58.20 million, and grow fastest, at 28.81% a year, to USD 206.40 million and 32.00% of the market by 2030. Building managers pay monthly fees for access control, load management and per-user billing. Zaptec chargers are widely used in Nordic housing associations, and multi-family operators such as Epic Charging and EVmatch serve apartment owners in the United States.
Chargers at workplaces, hotels, shops and small businesses opened to outside drivers account for 13.00% of 2025 value, USD 30.26 million, and grow at 26.17% a year to USD 96.75 million and 15.00% of 2030 value. Commercial hosts get more bookings per charger than households, and use platform software to set prices and opening hours for outside drivers.
Slow chargers using standard sockets account for 11.00% of 2025 value, USD 25.61 million, and grow at 8.61% a year to USD 38.70 million, while their share falls to 6.00% by 2030. Low-power sharing is most common in India, where smart sockets and low-cost chargers serve two-wheelers and three-wheelers, and in North America, where some hosts share standard household outlets.
Chargers rated about 7 kW to 22 kW account for 75.00% of 2025 value, USD 174.60 million, and grow at 24.20% a year to USD 516.00 million and 80.00% of 2030 value. They are the standard home and apartment charger in Europe and North America and can add enough range for daily driving in a few hours.
Higher-power AC and small DC chargers at businesses and some homes account for 14.00% of 2025 value, USD 32.59 million, and grow at 22.61% a year to USD 90.30 million, keeping a 14.00% share in 2030. They earn more per session but are expensive to install and are mostly found at commercial sites.
Commissions on bookings account for 58.00% of 2025 value, USD 135.02 million, and grow at 21.75% a year to USD 361.20 million and 56.00% of 2030 value. Platforms take a percentage of each booking or add a service fee for the driver, and commission revenue grows with fleet and route planner traffic.
Monthly fees paid by hosts, building managers and workplaces account for 28.00% of 2025 value, USD 65.19 million, and grow at 25.13% a year to USD 199.95 million and 31.00% of 2030 value. Subscriptions cover access control, load management, pricing, resident billing and reporting.
Fees for access hardware, smart plugs and integration of chargers with booking platforms account for 14.00% of 2025 value, USD 32.59 million, and grow at 20.80% a year to USD 83.85 million and 13.00% of 2030 value, as more chargers connect to platforms through cloud links instead of add-on hardware.
By Geography
Europe
Europe is the largest market, with 42.00% of 2025 value, USD 97.78 million, rising to USD 251.55 million by 2030, a 20.80% CAGR, while its share falls to 39.00%. The United Kingdom leads, with about 6,700 Co Charger hosts and just over 4,000 JustCharge hosts in June 2026, according to Zapmap, and Allstar giving fleet drivers access to Co Charger hosts. About 32.8% of UK households have no driveway. In the Nordic countries, housing associations use Zaptec and Monta software to share chargers among residents, and Wallbox and Monta offer access and billing features across the region. Germany's calibration law and the EU Alternative Fuels Infrastructure Regulation shape how charging can be billed and how prices are shown.
North America
North America accounts for 32.00% of 2025 value, USD 74.50 million, and grows at 21.03% a year to USD 193.50 million and 30.00% of the market by 2030. EVmatch runs a shared and reservable network in California and integrated Autel chargers in July 2024, multi-family operators such as Epic Charging serve apartment owners, and ChargePoint lets site owners set private or shared access and pricing on networked stations. Apartment residents without dedicated parking are the main source of demand.
Asia-Pacific
Asia-Pacific accounts for 21.00% of 2025 value, USD 48.88 million, and grows fastest among the major regions, at 26.96% a year, to USD 161.25 million and 25.00% of 2030 value. India leads volume growth: Bolt.Earth reported more than 100,000 chargers in over 1,800 towns and cities in September 2025, many of them low-cost chargers that hosts open to other drivers, and India had 52,718 public charging stations in July 2026, according to the Lok Sabha. Australia has sharing platforms such as Joosup, and apartment charging in Japan, South Korea and Singapore creates demand for building software.
Rest of World
The Rest of World accounts for 5.00% of 2025 value, USD 11.64 million, and grows at 27.16% a year to USD 38.70 million and 6.00% of 2030 value. Early demand comes from cities in the Middle East, Latin America and Africa where public charging is thin and EV owners share chargers through general charging apps.
How Competition Is Evolving
The peer-to-peer EV charger sharing market is fragmented. Specialist sharing platforms, charger makers with sharing features, fleet card providers and route planners all compete for hosts and drivers, and no company holds a large share of global value.
Specialist platforms built the first host networks. Co Charger and JustCharge in the United Kingdom, EVmatch in the United States, Joosup in Australia and Bolt.Earth in India built host and driver communities and booking systems for private chargers.
Charger makers and charger software firms add sharing to their products. Wallbox, Zaptec, Monta, Autel and ChargePoint let owners set access and pricing on networked chargers, so sharing becomes a feature of the charger rather than a separate app. Wallbox reported second quarter 2026 revenue of EUR 23.9 million, of which software, services and other revenue was EUR 6.5 million, or 27%. Zaptec reported 2025 revenue of NOK 1,532 million.
Demand partners decide who wins. Platforms that connect with fleet card providers such as Allstar, route planners such as Zapmap and car makers will get steadier bookings and higher value per node than platforms that rely on individual drivers finding them.
Partnerships are the main competitive tool. Allstar and Co Charger began a fleet access pilot in 2025, EVmatch integrated Autel chargers in 2024, and Zapmap shows community chargers in its route planner. Marqstats expects more such links between sharing platforms, charger makers, fleet card providers and car makers as platforms look for steadier demand.
Companies Covered
Companies covered in the report include:
Recent Market Activity
Table of Contents
Coverage & Segmentation
The study covers the global peer-to-peer EV charger sharing market, with 2025 as the base year, 2021 – 2025 as the historical period and 2026 – 2030 as the forecast period. Values are in US dollars and measure platform revenue from booking commissions, software subscriptions and hardware and integration fees. Volumes are shared nodes, meaning privately owned chargers listed for use by other drivers. The market is segmented by host environment, power rating, revenue stream and region.
The electricity value kept by hosts, public charge point operator networks, roaming hubs serving only public networks, the sale and installation of chargers, and charging subscriptions sold by car makers are excluded. Segment and regional splits are Marqstats estimates built on platform disclosures, host counts, charger maker results and charging price benchmarks.