Market Snapshot
Middle bar: base-year value × (1 + CAGR), rounded to two decimals. This is a calculated illustration, not a separately researched annual estimate.
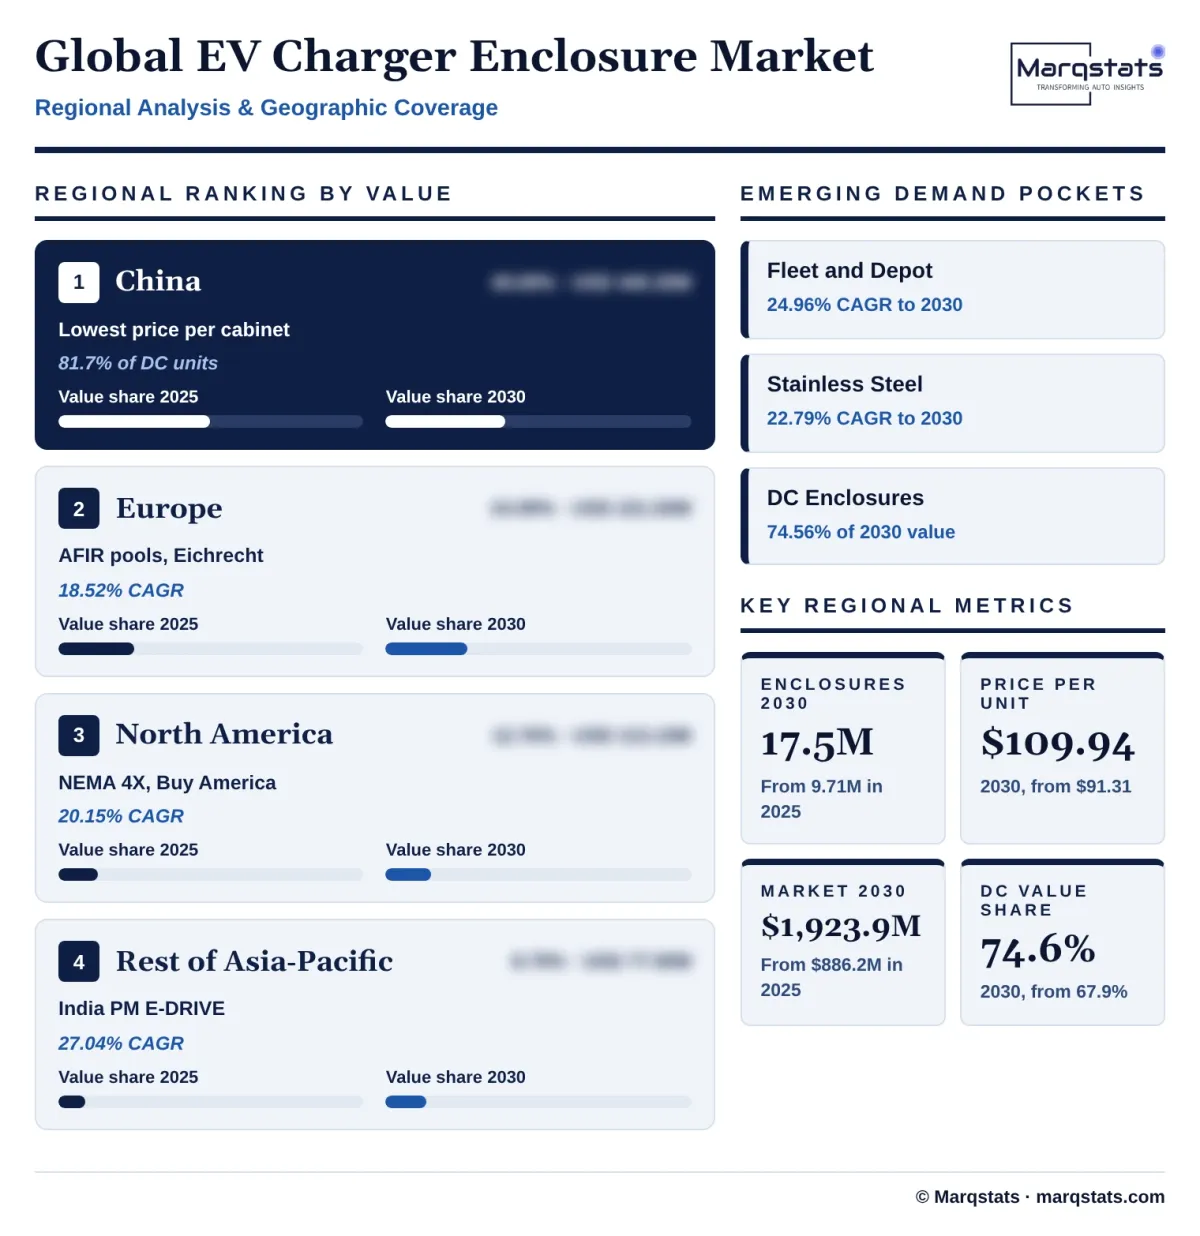
The global EV charger enclosure market size is estimated at USD 886.20 million in 2025 and is projected to reach USD 1,923.90 million by 2030, growing at a CAGR of 16.77% over 2026 – 2030. Enclosure shipments rise from about 9.71 million to 17.50 million units, a 12.52% annual rate, while the blended ex-factory price rises from about USD 91.31 to USD 109.94 per enclosure.
Marqstats defines the market as the ex-factory value of the structural and protective housings built into electric vehicle supply equipment: chassis frames, cabinet panels and doors, internal mounting rails, gaskets and seals, locks and tamper hardware, ventilation ducts, filters, heat exchanger mounts and passive thermal parts, sold to charger manufacturers or produced in house. Power modules, control boards, displays, payment terminals, metering, cables and connectors, installation and civil works are excluded.
DC fast-charging enclosures account for 67.89% of 2025 value although they are only 6.18% of units, and China accounts for 49.69% of value. The study segments the market by charger type, enclosure material, application and region.
Key Takeaways
Market Overview & Analysis
Report Summary
Marqstats sizes the EV charger enclosure market as the ex-factory value of the housings built into new chargers each year. In 2025 about 9.71 million enclosures were shipped, worth an estimated USD 886.20 million at an average of USD 91.31 each: 8.30 million private AC wallbox housings worth USD 214.20 million, 0.81 million public AC pedestal and wall enclosures worth USD 70.40 million and 0.60 million DC fast-charging cabinets and dispensers worth USD 601.60 million.
The enclosure is the part of a charger that keeps water, dust, heat, vandals and vehicles away from the electronics. Outdoor public chargers need IP54 to IP65 ingress protection under IEC 60529 or NEMA 3R to 4X ratings under NEMA 250 and UL 50E, and IK08 to IK10 impact ratings under IEC 62262 for street and highway sites. A wallbox housing is a 1.5 to 3.5 kg moulded polycarbonate shell; a DC fast-charging cabinet uses 80 to 450 kg of steel or aluminium with doors, seals, locks, louvres, filters and mounting rails for power modules.
China dominates volume. China had 20.092 million charging facilities at the end of 2025, up 49.7%, including 4.717 million public and 15.375 million private units, which implies about 6.7 million facilities added in 2025. The IEA reported that almost 1.8 million public charging points were added worldwide in 2025, about 1.3 million of them in China, taking the global public stock above 7 million.
The count of enclosures is lower than the count of charging points. Most Chinese public DC chargers and many European pedestals have two guns or sockets in one housing, so Marqstats counts about 0.60 million DC enclosures for about 0.83 million new public DC points and depot chargers, and about 0.81 million public AC enclosures for close to 1 million new public AC points.
The market grew from about USD 354.48 million in 2021 to USD 531.72 million in 2022, USD 673.51 million in 2023 and USD 779.86 million in 2024, as the global public charging stock passed 7 million points and China's private charger base tripled. Marqstats expects about USD 1,034.81 million in 2026.
Regulation sets enclosure specifications in each region. The EU Alternative Fuels Infrastructure Regulation (EU) 2023/1804 requires charging pools of at least 400 kW every 60 km on the core TEN-T road network by the end of 2025, rising to 600 kW by the end of 2027, and Germany's Mess- und Eichrecht requires tamper-evident, readable meters on public chargers. In the United States, FHWA's Buy America waiver for EV chargers excludes housings that are predominantly steel or iron, so those housings must be made from US-melted and US-processed steel on federally funded projects.
Thermal design is the main engineering problem in DC enclosures. A 400 kW charger running at about 97.5% efficiency turns roughly 10 kW into heat inside the cabinet, and filtered louvres that let outside air across the electronics clog with dust and pollen and force derating. Newer cabinets keep power modules, controllers and meters in a sealed IP65 compartment and move heat through cold plates, heat pipes or air-to-air exchangers into a separate ventilated duct, so outside air never touches the electronics.
Enclosure value follows charger architecture. An all-in-one DC charger packs power modules, cooling and the user interface into one housing; a split system places a large central power cabinet away from the parking bays and connects several slim dispensers. Split systems add enclosure value because they need both an industrial cabinet and several weather-sealed, impact-resistant dispensers, and they are spreading in Europe, North America and at large Chinese hubs.
Global EV Charger Enclosure Market Size and Forecast
The global EV charger enclosure market grows from USD 886.20 million in 2025 to USD 1,923.90 million in 2030, a CAGR of 16.77%. Marqstats expects about USD 1,208.35 million in 2027, USD 1,410.98 million in 2028 and USD 1,647.60 million in 2029.
Value grows faster than volume because the mix shifts toward DC enclosures and toward regions with higher enclosure content. Marqstats estimates that DC enclosures rise from 0.60 million to 1.14 million units, public AC enclosures from 0.81 million to 1.27 million and wallbox housings from 8.30 million to 15.10 million.
Prices per enclosure move in different directions by type. Wallbox housing prices fall by about 2% a year as moulding volumes rise, from about USD 18 to USD 16 in China and USD 45 to USD 41 in Europe. DC cabinet prices rise, from about USD 650 to USD 720 in China and USD 3,800 to USD 4,100 in Europe, as higher-power chargers, split power cabinets with liquid cooling and megawatt chargers need larger, better-sealed housings.
China's share of value falls from 49.69% to 39.28%. China keeps adding chargers quickly under its plan to reach about 28 million facilities by 2027, but its prices are low and its growth slows from the 2024–2025 peak, while Europe, North America, India and other markets add higher-value enclosures.
Marqstats tracks four indicators to monitor the forecast: monthly charger additions in China by AC and DC type, AFIR corridor compliance in EU member states, Buy America rule changes for federally funded US chargers, and the share of split-architecture and liquid-cooled DC systems in new public installations.
The forecast is a hardware forecast. The Marqstats Global EV DC Charging Station report values DC charging hardware, deployment, software and services at USD 14.20 billion in 2025, and DC enclosures at USD 601.60 million are about 4% of that value, consistent with the housing's share of charger cost.
The mix changes over the forecast. DC enclosures rise from 67.89% to 74.56% of value, wallbox housings fall from 24.17% to 19.24% and public AC enclosures from 7.94% to 6.21%. By material, aluminium rises from 18.37% to 21.85% and stainless steel from 5.94% to 7.64%, while plastics fall from 23.42% to 18.66%. By application, fleet and depot enclosures rise from 12.22% to 17.15% of value.
Market Dynamics
Key Drivers
Five forces are lifting demand for EV charger enclosures and the value of each enclosure.
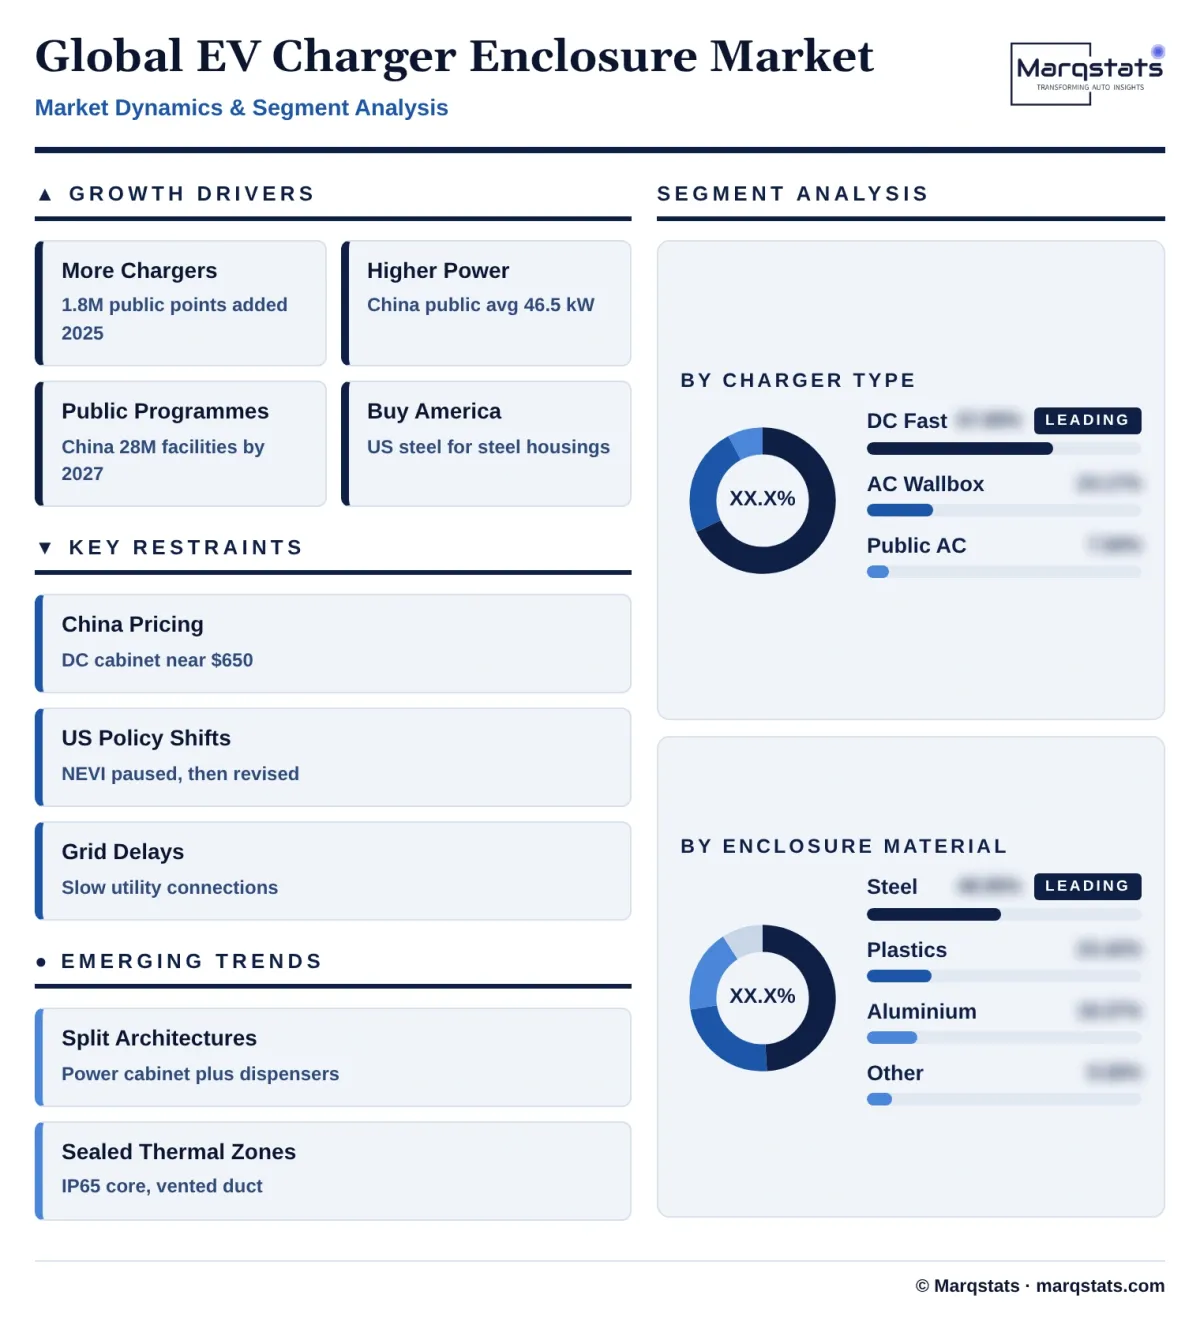
- Rising charger installations. About 1.8 million public charging points were added worldwide in 2025 and China's private charger base grew 56.2% to 15.375 million.
- Higher charging power. China's average public charging power reached 46.5 kW in 2025, and higher-power cabinets need larger housings with more cooling and sealing.
- Public programmes. China's three-year action plan, EU AFIR corridor targets and India's PM E-DRIVE scheme fund large numbers of public fast chargers.
- Domestic content rules. US Buy America rules require steel and iron charger housings on federally funded projects to use domestic steel, favouring local fabricators.
- Fleet electrification. Depot chargers for vans, buses and trucks use large power cabinets that carry high enclosure value.
- Export specifications for Chinese chargers. Chinese DC chargers sold abroad need higher ingress, impact and corrosion ratings and local certification, raising enclosure content per unit.
Key Restraints
Four constraints limit volume and pricing for enclosure suppliers.
- Price pressure in China. Chinese charger makers buy sheet-metal cabinets in very large volumes, keeping DC enclosure prices near USD 650.
- Policy uncertainty in the United States. The NEVI programme was paused in early 2025 and resumed under revised guidance in August 2025, and the end of the Section 30C credit for property placed in service after 30 June 2026 weakens site economics.
- Grid connection delays. Long waits for utility connections delay public and depot charger installations and enclosure orders.
- Commodity costs. Steel, aluminium and polycarbonate prices and tariffs change enclosure costs faster than contract prices can be adjusted.
- Charger overcapacity. Excess DC charger production capacity in China and Europe pushes charger makers to cut costs, including enclosure costs.
Key Trends
Four shifts are changing how charger enclosures are designed, specified and bought.
- Split architectures. Central power cabinets serving several slim dispensers separate heavy steel cabinets from light aluminium user units.
- Sealed thermal zones. Enclosures separate sealed electronics compartments from ventilated heat-exchange ducts to keep IP54 or better ratings at high power.
- Metrology and tamper features. Eichrecht and MID rules add meter windows, seals and access switches to the enclosure.
- Corrosion-resistant materials. Stainless steel, aluminium and composite housings grow for coastal, winter-salt and depot sites.
- Liquid-cooled cabinets. Megawatt and 600 kW-plus chargers move to liquid-cooled power modules, which need sealed coolant routing and larger cabinets.
Strategic Implications
- For enclosure specialists, selling pre-certified thermal and sealing sub-assemblies, not bare cabinets, protects margin against build-to-print metal shops.
- For charger makers, standard internal racks and modular power cabinets cut certification time and let one housing serve several power ratings.
- For US suppliers, Buy America iron and steel rules for charger housings create a protected market for domestic fabricators and coating lines.
- For Chinese suppliers, export chargers need higher IP, IK and corrosion ratings than domestic units, and meeting European and North American specifications lifts price per enclosure.
- For charge point operators, enclosure quality decides uptime; housings with proven ingress, impact and corrosion ratings reduce failures that count against uptime targets.
- For investors, enclosure value grows faster than charger units as power rises and installations shift outside China, so suppliers with certified high-power cabinet platforms and production in Europe, North America and India have the best growth exposure.
Market Segmentation
DC cabinets, dispensers and depot power units account for 67.89% of 2025 value, USD 601.60 million, from about 0.60 million units, and grow at 18.98% a year to USD 1,434.40 million and 74.56% of 2030 value. China builds 81.67% of these enclosures but earns 52.94% of their value.
Moulded wallbox housings for homes and private parking account for 24.17% of 2025 value, USD 214.20 million, from 8.30 million units, and grow at 11.56% a year to USD 370.10 million, while their share falls to 19.24% as unit prices decline.
Public AC pedestals, bollards and wall units account for 7.94% of 2025 value, USD 70.40 million, from 0.81 million units, and grow at 11.14% a year to USD 119.40 million. European pedestals with two sockets sell for about USD 260 per enclosure, Chinese single-gun AC piles for about USD 40.
Powder-coated and galvanised steel accounts for 48.95% of 2025 value, USD 433.79 million, and grows at 16.96% a year to USD 949.50 million, used mainly for DC power cabinets and pedestals.
Polycarbonate and blended thermoplastic housings account for 23.42% of 2025 value, USD 207.57 million, and grow at 11.57% a year to USD 358.91 million, used mainly for wallboxes.
Aluminium enclosures account for 18.37% of 2025 value, USD 162.80 million, and grow at 20.90% a year to USD 420.45 million as slim dispensers and lightweight all-in-one chargers spread.
Stainless steel enclosures account for 5.94% of 2025 value, USD 52.67 million, and grow fastest, at 22.79% a year, to USD 147.01 million for coastal, salted-road and depot sites.
Fibreglass and sheet moulding compound housings account for 3.31% of 2025 value, USD 29.37 million, and grow at 10.34% a year to USD 48.03 million in corrosive and electrically insulated applications.
Enclosures for public DC charging plazas, urban hubs and highway sites account for 55.66% of 2025 value, USD 493.31 million, and grow at 17.49% a year to USD 1,104.49 million.
Home and multi-family wallbox housings account for 20.55% of 2025 value, USD 182.07 million, and grow at 11.03% a year to USD 307.18 million.
Enclosures for depot chargers serving vans, buses and trucks account for 12.22% of 2025 value, USD 108.29 million, and grow fastest, at 24.96% a year, to USD 329.91 million.
Workplace, retail, hotel and on-street AC chargers account for 11.57% of 2025 value, USD 102.53 million, and grow at 12.20% a year to USD 182.32 million.
By Geography
China
China is the largest market, with 49.69% of 2025 value, USD 440.30 million, from about 5.50 million wallbox housings, 0.57 million public AC enclosures and 0.49 million DC enclosures, rising to USD 755.75 million by 2030, an 11.41% CAGR, while its share falls to 39.28%. Prices are the lowest in the world because sheet-metal and moulding suppliers sit next to charger plants.
Europe
Europe accounts for 24.99% of 2025 value, USD 221.50 million, and grows at 18.52% a year to USD 518.00 million by 2030. AFIR corridor pools, Eichrecht metering rules and high-power ultra-fast chargers make European DC cabinets among the most expensive, at about USD 3,800 each.
North America
North America accounts for 12.76% of 2025 value, USD 113.10 million, and grows at 20.15% a year to USD 283.15 million by 2030. NEMA 3R to 4X construction, UL 50E and UL 2202 certification and Buy America iron and steel rules for federally funded housings push DC enclosure prices to about USD 4,200.
Rest of Asia-Pacific
The rest of Asia-Pacific accounts for 8.79% of 2025 value, USD 77.90 million, and grows fastest, at 27.04% a year, to USD 257.80 million by 2030, led by India's PM E-DRIVE programme, South Korea, Japan, Australia and Southeast Asia. Hot, humid and dusty sites need IP55 or better, sun shields and tropicalised coatings.
Rest of World
Latin America, the Middle East and Africa account for 3.77% of 2025 value, USD 33.40 million, and grow at 26.73% a year to USD 109.20 million by 2030, with Gulf highway and city programmes needing housings rated for heat and sand.
How Competition Is Evolving
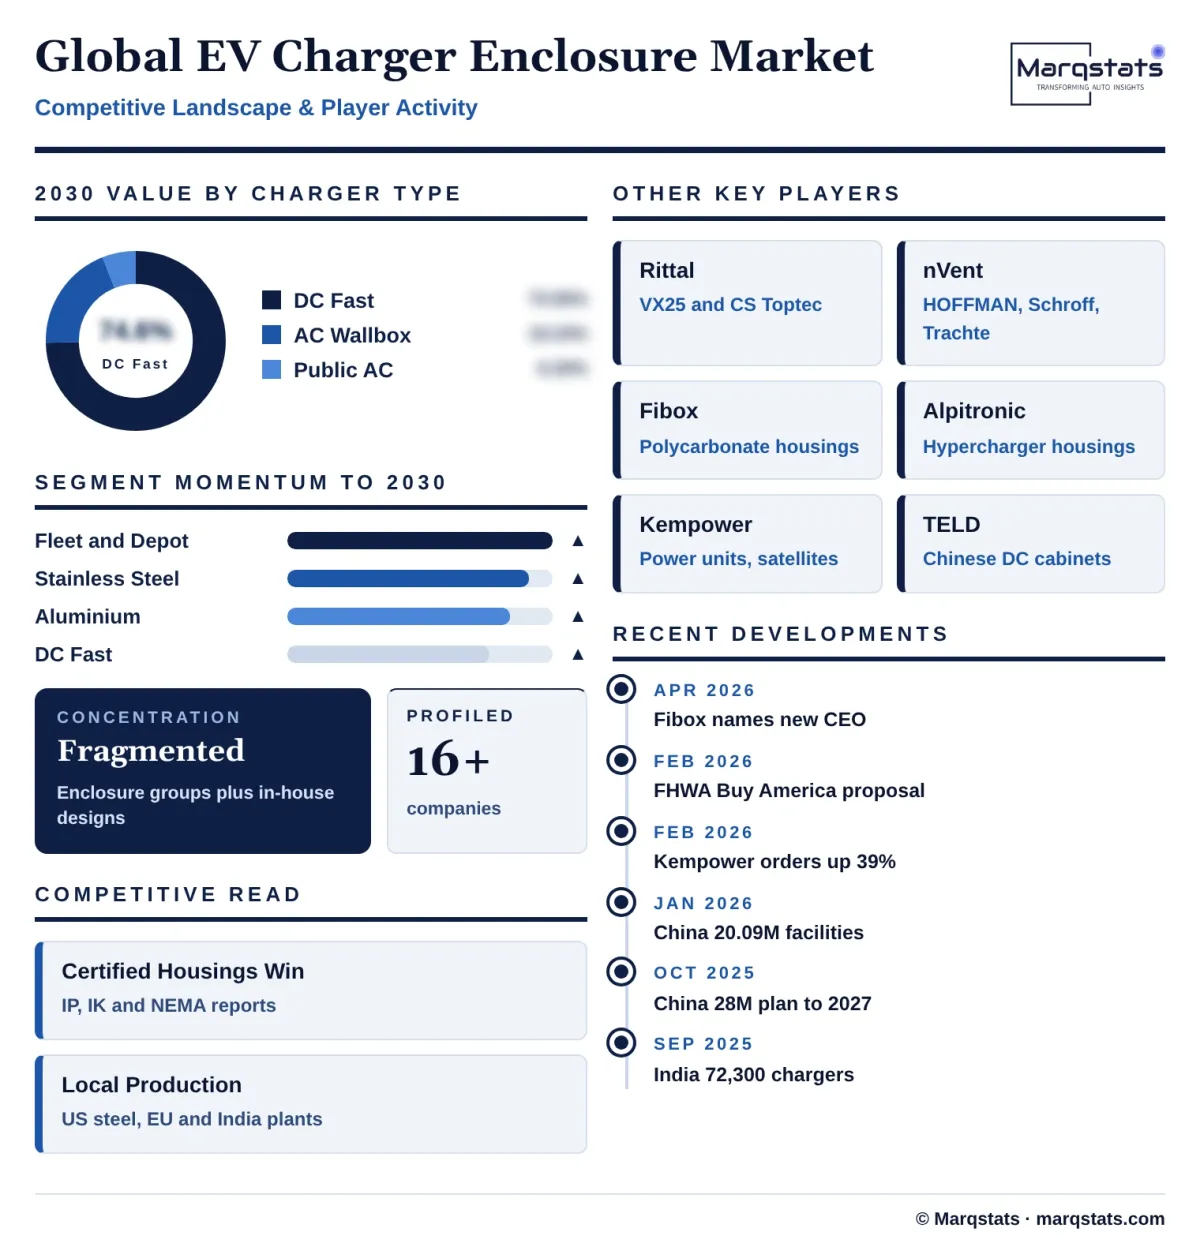
The EV charger enclosure market is fragmented. Industrial enclosure groups such as Rittal, nVent, Fibox, Schneider Electric, Eaton, Hammond and Spelsberg supply standard cabinets, outdoor housings and plastic enclosures, while charger makers such as Alpitronic, Kempower, ABB E-mobility, TELD, Star Charge, Delta and Tesla design their own housings and buy sheet metal, extrusions and moulded parts from regional fabricators.
In China, most enclosures are built to print by sheet-metal and injection-moulding suppliers clustered around charger plants in Guangdong, Jiangsu, Zhejiang and Shandong. Scale and short supply chains keep a 60–160 kW cabinet near USD 650.
Industrial enclosure groups compete on certified designs and climate control. Rittal's VX25 modular enclosure system and CS Toptec outdoor enclosures are used for DC power cabinets and depot charging hubs, with Blue e+ cooling units that Rittal says cut cooling energy by up to 75%. nVent supplies HOFFMAN, Schroff and Trachte enclosures, including Buy America compliant steel cabinets for US charger programmes.
Ownership and leadership are changing. nVent renamed its Enclosures segment Systems Protection and bought the Electrical Products Group from Avail Infrastructure Solutions for about USD 1.0 billion in 2025, lifting segment backlog to USD 2,118.9 million at the end of 2025, mainly from data centres and utilities. Fibox appointed Markus Hettig, formerly of Schneider Electric and Hager Group, as CEO of its enclosures business in April 2026.
Charger makers' own designs set the high end of the market. Alpitronic, with revenue just under EUR 1 billion in 2025 and 135,000 charge points in operation, builds Hypercharger housings with IP54 and IK10 ratings, and Kempower, with 2025 revenue of EUR 251.3 million, uses heavy steel power units linked to compact satellite dispensers.
Competition is decided by certification, thermal performance and local production. Suppliers that hold UL, IEC and NEMA test reports for standard housings, can supply sealed thermal zones and can build in the region of installation, including US-melted steel for federally funded projects, win the largest programmes.
Companies Covered
Companies covered in the report include:
Recent Market Activity
Table of Contents
Coverage & Segmentation
The study covers the global EV charger enclosure market, with 2025 as the base year, 2021 – 2025 as the historical period and 2026 – 2030 as the forecast period. Values are in US dollars at ex-factory prices, whether the enclosure is bought from a supplier or made in house by the charger maker, and volumes are enclosures fitted to new chargers, counting one enclosure per charger housing regardless of the number of guns or sockets. The market is segmented by charger type, enclosure material, application and region, with regions defined by where the charger is installed.
Power modules, control electronics, displays, payment terminals, energy meters, charging cables and connectors, cooling pumps and chillers, utility transformers, installation and civil works, raw coil, sheet and resin, and portable chargers and cordsets are excluded. The Marqstats Global EV DC Charging Station and Global Residential EV Charger reports value complete chargers and services, and this market sits inside them and should not be added to them. Unit counts, prices and splits are Marqstats estimates built on charger installation data, enclosure specifications and supplier price benchmarks.