Market Snapshot
Middle bar: base-year value × (1 + CAGR), rounded to two decimals. This is a calculated illustration, not a separately researched annual estimate.
The global e-bike and e-scooter subscription market size is estimated at USD 1,720.00 million in 2025 and is projected to reach USD 3,691.12 million by 2030, growing at a CAGR of 16.50% over 2026 – 2030. The subscribed fleet grows from about 1.72 million vehicles to 4.15 million, a 19.26% annual rate, while average annual revenue per vehicle falls from about USD 1,000 to USD 889.
Marqstats defines the market as recurring subscription revenue for e-bikes and stand-up e-scooters that a single subscriber, either a person or a business, keeps for at least one month, with maintenance, theft and damage cover and vehicle swaps included in the fee. Onboarding charges and fleet software sold with dedicated vehicles are included. Pay-per-minute shared schemes, retail sales, multi-year employer salary-sacrifice bike leasing, unserviced equipment leases, short tourist rentals and non-electric bikes are excluded.
E-bikes account for 74.00% of 2025 value, delivery couriers and business fleets for 57.00% and flexible monthly contracts for 62.00%. Europe accounts for 61.00% of 2025 value and North America for 25.00%. The study segments the market by vehicle type, end user, contract type and region.
Key Takeaways
Market Overview & Analysis
Report Summary
Marqstats sizes the e-bike and e-scooter subscription market as the recurring revenue earned when a person or a business pays a monthly or weekly fee for exclusive use of an e-bike or stand-up e-scooter, with maintenance, repairs, theft and damage cover, vehicle swaps and an app included. In 2025 about 1.72 million vehicles were in subscription service worldwide, earning an estimated USD 1,720.00 million at an average of about USD 1,000 per vehicle a year.
The model is often described as vehicle-as-a-service. The operator owns the vehicle, buys it in bulk, keeps it on the road and takes it back when the contract ends, so the subscriber avoids a large upfront payment, unexpected battery and repair bills and the risk of theft. Consumer plans in Europe and the United States typically cost from about USD 35 to USD 80 a month for an e-scooter and more for a premium e-bike, while delivery e-bikes for couriers typically cost USD 120 to USD 160 a month and cargo e-bikes more.
The market sits between three larger businesses. It is smaller than global e-bike and e-scooter retail sales, which Marqstats estimates at around USD 90 billion, and smaller than shared micromobility, where riders pay per minute for vehicles left on the street. It is also distinct from employer salary-sacrifice bike leasing, common in Germany and the Netherlands, where an employee leases a bike for several years through payroll as a tax-efficient form of finance rather than as a serviced subscription.
Two customer groups drive demand. Delivery couriers working for food and grocery apps ride 25,000 to 35,000 kilometres a year, wear out brakes, chains and tyres every few weeks and need a working bike every day, so a subscription with fast repairs and replacement batteries protects their income. City commuters want a reliable e-bike or e-scooter without paying USD 1,500 to USD 4,000 upfront and without worrying about theft or battery failure.
The market grew from USD 825.00 million in 2021 to USD 1,015.00 million in 2022, USD 1,220.00 million in 2023 and USD 1,450.00 million in 2024, as the subscribed fleet rose from about 710,000 to 1.41 million vehicles. Growth slowed from 23.03% in 2022 to 18.85% in 2024 and 18.62% in 2025 as early city launches matured and operators focused on profitability.
Rules on vehicle classes shape what operators can offer. In the EU, e-bikes limited to 250 watts and 25 km/h under EN 15194 are treated as bicycles and need no registration or insurance, while faster speed pedelecs need plates, insurance and helmets. In the United States, most states use a three-class system for e-bikes, while e-scooter rules are set city by city. In the UK, privately owned e-scooters cannot legally be used on public roads, so subscriptions there focus on e-bikes.
Global E-Bike and E-Scooter Subscription Market Size and Forecast
The global e-bike and e-scooter subscription market grows from USD 1,720.00 million in 2025 to USD 3,691.12 million in 2030, a CAGR of 16.50%. Marqstats expects USD 2,003.80 million in 2026, USD 2,334.43 million in 2027, USD 2,719.61 million in 2028 and USD 3,168.34 million in 2029.
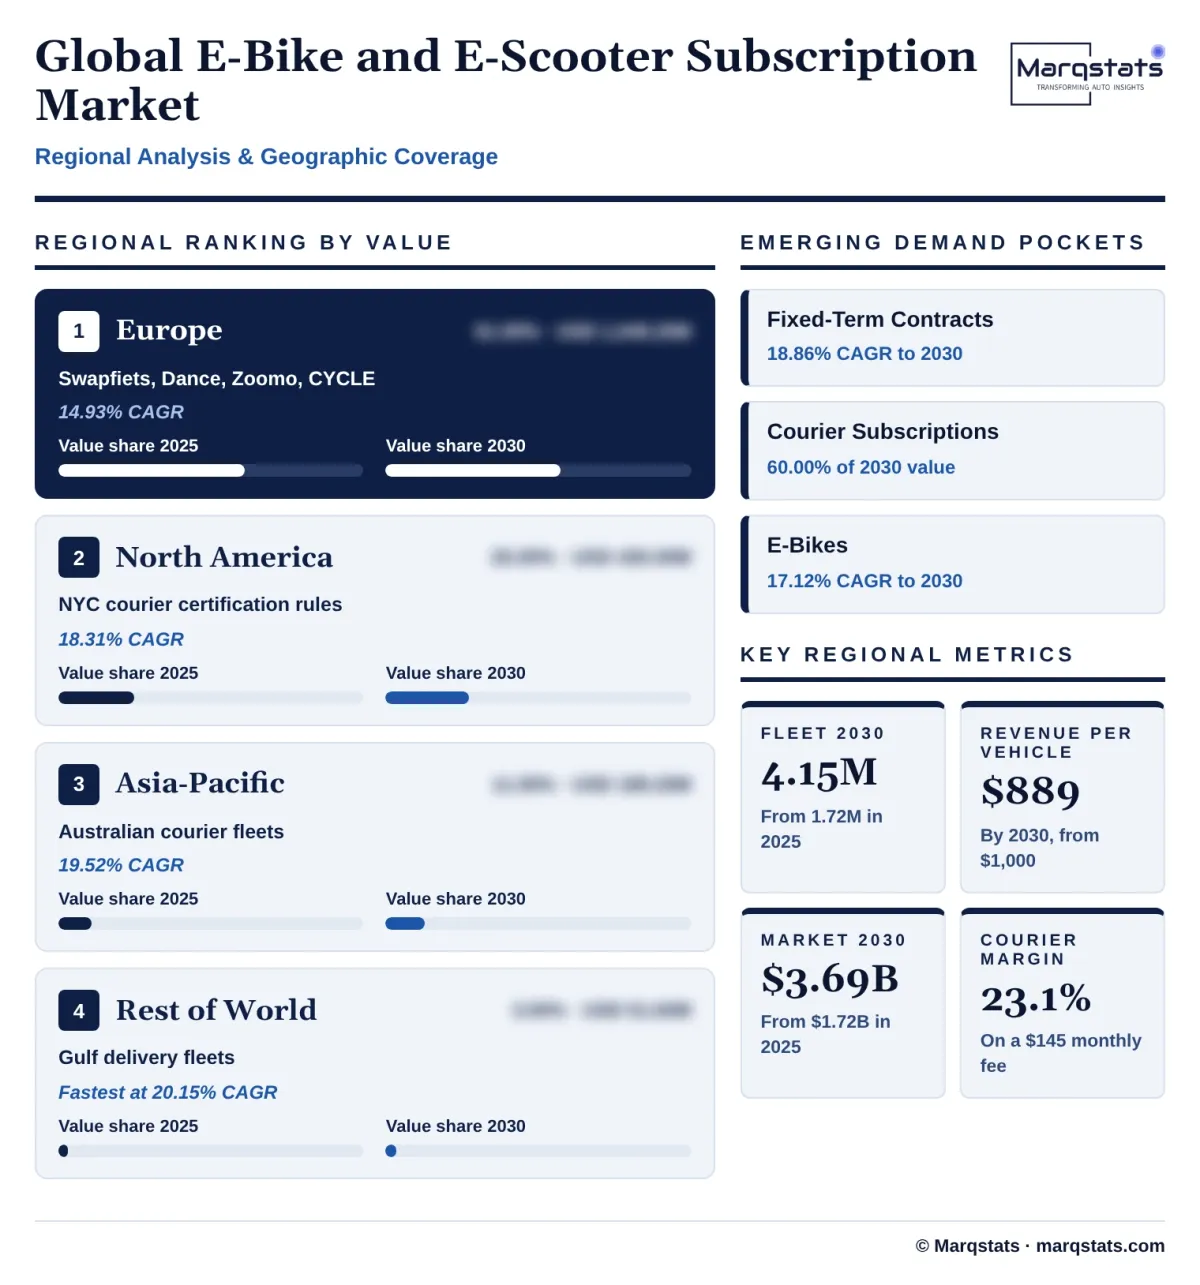
The subscribed fleet grows faster than value. Marqstats expects about 2.10 million vehicles in 2026, 2.53 million in 2027, 3.03 million in 2028, 3.56 million in 2029 and 4.15 million in 2030, a 19.26% annual rate. Average annual revenue per vehicle falls from about USD 1,162 in 2021 to USD 1,000 in 2025, USD 956 in 2026 and USD 889 in 2030, as lower-priced e-scooter and entry e-bike plans, longer discounted contracts and subsidised courier offers make up a larger share of the fleet.
About a quarter of 2025 revenue is anchored directly in company disclosures. Swapfiets reported revenue of EUR 91.1 million in 2024, up 7%, with 52,000 e-bikes, and Marqstats builds the rest of the estimate from courier counts, delivery fleet sizes, consumer subscription prices and city-level adoption, converted to US dollars at 2025 average exchange rates.
Retention and price are the most sensitive inputs. Marqstats estimates that a one percentage point change in monthly subscriber retention moves the market by about USD 31.80 million in 2025 and USD 68.28 million in 2030, and a USD 5 change in average monthly revenue per vehicle moves it by about USD 103.20 million in 2025 and USD 249.00 million in 2030.
Marqstats tracks four indicators to monitor the forecast: the number of delivery couriers working through food and grocery apps in major cities, enforcement of battery certification rules in New York City and the final US federal standard, consumer churn after winter in northern Europe and North America, and the cost of e-bikes and replacement batteries bought by operators.
Unit economics explain the gap between fleet and revenue growth. Marqstats estimates a courier e-bike earning USD 145 a month carries USD 62.50 of depreciation on a USD 1,125 vehicle written off over 18 months, USD 26.00 of servicing, USD 14.50 of insurance and USD 8.50 of tracking and logistics, leaving a contribution of USD 33.50, or 23.10% of revenue, before overheads and financing.
Market Dynamics
Key Drivers
Five forces are moving riders and delivery fleets from owning e-bikes and e-scooters to paying for them by subscription.
- Delivery platforms need reliable, certified e-bikes. Food and grocery delivery apps rely on couriers who need a working e-bike every day, and a subscription with repairs, insurance and spare batteries keeps them riding without the platform owning vehicles. Zoomo joined a EUR 2 million Uber Eats courier support programme in France in May 2025, offering subscriptions at half price from EUR 70 a month.
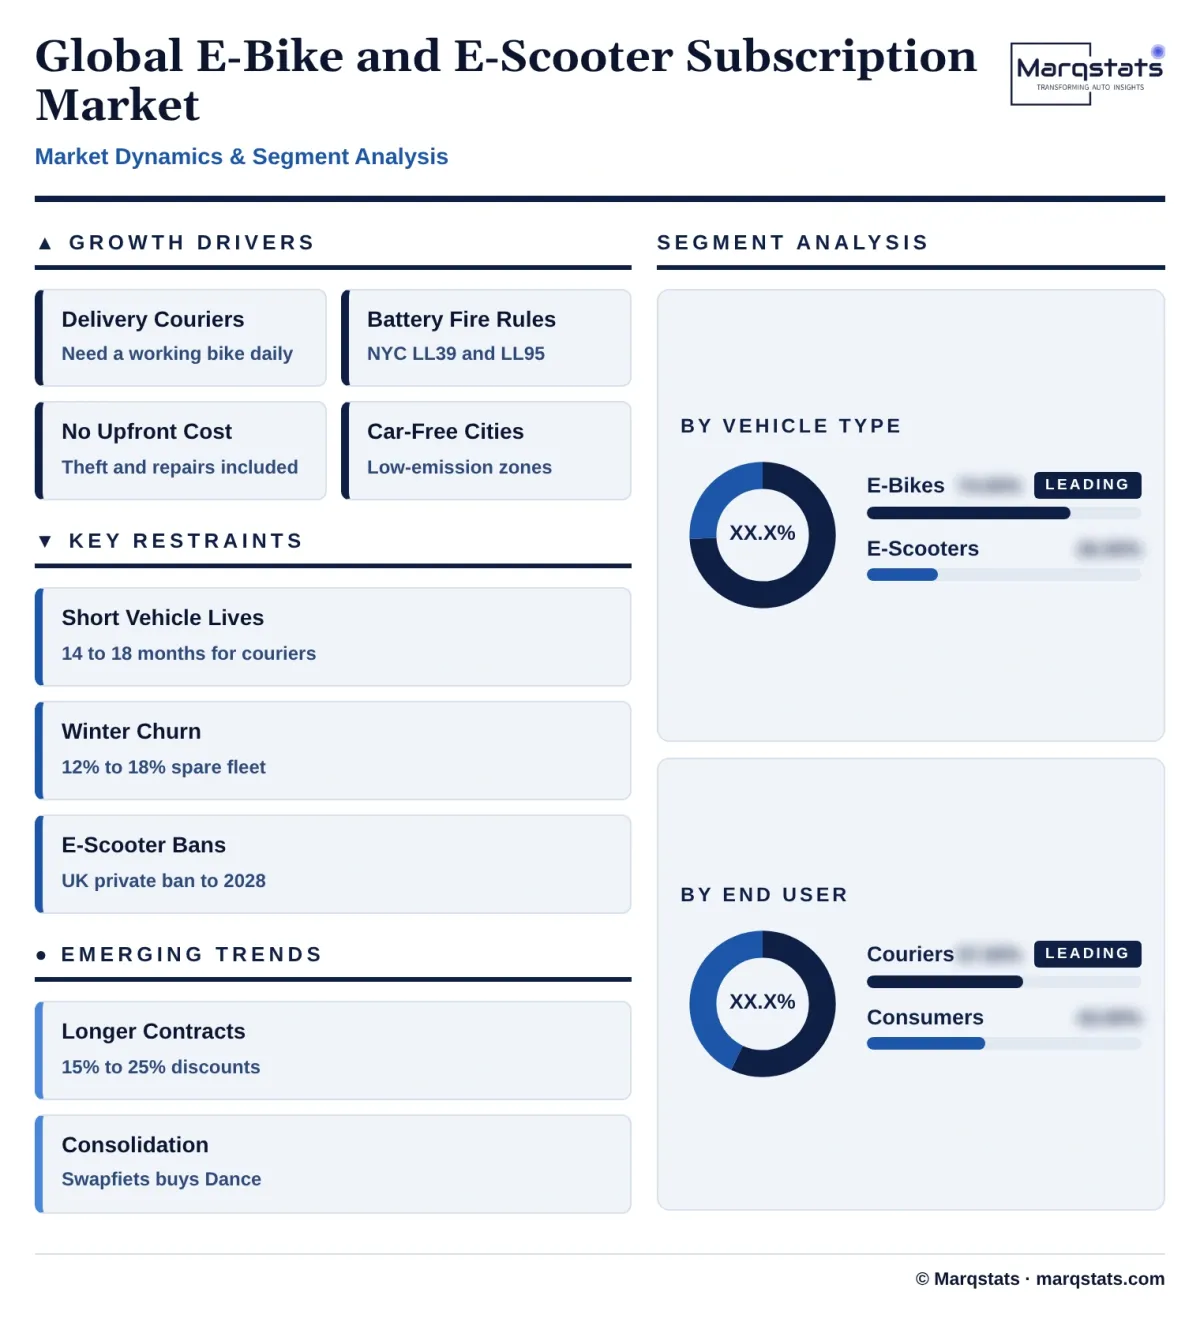
- Battery fire rules favour serviced fleets. New York City bans the sale and rental of uncertified e-bikes and batteries under Local Law 39 of 2023, and since January 26, 2026 requires app delivery workers to use certified bikes under Local Law 95 of 2025. Subscription operators that buy certified vehicles and manage batteries take this compliance burden off couriers.
- Avoiding upfront cost and theft risk. A quality e-bike costs USD 1,500 to USD 4,000, and theft is common in large cities. A monthly fee with theft cover and a replacement promise appeals to commuters, students and newcomers to a city.
- Cities discourage car use. Low-emission zones such as those in Paris and London, parking restrictions and new cycle lanes make e-bikes a practical alternative to the car for commuting and deliveries.
- Operators reach scale. Swapfiets reached positive net cash flow in 2024 and bought Dance in May 2026, showing that subscription fleets can be run profitably at scale and attract investment.
Key Restraints
Four constraints limit how fast subscription fleets can grow and how much they earn.
- High wear and short vehicle lives. Delivery e-bikes ride 25,000 to 35,000 kilometres a year and last only 14 to 18 months in courier service, so depreciation takes about 43% of a USD 145 monthly fee.
- Winter churn and idle stock. Consumers in northern Europe and North America cancel in winter, and operators must keep 12% to 18% spare vehicles to honour 24- to 48-hour swap promises, which ties up capital.
- E-scooter restrictions. Private e-scooters cannot legally be ridden on public roads in the UK, where rental trials have been extended to May 2028, and many cities limit e-scooters on pavements and in public transport.
- Rising compliance and insurance costs. Certified batteries, tamper-resistant chargers and theft and liability insurance raise the cost per vehicle, and stricter rules on charging and storing lithium-ion batteries indoors could make home charging harder.
Key Trends
Four shifts are changing how e-bike and e-scooter subscriptions are priced, financed and run.
- Longer contracts with discounts. Operators offer 15% to 25% off for six- to 18-month commitments to cut churn and secure cash flow that banks and lenders will finance.
- Consolidation in Europe. Swapfiets bought Dance in May 2026, adding just over 11,000 e-bikes in Berlin, Paris and other cities, and smaller operators are combining or seeking partners to reach maintenance scale.
- Subscriptions bundled into delivery platform programmes. Delivery apps and cities subsidise certified e-bike subscriptions for couriers, as in the Uber Eats France programme with Zoomo and the New York City trade-in programme for uncertified e-bikes.
- Connected fleets. GPS tracking, remote locking and battery monitoring help operators recover stolen vehicles, plan repairs before breakdowns and check battery health.
Strategic Implications
- For subscription operators, maintenance is the main cost to control. Operators with their own workshops and mobile mechanics earn margins 12 to 15 percentage points higher than those that rely on third-party bike shops, so dense repair networks matter more than marketing.
- For new entrants, specialised courier and cargo fleets offer the clearest opening. Competing with Swapfiets and Decathlon for consumer e-bikes in Western Europe is hard, but cargo e-bikes, delivery fleets for grocery and parcel firms and battery-swap services in large cities are less crowded.
- For delivery platforms, subscriptions reduce risk. Offering couriers certified, insured and serviced e-bikes through subscription partners helps platforms meet battery safety rules and keep couriers working without owning vehicles.
- For e-bike, motor and battery makers, fleet-grade products are a growing channel. Operators want durable frames, motors and batteries certified to UL 2849, UL 2271 and EN 15194, with built-in data on battery health and component wear.
- For lenders and investors, contract mix decides risk. Fleet contracts with delivery platforms and businesses provide steadier income than monthly consumer plans, so debt is best secured against longer contracts and diversified business customers.
Market Segmentation
E-bikes account for 74.00% of 2025 value, USD 1,272.80 million, and grow at 17.12% a year to USD 2,805.25 million and 76.00% of 2030 value. They carry more load, are legal on roads in all major markets and suit both couriers and commuters. Cargo e-bikes from makers such as Urban Arrow command the highest fees, typically USD 185 to USD 340 a month.
Stand-up e-scooters account for 26.00% of 2025 value, USD 447.20 million, and grow at 14.65% a year to USD 885.87 million and 24.00% of 2030 value. Plans are cheaper, typically USD 35 to USD 79 a month, and appeal to students and commuters combining the scooter with public transport, but pavement bans, the UK ban on private e-scooters on public roads and the small wheels that struggle on poor road surfaces limit growth. Unagi offers its Model One Voyager from USD 79 a month across the continental United States.
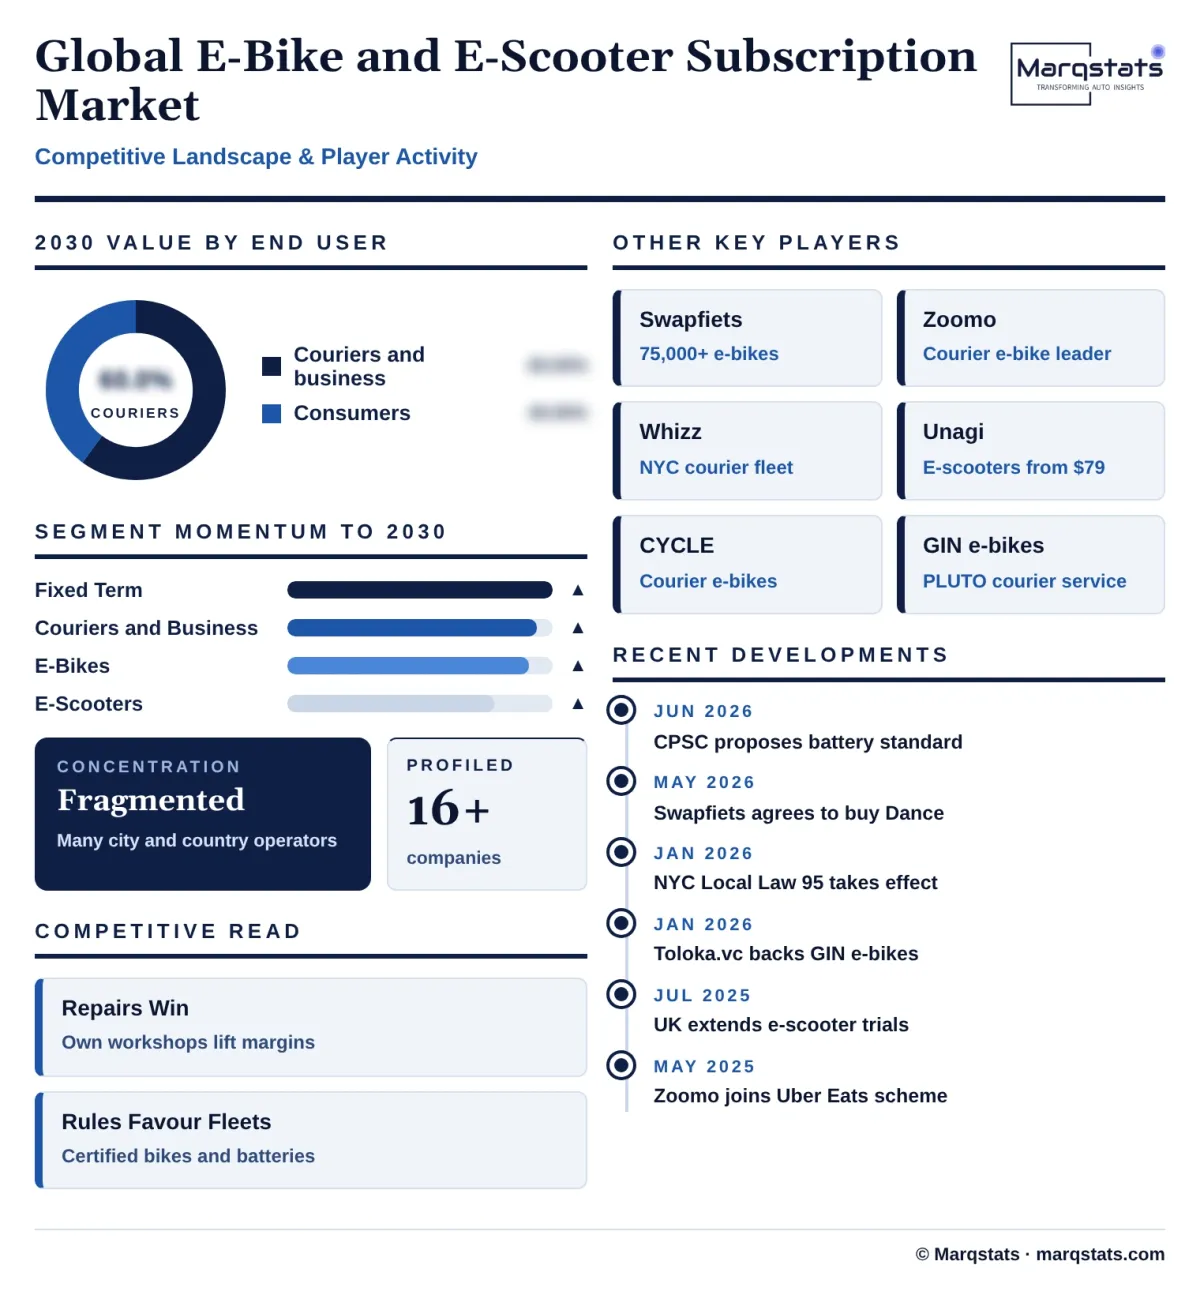
Delivery couriers and business fleets account for 57.00% of 2025 value, USD 980.40 million, and grow at 17.70% a year to USD 2,214.67 million and 60.00% of 2030 value. Couriers working for food, grocery and parcel apps pay about USD 120 to USD 160 a month, use their e-bikes every day and cancel less often in winter than consumers. Zoomo, Whizz, CYCLE and GIN e-bikes, which runs the PLUTO service in London, focus on this group.
Consumers and commuters account for 43.00% of 2025 value, USD 739.60 million, and grow at 14.83% a year to USD 1,476.45 million and 40.00% of 2030 value. They value avoiding upfront cost, theft cover and freedom from unexpected battery and repair bills. Swapfiets, Dance, Unagi, Buzzbike and Decathlon serve this group.
Cancel-anytime monthly plans account for 62.00% of 2025 value, USD 1,066.40 million, and grow at 14.96% a year to USD 2,140.85 million, while their share falls to 58.00% by 2030. They make it easy for gig workers and seasonal commuters to start, but leave operators exposed to winter cancellations and the cost of collecting and refurbishing returned vehicles.
Six-, 12- and 18-month contracts account for 38.00% of 2025 value, USD 653.60 million, and grow fastest, at 18.86% a year, to USD 1,550.27 million and 42.00% of 2030 value. Operators offer 15% to 25% discounts in return for predictable income, and some add rent-to-own options for couriers.
By Geography
Europe
Europe is the largest market, with 61.00% of 2025 value, USD 1,049.20 million, and Marqstats estimates it reaches USD 2,103.94 million by 2030, a 14.93% CAGR, while its share falls to 57.00%. The Netherlands, Germany, France, Belgium and the UK have dense cycle networks and city policies that discourage car use. Swapfiets operates in eight countries and bought Dance in May 2026, and Zoomo, CYCLE, Buzzbike and GIN e-bikes serve couriers. Germany's popular salary-sacrifice leasing schemes make consumers familiar with paying monthly for a bike, while the UK's ban on private e-scooters on public roads steers subscriptions toward e-bikes.
North America
North America accounts for 25.00% of 2025 value, USD 430.00 million, and Marqstats estimates it reaches USD 996.60 million by 2030, an 18.31% CAGR and 27.00% of the market. New York City, the largest delivery e-bike market on the continent, requires certified e-bikes and batteries for sale and rental under Local Law 39 of 2023 and for app delivery workers under Local Law 95 of 2025, effective January 26, 2026. Whizz, Zoomo and JOCO serve couriers, and Unagi offers e-scooter subscriptions across the continental United States. The US Consumer Product Safety Commission proposed a national battery safety standard for e-bikes and e-scooters in June 2026.
Asia-Pacific
Asia-Pacific accounts for 11.00% of 2025 value, USD 189.20 million, and Marqstats estimates it reaches USD 461.39 million by 2030, a 19.52% CAGR and 12.50% of the market. Australia, where Zoomo was founded, has large delivery courier fleets in Sydney and Melbourne, and Japan's rules for low-speed electric kick-scooters have opened a commuter market. India and Southeast Asia rely mainly on electric two-wheelers and mopeds, which fall outside this market.
Rest of World
The rest of the world accounts for 3.00% of 2025 value, USD 51.60 million, and Marqstats estimates it reaches USD 129.19 million by 2030, a 20.15% CAGR and 3.50% of the market, the fastest regional growth from a small base. Delivery courier fleets in Dubai, Riyadh and other Gulf cities, and pilot programmes in Latin American cities, drive demand.
How Competition Is Evolving
The e-bike and e-scooter subscription market is fragmented, with many city and country operators, but a few companies lead each customer group. Swapfiets, owned by Pon Holdings, is the largest consumer operator in Europe, with more than 75,000 subscription e-bikes in 45 cities after buying Dance. Zoomo is the largest courier-focused operator, active in Australia, Europe and North America. Whizz leads courier subscriptions in New York City.
Operators compete on repair speed, vehicle quality and price. Swapfiets promises a repair or swap within 48 hours at no extra cost, and courier operators run depots and mobile mechanics to keep bikes on the road. Scale lowers the cost of vehicles, parts and insurance, which is why consolidation is under way in Europe.
Manufacturers and suppliers shape fleet costs. Urban Arrow and Accell supply cargo and commuter e-bikes, Bosch, Shimano and Bafang supply motors and drive systems, Panasonic and Samsung SDI supply battery cells, and Comodule and IoT Venture supply connected fleet hardware. Many operators also design their own vehicles to make them more durable and easier to repair.
Competition will be decided by maintenance cost per vehicle, access to delivery platform partnerships and the ability to finance fleets cheaply. Operators that combine dense repair networks, certified vehicles and long-term business contracts will grow fastest.
New entrants keep arriving at the courier end of the market. GIN e-bikes raised GBP 186,000 from Toloka.vc in January 2026 to expand its PLUTO subscription service in London, which earned about GBP 158 per bike a month in its pilot, and Whizz raised USD 12 million in 2024 to expand its New York fleet.
Companies Covered
Companies covered in the report include:
Recent Market Activity
Table of Contents
Coverage & Segmentation
The study covers the global e-bike and e-scooter subscription market, with 2025 as the base year, 2021 – 2025 as the historical period and 2026 – 2030 as the forecast period. Values are recurring subscription revenue in US dollars at 2025 average exchange rates, and volumes are vehicles in subscription service. The market is segmented by vehicle type, end user, contract type and region.
Pay-per-minute shared micromobility, retail and wholesale sales, multi-year employer salary-sacrifice bike leasing, unserviced equipment leases, short tourist rentals and subscriptions for non-electric bikes are excluded. Segment splits and 2030 regional values are Marqstats estimates built on operator disclosures, courier and fleet counts, subscription prices and city-level adoption.