Market Snapshot
Middle bar: base-year value × (1 + CAGR), rounded to two decimals. This is a calculated illustration, not a separately researched annual estimate.
The global damaged EV battery logistics market size is estimated at USD 1,533.00 million in 2025 and is projected to reach USD 4,085.12 million by 2030, growing at a CAGR of 21.66% over 2026 – 2030. The number of damaged, defective and recalled traction battery packs handled each year grows from about 420,000 to 1,045,000, a 20.00% annual rate, while the average cost of handling each pack rises from about USD 3,650 to USD 3,909.
Marqstats defines the market as spending on the triage, certified packaging, quarantine storage and dangerous goods transport of damaged, defective and recalled lithium-ion traction batteries from electric cars, commercial vehicles and light electric vehicles, and of rejected cells and modules from battery plants. Healthy end-of-life batteries moving through standard collection programmes, recycling and shredding fees, battery repair and second-life refurbishment are excluded.
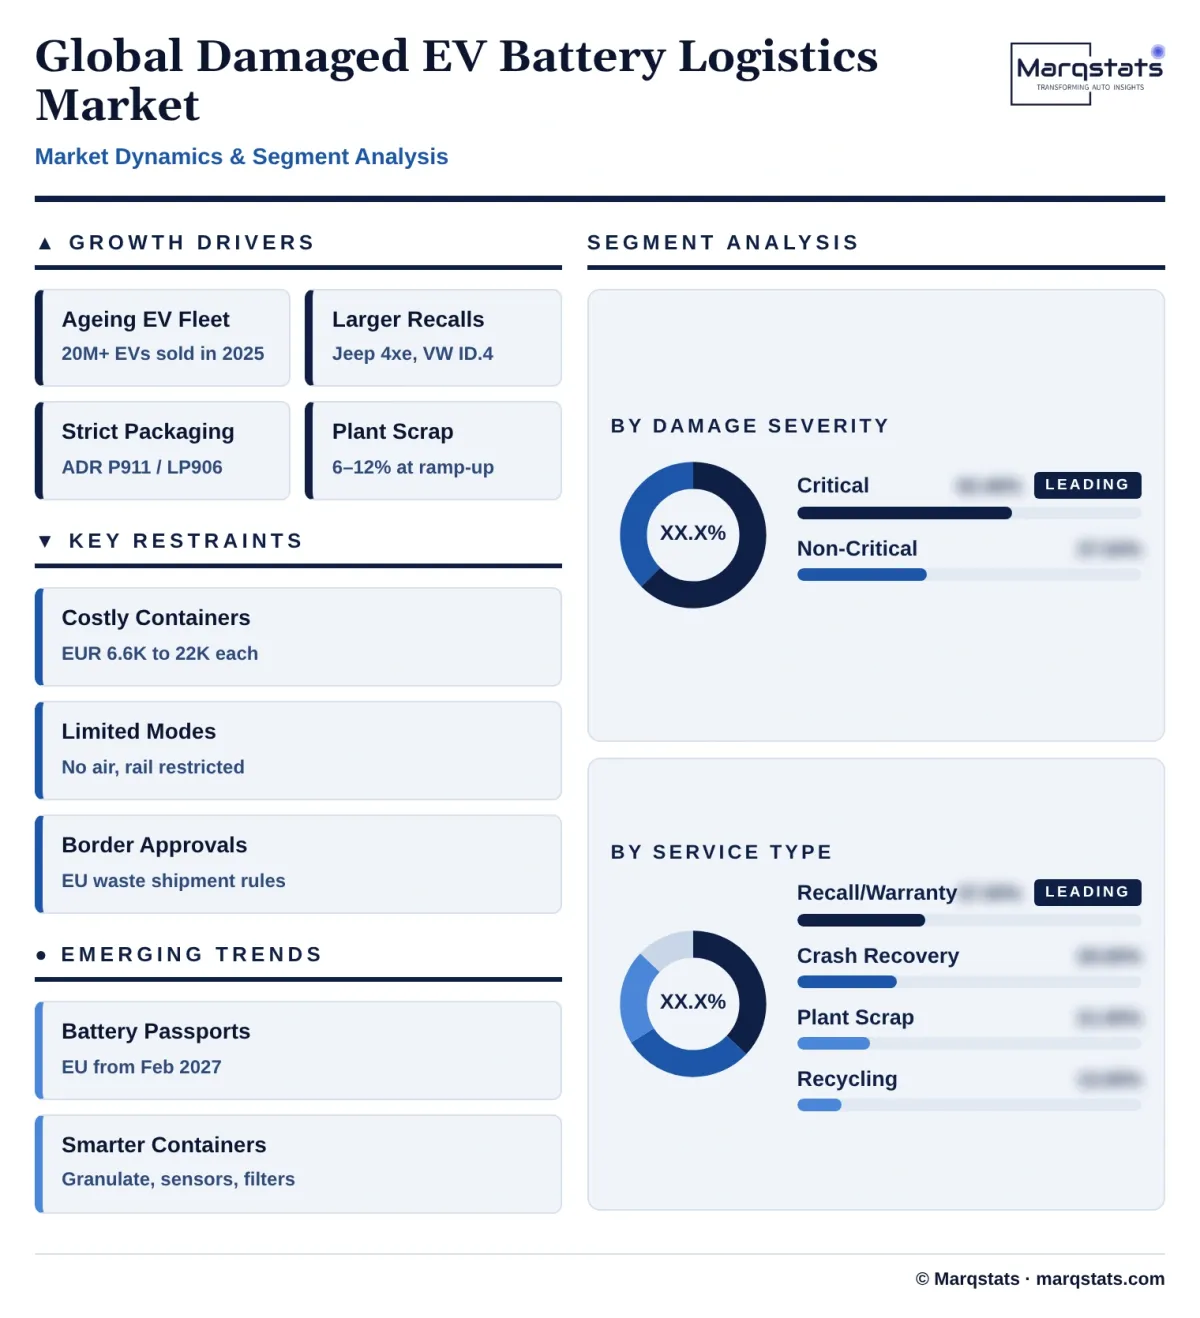
Critical damaged batteries, which are liable to catch fire or react dangerously, account for an estimated 62.46% of 2025 spending. OEM recall and warranty logistics account for 37.00% and passenger vehicle batteries for 72.50%. Asia-Pacific accounts for 46.50% of 2025 spending and Europe for 31.00%. The study segments the market by damage severity, service type, vehicle type and region.
Key Takeaways
Market Overview & Analysis
Report Summary
Marqstats sizes the damaged EV battery logistics market as spending on handling, packaging, storing and transporting lithium-ion traction batteries that are damaged, defective or recalled. In 2025 the market was worth an estimated USD 1,533.00 million and handled about 420,000 packs and equivalent module assemblies. The market grew from USD 615.40 million in 2021, USD 785.20 million in 2022, USD 998.60 million in 2023 and USD 1,245.00 million in 2024.
Damaged lithium-ion batteries are among the most tightly regulated dangerous goods. A damaged cell can short-circuit internally hours or days after a crash, reach temperatures above 1,000 °C, release toxic and flammable gases including hydrogen fluoride, and eject burning material. Every step from roadside recovery and dealer quarantine to road transport and recycling plant intake is covered by dangerous goods rules.
Four sources supply damaged batteries. Battery plants reject cells and modules with coating, winding or formation defects, with scrap rates of 6% to 12% during plant ramp-up and 3.5% to 5% on mature lines. Road crashes and flooding damage battery packs mounted under vehicles. OEM recalls pull back modules with manufacturing or software defects. Dealer warranty returns bring back packs with premature capacity loss or cell imbalance. Marqstats estimates plant scrap accounted for about 185,000 units in 2025, crashes and flooding for 118,500, recalls for 78,200 and warranty returns for 38,300.
Classification decides cost. Under the European road dangerous goods agreement ADR, special provision 376 requires damaged batteries to be assessed as either non-critical, which may move in packaging under packing instructions P908 or LP904, or critical, which must move in packaging under P911 or LP906 that keeps the outer surface below 100 °C during a full thermal runaway. In the United States, 49 CFR 173.185(f) governs damaged, defective and recalled batteries and bans them from aircraft, and large traction packs usually move under special permits issued by the Pipeline and Hazardous Materials Safety Administration. China sets packing and transport rules for used traction batteries under GB/T 38698.1-2020 and take-back network rules under GB/T 38698.2-2023.
Damaged batteries are handled by three groups. Dangerous goods logistics providers such as DHL Supply Chain, RPM and Bluewater Battery Logistics collect and transport batteries. Packaging makers such as ZARGES, Genius, BUNCKER, Bauer and Americase build certified fire-containment boxes. Recyclers and stewardship organisations such as Call2Recycle, Redwood Materials, Cirba Solutions, Umicore and Li-Cycle receive, discharge and recycle the batteries.
Triage happens before transport. Certified high-voltage technicians inspect each suspect battery visually, with thermal cameras and with electronic tests of insulation resistance and cell voltages, before deciding how it must be packed. Batteries showing self-heating or serious internal faults, or vehicles that have been flooded, burned or deformed in a crash, are held in outdoor quarantine yards with about 15 metres of separation from buildings and continuous infrared monitoring, at a cost of about USD 45 to 120 per day, until they are stable enough to move.
Global Damaged EV Battery Logistics Market Size and Forecast
The global damaged EV battery logistics market grows from USD 1,533.00 million in 2025 to USD 4,085.12 million in 2030, a CAGR of 21.66%. Marqstats expects USD 1,885.50 million in 2026, USD 2,310.20 million in 2027, USD 2,815.80 million in 2028 and USD 3,410.50 million in 2029. Annual growth slows gradually from about 23% in 2026 to about 20% in 2030 as the EV fleet grows from a larger base.
Volumes grow with the fleet. The number of packs handled rises from about 420,000 in 2025 to 510,000 in 2026, 615,000 in 2027, 735,000 in 2028, 880,000 in 2029 and 1,045,000 in 2030. Growth comes from the ageing of electric vehicles sold since 2018, the expiry of eight-year battery warranties on the first high-volume model years, new battery plants with high ramp-up scrap rates and larger recalls.
Unit costs rise rather than fall. Marqstats estimates the average cost of handling a damaged pack rises from about USD 3,326 in 2021 and USD 3,650 in 2025 to USD 3,909 in 2030. Larger bus and truck packs, longer routes to a small number of specialised recycling plants and wider use of P911-certified containers outweigh efficiency gains from better diagnostics.
Costs vary sharply by condition. Marqstats estimates moving a healthy end-of-life pack costs USD 410 to 870 in total, including USD 60 to 120 for a standard steel rack and USD 250 to 550 for shared freight. A non-critical damaged pack costs USD 1,300 to 2,730, including a certified box rental of USD 350 to 700 and specialised regional freight of USD 550 to 1,100. A critical pack costs USD 4,200 to 10,550, including USD 1,200 to 2,800 for a heavy containment box, USD 350 to 850 for fire-suppressing granulate, USD 1,800 to 4,200 for a dedicated truck, USD 450 to 1,200 for high-voltage extraction and USD 400 to 1,500 for monitored quarantine.
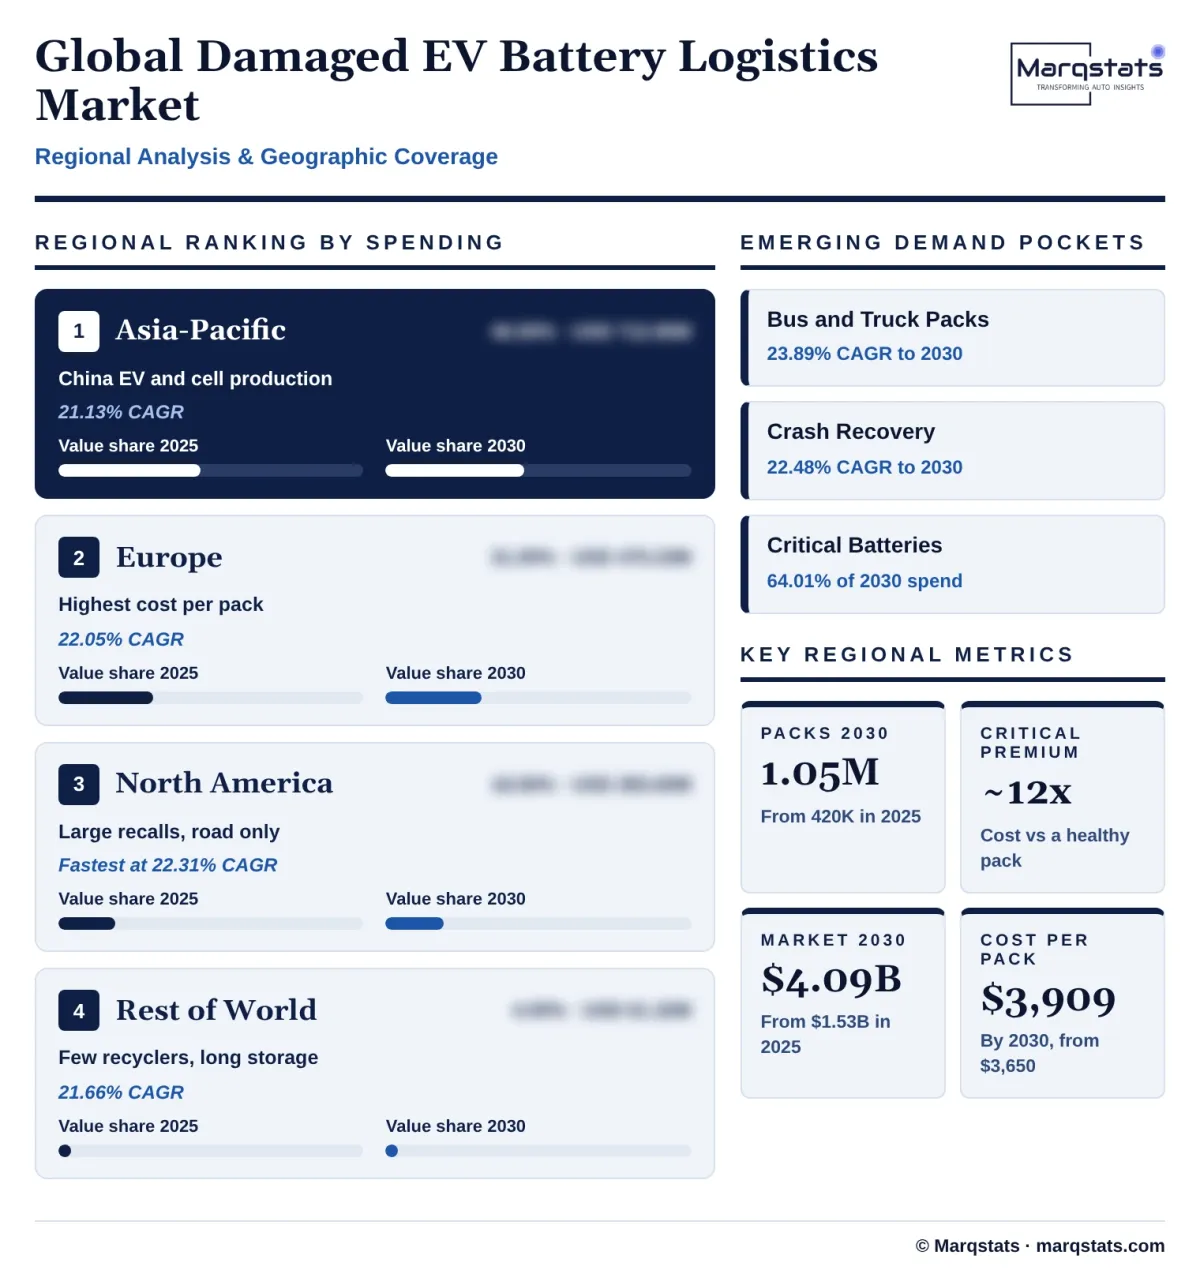
The mix shifts slightly towards critical batteries and heavy vehicles. Critical batteries rise from 62.46% to 64.01% of spending, commercial vehicle batteries from 21.00% to 23.00%, and crash recovery from 29.00% to 30.00%. Asia-Pacific remains the largest region, while Europe and North America gain share as compliance costs rise.
Marqstats tracks four indicators to monitor the forecast: the number and size of battery-related recalls filed with safety regulators, electric vehicle crash and flood claims reported by insurers, scrap rates at new battery plants, and rental and purchase prices of certified containment boxes. Larger recalls or stricter rules requiring critical packaging for every crash-damaged battery would push spending above the base path, while better onboard diagnostics and battery passports that reduce misclassification of healthy batteries would slow it.
Market Dynamics
Key Drivers
Five forces are expanding spending on moving damaged and defective EV batteries.
- The EV fleet is growing and ageing. More than 20 million electric cars were sold worldwide in 2025, and as vehicles sold since 2018 age, more batteries fail, are damaged in crashes or reach the end of their warranties.
- Recalls are getting larger. Battery recalls such as Stellantis campaign 25V741 for about 320,000 plug-in hybrids and Volkswagen campaign 26V030 for 43,881 ID.4 vehicles require dealers to test, isolate and return large numbers of suspect modules.
- Packaging rules are strict. ADR special provision 376 requires critical batteries to move in P911 or LP906 packaging that keeps the outer surface below 100 °C, and the transition period for the ADR 2025 amendments ended on 30 June 2025.
- Battery plants generate scrap. New gigafactories in China, Europe and North America reject 6% to 12% of output during ramp-up, and rejected cells cannot be stored on factory floors because of fire risk.
- Insurers and fire codes demand fast removal. Underwriters and fire authorities require damaged electric vehicles to be stored with physical separation and monitoring, pushing tow operators, salvage yards and body shops to move them out quickly with specialised carriers.
Key Restraints
Four constraints raise the cost and slow the movement of damaged EV batteries.
- Certified containers are expensive and scarce. Heavy containment boxes for large packs cost about EUR 6,600 to 22,000 each and weigh 400 to 1,200 kg empty, reducing truck payloads and raising freight costs.
- Transport options are limited. Damaged batteries cannot travel by air, many rail operators restrict them, and shared less-than-truckload networks usually refuse critical batteries, leaving dedicated trucks as the main option.
- Cross-border shipments need approval. The EU waste shipment regulation requires prior written consent and financial guarantees for hazardous battery waste, slowing movements to recyclers in Germany, Belgium and the Nordic countries.
- Skilled staff are scarce. High-voltage technicians for field triage and drivers with dangerous goods qualifications are in short supply in many markets.
Key Trends
Four shifts are changing how damaged EV batteries are classified, packed and moved.
- Battery passports improve classification. The EU Battery Regulation requires digital battery passports for electric vehicle batteries placed on the EU market from February 2027, giving handlers access to state-of-health and fault data that help separate genuinely dangerous batteries from healthy ones.
- Logistics providers build battery centres. DHL operates EV Centers of Excellence in Europe, the Americas and Asia-Pacific and offers a red-status service for accident-damaged batteries, and other carriers are building similar networks.
- Special permits shape US packaging. The Pipeline and Hazardous Materials Safety Administration issued the sixth revision of special permit DOT-SP 21442 in July 2026 for alternative packaging of damaged, defective and recalled lithium-ion batteries by road and rail, and other permits cover larger containers.
- Containers are getting smarter. New boxes combine fire-suppressing granulate, gas filters and temperature sensors, and products such as the Obexion AG Bin carry special permits for shared freight.
Strategic Implications
- For carmakers and battery makers, safe returns protect the brand. A battery fire during transport costs far more than certified packaging, so OEMs need pre-qualified carriers, container pools and dealer training before a recall begins.
- For logistics providers, permits are the barrier to entry. Profit comes from dangerous goods authorisations, trained drivers, triage technicians and container fleets rather than freight volume, and providers that link dealers, salvage yards and battery plants directly with recyclers will win long-term contracts.
- For packaging makers, rental models fit demand. Recalls create sudden demand peaks, so pooled rental of certified boxes can serve OEMs better than outright sale.
- For recyclers, intake capacity matters. Recyclers that can receive critical batteries safely, with immersion tanks, inert-gas shredders and quarantine yards, can capture more feedstock and reduce transport distances.
- For regulators, faster approvals cut risk. Electronic waste shipment notifications, clear triage criteria and faster special permit processing would reduce the time damaged batteries spend in storage.
- For insurers and salvage operators, damaged electric vehicles need separate handling. Separate storage areas, fast triage and contracts with specialised carriers reduce fire risk and storage costs and help settle claims faster.
Market Segmentation
Critical damaged batteries, liable to catch fire or react dangerously after crashes, fires, flooding or internal short circuits, account for 62.46% of 2025 spending, USD 957.50 million and about 180,000 units, and grow at 22.25% a year to USD 2,615.00 million and 64.01% of the market by 2030. They require P911 or LP906 containment in Europe and special permit packaging in the United States.
Non-critical damaged batteries, with capacity loss, battery management system faults or minor casing damage but no thermal instability, account for 37.54% of 2025 spending, USD 575.50 million and about 240,000 units, and grow at 20.63% a year to USD 1,470.12 million and 35.99% of the market by 2030.
Returning recalled and defective modules from dealers to testing hubs accounts for 37.00% of 2025 spending, USD 567.21 million and about 155,400 units, and grows at 21.33% a year to USD 1,491.07 million, 36.50% of 2030 spending.
Emergency recovery, towing and transport of crash-damaged and flooded vehicles and batteries accounts for 29.00% of 2025 spending, USD 444.57 million and about 121,800 units, and grows fastest, at 22.48% a year, to USD 1,225.54 million and 30.00% of the market by 2030.
Moving rejected cells and modules from battery plants to pre-treatment and shredding sites accounts for 21.00% of 2025 spending, USD 321.93 million and about 88,200 units, and grows at 21.07% a year to USD 837.45 million.
Shipping damaged batteries to licensed recyclers under hazardous waste permits accounts for 13.00% of 2025 spending, USD 199.29 million and about 54,600 units, and grows at 21.66% a year to USD 531.06 million.
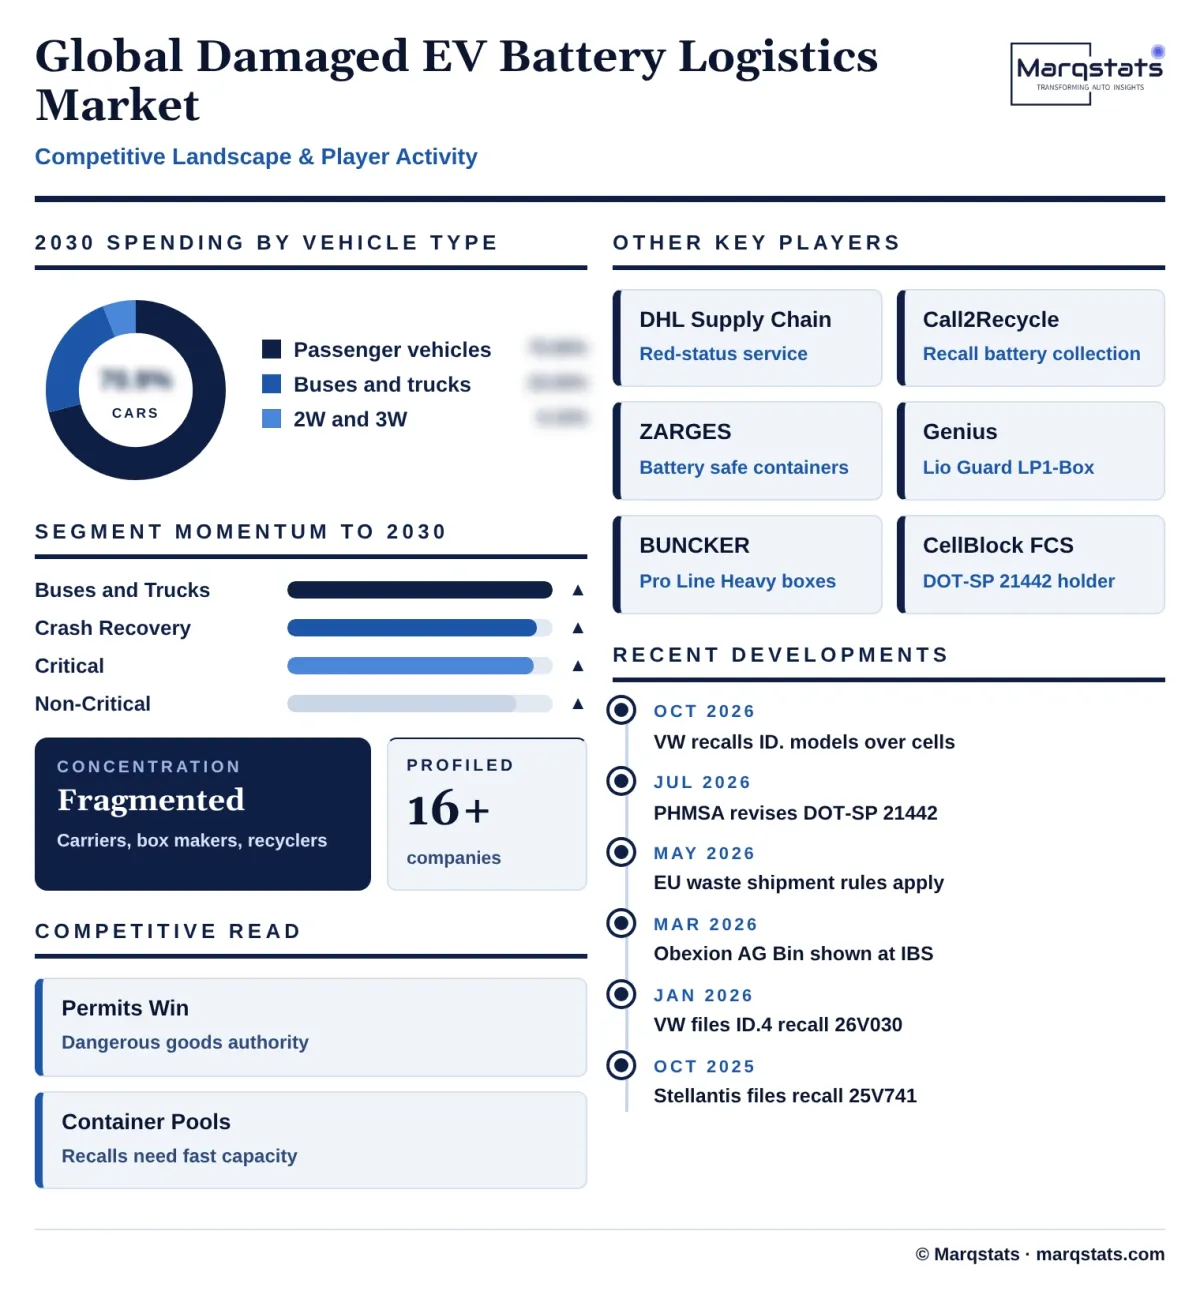
Battery electric and plug-in hybrid cars and light commercial vehicles account for 72.50% of 2025 spending, USD 1,111.43 million and about 304,500 units, and grow at 21.11% a year to USD 2,896.35 million, 70.90% of 2030 spending.
Electric buses and medium and heavy trucks account for 21.00% of 2025 spending, USD 321.93 million and about 88,200 units, and grow fastest, at 23.89% a year, to USD 939.58 million and 23.00% of the market by 2030, because their large packs need heavy containment frames and special handling.
Electric two- and three-wheelers and other light vehicles account for 6.50% of 2025 spending, USD 99.64 million and about 27,300 units, and grow at 20.12% a year to USD 249.19 million, using smaller certified containers with lower freight costs per unit.
By Geography
Asia-Pacific
Asia-Pacific is the largest market, with 46.50% of 2025 spending, USD 712.85 million, rising to USD 1,858.73 million by 2030, a 21.13% CAGR. China produced nearly 75% of the world's electric cars in 2025 and most lithium-ion cells, and national standards require traceability of traction batteries and certified take-back outlets. Battery plant clusters in Jiangsu, Guangdong and Sichuan create dense routes between factories and recyclers.
Europe
Europe accounts for 31.00% of 2025 spending, USD 475.23 million, rising to USD 1,286.81 million by 2030, a 22.05% CAGR, and has the highest cost per pack. ADR P911 packaging rules, extended producer responsibility under the EU Battery Regulation and the EU waste shipment regulation, applicable since 21 May 2026, raise compliance costs, while recycling capacity is concentrated in Germany, Belgium and the Nordic countries, lengthening cross-border routes.
North America
North America accounts for 18.50% of 2025 spending, USD 283.60 million, rising to USD 776.17 million by 2030, a 22.31% CAGR. Large recalls such as Stellantis 25V741 and Volkswagen 26V030 drive volumes. Air transport is banned and rail is often restricted, so damaged packs move by road under special permits from dealers on both coasts to recyclers in Nevada, Tennessee and the Southeast.
Rest of World
The Middle East, Latin America and Africa account for 4.00% of 2025 spending, USD 61.32 million, rising to USD 163.41 million by 2030, a 21.66% CAGR. Many countries lack certified container production and battery recycling plants, so damaged batteries are stored locally until sea transport is approved.
How Competition Is Evolving
The damaged EV battery logistics market is fragmented across three groups of companies. Dangerous goods logistics providers collect, triage and transport batteries. Packaging makers design and certify fire-containment boxes. Recyclers and stewardship organisations receive and process the batteries and often organise collection.
Large logistics groups are building dedicated battery networks. DHL Supply Chain operates EV Centers of Excellence in Europe, the Americas and Asia-Pacific and offers a red-status service for accident-damaged batteries. RPM and Bluewater Battery Logistics manage dealer returns, impound recoveries and energy storage decommissioning in the United States under special permits.
Packaging makers are concentrated in Germany and the United States. ZARGES, Genius, Bauer, BUNCKER, ENVAION and Americase supply boxes and cabinets for damaged batteries, with heavy containers for large traction packs costing about EUR 6,600 to 22,000 each, and DGeo's Obexion AG Bin holds special permit DOT-SP 21619 for shared freight.
Recyclers and stewardship programmes anchor demand. Call2Recycle coordinates collection of recalled and damaged batteries in North America, and Redwood Materials, Cirba Solutions, Umicore and Li-Cycle operate intake facilities able to receive damaged batteries.
Competition will be decided by permits, container fleets and network reach. Providers that combine dangerous goods authorisations in several countries, pools of certified containers, trained triage technicians and contracts with recyclers will win OEM recall and warranty programmes.
Container rental and pooling are emerging. Because recalls create sudden peaks in demand for certified boxes, OEMs and logistics providers increasingly rent containers or share pools of them rather than buying fleets that stand idle between campaigns. Distributors such as LionCare in Europe list boxes from several manufacturers, from small boxes for modules to heavy containers rated for packs of about 94 kWh to 111 kWh.
Companies Covered
Companies covered in the report include:
Recent Market Activity
Table of Contents
Coverage & Segmentation
The study covers the global damaged EV battery logistics market, with 2025 as the base year, 2021 – 2025 as the historical period and 2026 – 2030 as the forecast period. Values are in US dollars and volumes are packs and equivalent module assemblies handled each year. The market covers triage, certified packaging, quarantine storage and dangerous goods transport of damaged, defective and recalled traction batteries and battery plant scrap, segmented by damage severity, service type, vehicle type and region.
Healthy end-of-life batteries moving through standard collection programmes, recycling, shredding and refining fees, battery repair and second-life refurbishment are excluded. Segment, volume and regional splits are Marqstats estimates built on dangerous goods rules, recall filings, fleet and battery production data, container prices and freight rate benchmarks.