Market Snapshot
Key Takeaways
Market Overview & Analysis
Report Summary
The Asia-Pacific car wash services market comprises professional and informal operators cleaning passenger and light commercial vehicles across four service formats — manual and hand wash, in-bay automatic, tunnel/conveyor, and self-service — monetized through pay-per-wash and membership plans. The 2025 market of USD 15.14 billion aggregates China (USD 9.61 billion), Japan (USD 1.68 billion), the Rest of Asia-Pacific (USD 1.49 billion), South Korea (USD 0.94 billion), Australia (USD 0.80 billion), and India (USD 0.61 billion).
Asia-Pacific's defining feature is the extreme divergence of national systems around a dominant Chinese core. China, at nearly two-thirds of regional revenue, pairs a manual wash-and-beauty base with the world's deepest membership culture and a fast-scaling unmanned smart-wash frontier. Japan is the most machine-automated market on earth, with drive-through machines at fuel-station forecourts generating the bulk of revenue. India is the most informal market, dominated by local washers and doorstep services, and the fastest-growing. South Korea centres on fuel-station roll-overs and a premium hand-wash culture, and Australia mirrors Western markets with self-service, express tunnels, and hand-wash cafes.
Aggregated across the five modeled major markets, manual and hand wash holds the largest share at about 50% of 2025 revenue (USD 6.79 billion), reflecting China's wash-and-beauty base and India's informal sector, followed by in-bay automatic at about 30% (USD 4.13 billion), tunnels at about 12% (USD 1.57 billion), and self-service at about 8% (USD 1.15 billion). This manual-led structure is unique among regions — Europe is led by in-bay automatic and North America by tunnels — and reflects the weight of low-cost, labour-intensive washing in the region's two largest emerging markets.
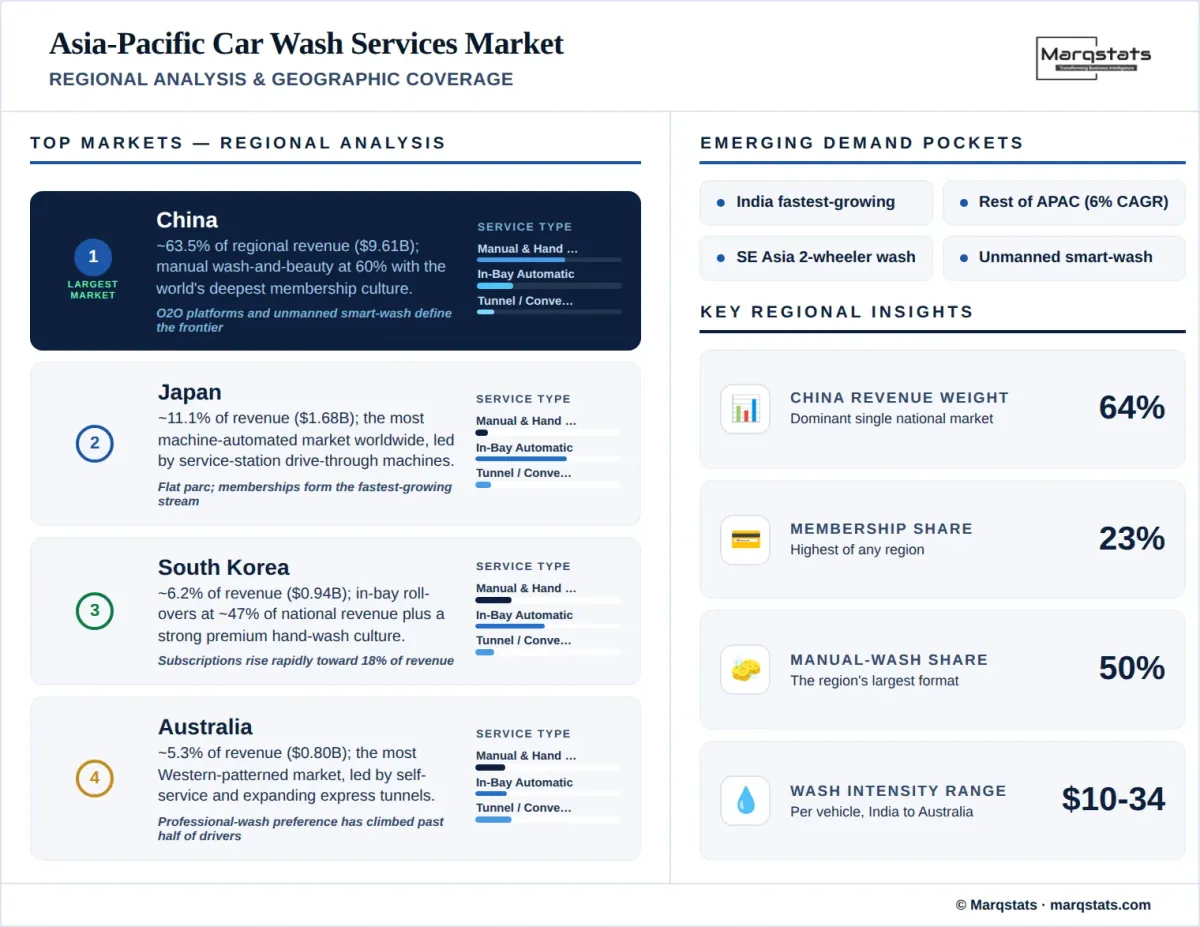
Membership is the region's most distinctive financial feature, reaching about 23% of modeled-market revenue in 2025, the highest of any region, driven almost entirely by China's stored-value cards and app-based plans. Wash intensity per vehicle spans an unusually wide gradient — about USD 34 in Australia and South Korea, USD 25 in China, USD 20 in Japan, USD 14 across the Rest of Asia-Pacific, and USD 10 in India — versus roughly USD 66 in the United States. Affluent Australia and South Korea sit at the top on high tickets, while low tickets hold China and Japan below them despite their scale.
The region also carries substantial uncounted activity. The Rest of Asia-Pacific — spanning Indonesia, Thailand, Malaysia, Vietnam, the Philippines, Taiwan, and New Zealand — is manual-dominated at ultra-low tickets, and its enormous two-wheeler parcs generate large volumes of motorcycle washing that sit outside this four-wheel measurement, representing structural upside. Asia-Pacific is also a global equipment hub, home to Japan's Daifuku and China's domestic makers, whose low-cost systems accelerate automation across the region and in export markets.
Market Dynamics
Key Drivers
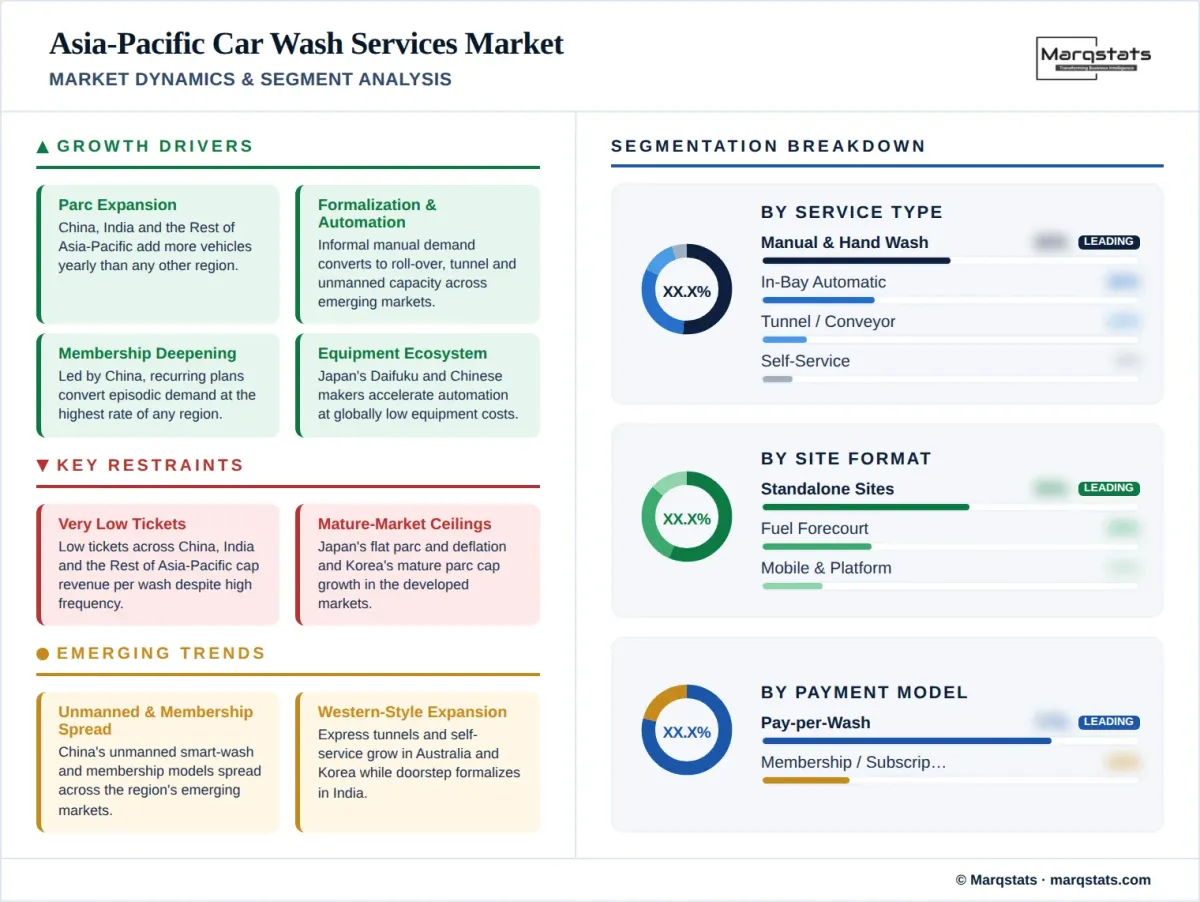
- Vehicle-parc expansion across China, India, and the Rest of Asia-Pacific adds more vehicles annually than any other region, the primary volume driver.
- Formalization and automation convert informal manual demand into organized roll-over, tunnel, and unmanned capacity across emerging markets.
- Membership deepening, led by China, converts episodic demand into recurring revenue at the highest rate of any region.
- Premiumization and real pricing gains lift tickets from low bases in China, India, and the Rest of Asia-Pacific.
- A domestic equipment ecosystem, led by Japan's Daifuku and Chinese makers, accelerates automation at globally low costs.
- Water-scarcity rules across Chinese and Indian metros favour compliant, water-efficient organized operators.
Key Restraints
- Very low tickets across China, India, and the Rest of Asia-Pacific cap revenue per wash despite high frequency.
- Intense fragmentation among informal operators limits pricing power and brand differentiation region-wide.
- Japan's flat parc and deflation, and South Korea's mature parc, cap growth in the developed markets.
- Water-use restrictions and wastewater rules raise compliance costs for water-intensive formats in major metros.
Key Trends
- Unmanned smart-wash stations scale in China and begin appearing in other emerging Asian markets.
- Membership and app-based subscription plans spread from China across South Korea, Australia, and Japan.
- Express tunnels and self-service formats expand in Australia and South Korea on Western-style economics.
- Doorstep and mobile washing formalizes in India and other emerging markets through app platforms.
- Water reclamation and touch-free systems gain adoption as water rules tighten and electric-vehicle parcs rise.
Market Segmentation
Manual and hand-wash formats hold the largest share at about 50% of 2025 modeled-market revenue, USD 6.79 billion, concentrated in China's wash-and-beauty shops at about 60% of national revenue and India's informal sector at about 88%. South Korea and Australia add premium hand-wash and mobile segments. The regional share eases gradually as automation advances, yet manual washing remains the region's structural core, sustained by low labour costs and daily-cleaning habits across the emerging markets.
In-bay automatic formats hold about 30% of 2025 modeled-market revenue, USD 4.13 billion, spanning Japanese drive-through machines at fuel stations, Korean and Chinese forecourt roll-overs, and emerging Indian installations. The format leads Japan at about 62% and South Korea at about 47% of national revenue, and gains share region-wide as emerging markets automate from a manual base, making it the primary beneficiary of the region's organized shift.
Tunnel/conveyor washes hold about 12% of 2025 modeled-market revenue, USD 1.57 billion, and are the fastest-growing format in several markets. Australia leads at about 25% of national revenue and rising toward 28%, with express tunnels expanding on Western-style membership economics, while China's tunnels grow fastest from a smaller base. The format concentrates in affluent and high-throughput metros across the region.
Self-service bays hold about 8% of 2025 modeled-market revenue, USD 1.15 billion, with the highest national weightings in Australia at about 29% and South Korea at about 21%. Japanese coin-wash parks add a substantial base. The format suits high-cost-labour developed markets and price-sensitive users, and holds steady as automated formats expand elsewhere.
Standalone sites hold about 55% of 2025 modeled-market revenue, USD 7.45 billion, spanning Chinese wash-and-beauty shops, Indian informal and organized outlets, Australian dedicated centres, and Japanese coin-wash parks. The share reflects the dominance of dedicated and informal standalone washing across the region's largest markets.
Forecourt washes hold about 29% of 2025 modeled-market revenue, USD 3.94 billion, with the highest national weightings in Japan at about 62% and South Korea at about 51%. Fuel retailers — Sinopec, PetroChina, ENEOS, Idemitsu, GS Caltex, SK Energy, and Indian Oil — operate extensive roll-over and machine networks bundled with fuel and convenience retail across the region.
Mobile, parking-lot, and platform-direct formats hold about 16% of 2025 modeled-market revenue, USD 2.25 billion. Chinese O2O platforms and unmanned parking-lot stations, Indian doorstep services, and Australian shopping-centre sites define the region's most technology-driven channel, which grows steadily as app-based washing spreads.
Single-visit payment accounts for about 77% of 2025 modeled-market revenue, USD 10.49 billion, reflecting walk-up demand across forecourt, self-service, and informal formats. The share declines as membership expands, though pay-per-wash remains dominant in India and the Rest of Asia-Pacific, supported by universal mobile-payment rails such as WeChat Pay, Alipay, and UPI.
Membership and subscription reach about 23% of 2025 modeled-market revenue, USD 3.15 billion — the highest of any region — driven almost entirely by China's stored-value cards and app plans at about 29% of Chinese revenue. South Korea and Australia follow at about 12% each and rising toward 18%, while Japan and India grow from lower bases. Recurring revenue is the primary lever operators use to lock in demand across the region's organized segment.
Passenger vehicles generate about 88% of 2025 modeled-market revenue, USD 13.3 billion, reflecting the consumer orientation of washing across the region. The share eases slightly as commercial washing grows faster in the largest markets.
Commercial washing holds about 12% of 2025 modeled-market revenue, USD 1.8 billion, rising through 2030. Ride-hailing, delivery, and logistics fleets — including mobility-as-a-service operators — sustain high-frequency washing across the region's dense metros, with China's electrified fleets the largest single source of demand.
By Geography
China
China is the region's dominant market, contributing USD 9.61 billion, or 63.5% of 2025 regional revenue, and growing at a 5.52% CAGR to USD 12.58 billion by 2030. Manual wash-and-beauty shops hold about 60% of national revenue, in-bay roll-overs about 25%, and prepaid memberships about 29% — the highest of any market. O2O platforms Tuhu, Tmall Yangche, and Meituan organize the fragmented store base, fuel retailers Sinopec and PetroChina expand forecourt washing, and unmanned smart-wash stations led by Yigongli bring three-minute app-paid washes to parking lots and forecourts.
Japan
Japan contributes USD 1.68 billion, or 11.1% of 2025 regional revenue, growing at a 2.36% CAGR to USD 1.89 billion by 2030. The most machine-automated market worldwide, Japan generates about 62% of national revenue from in-bay drive-through machines at service stations operated by ENEOS, Idemitsu apollostation, and Cosmo. A flat parc and post-deflation pricing keep growth modest, and wash memberships form the fastest-growing stream. Domestic maker Daifuku supplies drive-through machines regionally and worldwide.
India
India contributes USD 0.61 billion, or 4.1% of 2025 regional revenue, and is the fastest-growing market at a 7.52% CAGR, reaching USD 0.88 billion by 2030. The most informal market in the region, India draws about 88% of revenue from local washers and service centres, with doorstep and mobile washing the highest of any market at about 18%. Franchise chains such as Exppress Car Wash and CarzSpa formalize the organized layer, and water-scarcity rules, including Bengaluru's 2024 potable-water washing ban, accelerate waterless and recycled-water methods.
South Korea
South Korea contributes USD 0.94 billion, or 6.2% of 2025 regional revenue, growing at a 3.50% CAGR to USD 1.12 billion by 2030. In-bay roll-overs hold about 47% of national revenue, concentrated at fuel-station forecourts operated by GS Caltex, SK Energy, and Hyundai Oilbank, while a strong premium hand-wash and detailing culture and dense self-service base fill out the mix. Wash subscriptions, at about 12% of revenue and rising toward 18%, grow rapidly as operators build recurring plans.
Australia
Australia contributes USD 0.80 billion, or 5.3% of 2025 regional revenue, growing at a 4.10% CAGR to USD 0.97 billion by 2030. The most Western-patterned market in the region, Australia leads on self-service at about 29% and express tunnels at about 25% and rising, with hand-wash cafes and mobile services adding a further fifth of revenue. The Australian Car Wash Association counts roughly 3,500 to 4,000 commercial sites, and professional-wash preference has climbed from about a third to over half of drivers, supporting subscription growth toward 18% of revenue.
Rest of Asia-Pacific
The Rest of Asia-Pacific contributes USD 1.49 billion, or 9.9% of 2025 regional revenue, and is the second-fastest-growing component at a 6.02% CAGR, reaching USD 2.00 billion by 2030. Spanning Indonesia, Thailand, Malaysia, Vietnam, the Philippines, Taiwan, and New Zealand, the market is manual-dominated at ultra-low tickets near USD 2.5, across a large aggregate four-wheel parc. Enormous two-wheeler parcs in Indonesia, Vietnam, and Thailand generate substantial motorcycle washing that sits outside this four-wheel measurement, representing structural upside as motorization and formalization advance.
How Competition Is Evolving
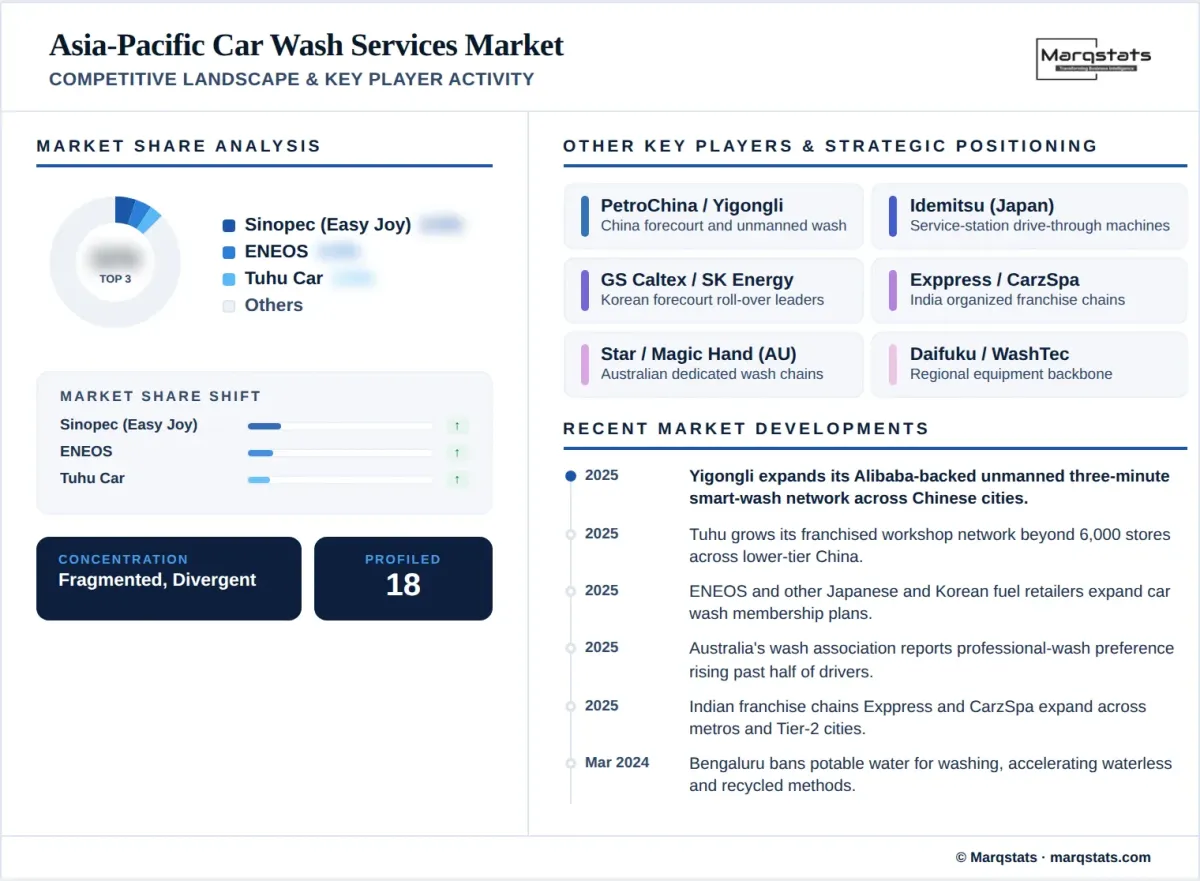
The Asia-Pacific car wash services market is highly fragmented, with no operator holding a material regional share and competitive structures differing sharply by country. In China, organization runs through platforms rather than ownership: Tuhu operates a franchised workshop network exceeding 6,000 stores, and Tmall Yangche and Meituan route demand across independents. In Japan and South Korea, fuel retailers dominate: ENEOS, Idemitsu, GS Caltex, SK Energy, and Hyundai Oilbank operate the widest forecourt machine networks. In India, franchise chains such as Exppress Car Wash and CarzSpa lead the organized layer, and in Australia, dedicated chains such as Star Car Wash and Magic Hand Carwash anchor the market.
Fuel retailers form a pan-regional competitive tier. Sinopec and PetroChina in China, ENEOS and Idemitsu in Japan, GS Caltex and SK Energy in South Korea, Indian Oil in India, and Ampol in Australia operate extensive forecourt wash networks bundled with fuel, convenience, and increasingly electric-vehicle charging. Their scale makes forecourt washing the backbone of supply in the developed and North Asian markets, while platform and franchise models organize the emerging markets.
Technology and equipment define the region's frontier. Japan's Daifuku and China's Autobase supply drive-through and tunnel systems at costs that accelerate automation across the region, unmanned operators led by Yigongli scale water-efficient washing in China, and international makers WashTec and Karcher expand their Asian networks. Competition across all tiers turns on membership penetration, automation economics, water efficiency, and platform reach, with consolidation advancing gradually through franchising, platform aggregation, and fuel-retailer investment through 2030.
Companies Covered
The report profiles 18++ companies with full strategy and financials analysis, including:
Recent Market Activity
Table of Contents
Coverage & Segmentation
This report provides a comprehensive analysis of the Asia-Pacific car wash services market covering the historical period 2021 to 2025 and the forecast period 2026 to 2030, with 2025 as the base year. The study aggregates China, Japan, India, South Korea, and Australia together with the Rest of Asia-Pacific, defining the market as annual revenue earned by professional and informal operators cleaning four-wheel vehicles through manual, in-bay automatic, tunnel/conveyor, and self-service formats, inclusive of basic interior cleaning; two-wheeler washing is addressed qualitatively, and full detailing and equipment or chemical sales are excluded. Market size is presented in value terms (USD billion), with historical figures reflecting yen, won, rupee, and renminbi exchange effects and forecasts assuming constant exchange rates.
The study segments the market by service type, site format, payment model, and vehicle type, with segment aggregates computed across the five modeled major markets, and examines country demand, format divergence, regulation, and competition across all six components. Market sizing aggregates bottom-up country models anchored to the Ministry of Public Security, AIRIA, MoRTH VAHAN, MOLIT, and ABS and BITRE vehicle data, cross-checked against wash intensity per vehicle. The competitive section profiles 18 platforms, fuel retailers, operators, and equipment makers spanning the region.