Market Snapshot
Key Takeaways
Market Overview & Analysis
Report Summary
This report sizes the global electric tractor market — battery-electric agricultural tractors sold or registered as complete machines, across all power classes and all major markets. Coverage spans sub-compact and compact machines under 25 horsepower, utility tractors from 25 to 100 horsepower, and the small number of machines above 100 horsepower that exist as prototypes or pre-order products. Hybrid and diesel-electric drivetrains are excluded because they consume diesel; methane, hydrogen and autonomous diesel machines are excluded but are covered in the analysis, because they compete for the same buyer and the same capital.
The market is very small, and the honest description of it is a sector with a demand signal, a technology and almost no sales. Global deliveries in 2025 are estimated at 768 machines against a world tractor market measured in millions. The venture capital that entered this sector — over USD 250 million, of which one company raised more than USD 200 million and reportedly as much as USD 242 million — has produced two insolvencies, an asset sale to a construction equipment manufacturer, and no published unit data in the United States for any year. That absence is itself a finding: a segment cannot be described as emerging when no institution anywhere considers its volumes worth counting.
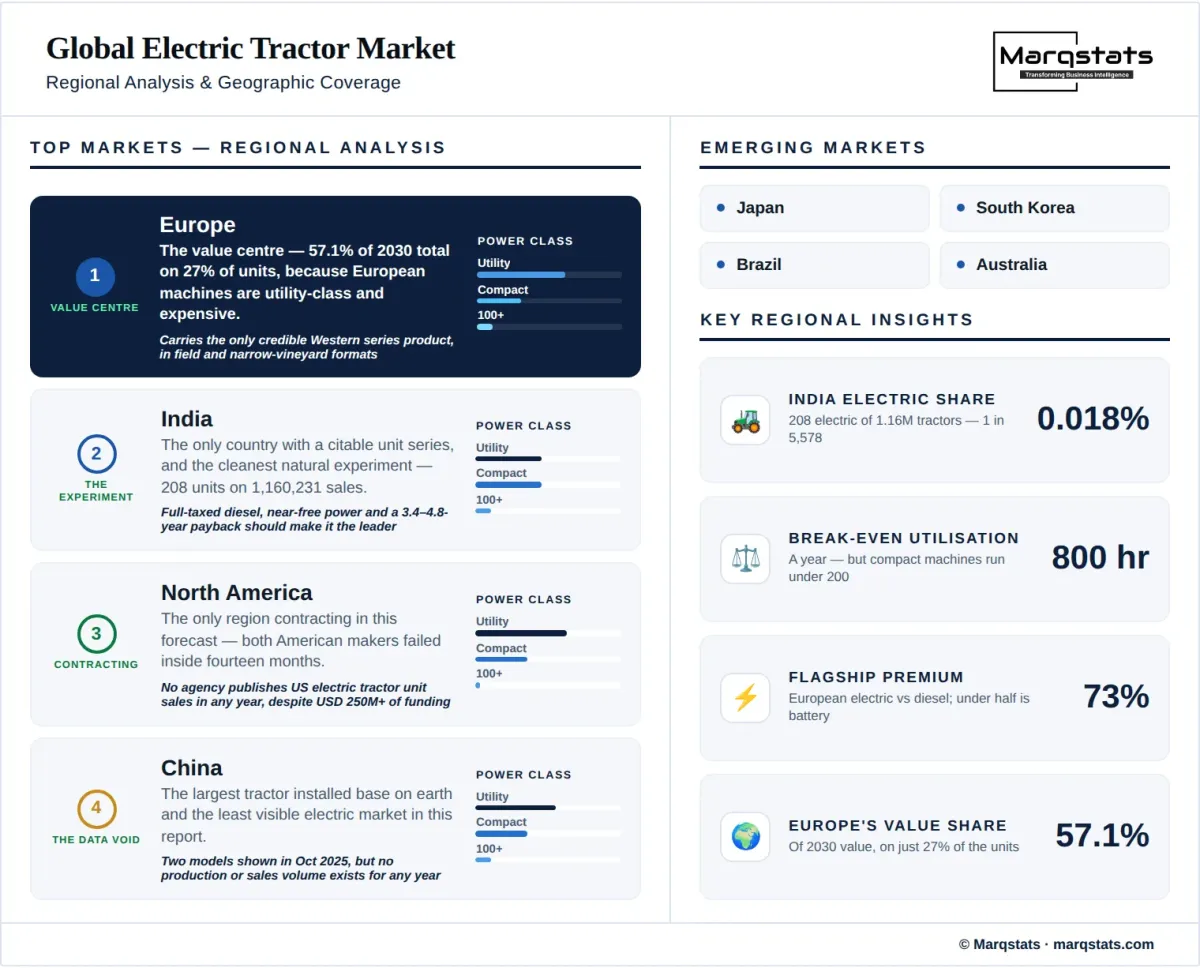
What the market does have is a clear and defensible shape. Value concentrates in Europe, which takes 57.1% of the 2030 total on 27% of the units, because European machines are utility-class and expensive. Units concentrate in India and China, which together take 51% of 2030 deliveries on 20% of the value. North America contracts through 2026 as the two failed American ventures work through, then recovers on a smaller base. The blended average selling price falls 5% a year across the forecast, and readers should not misread that as machines getting cheaper: it is entirely a mix artefact of cheap Indian and Chinese units growing faster than expensive European ones.
Market Dynamics
Key Drivers
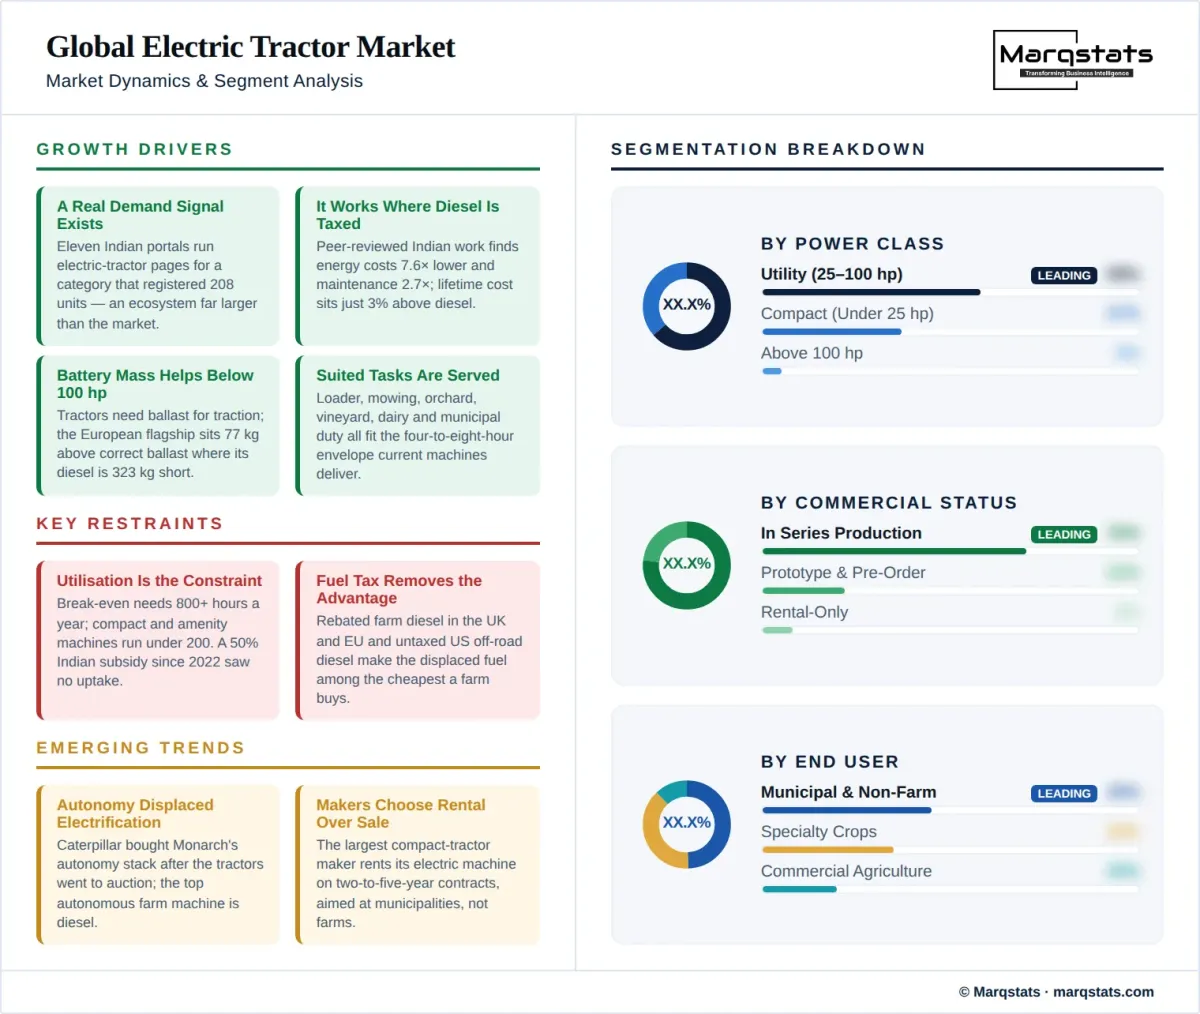
A genuine and measurable demand signal exists, even where sales do not. Eleven Indian tractor portals maintain dedicated electric-tractor category pages for a product category that registered 208 units, which is an information ecosystem an order of magnitude larger than the market it describes. Marqstats could not measure absolute search volumes this cycle and publishes none, but the indirect evidence of buyer interest is consistent and strong.
The operating-cost case is excellent wherever diesel is taxed at full rates. Peer-reviewed Indian work finds energy expenses 7.6 times lower and maintenance costs 2.7 times lower for electric tractors, and a separate Indian total-cost study puts lifetime cost only 3% above diesel despite the purchase premium. Where agricultural diesel carries no rebate, the arithmetic works.
Battery mass is a genuine engineering advantage below roughly 100 horsepower. Tractors need weight for traction, and the flagship European electric machine at 4,500 kilograms sits 77 kilograms above correct mechanical-front-wheel-drive ballast while its diesel equivalent is 323 kilograms short of it. In that power band the pack does structural work the diesel machine has to add cast iron to replicate.
The tasks that suit electrification are real and commercially served. Loader and yard work, mowing, orchard and vineyard operations, dairy and municipal duty, greenhouse and smallholding work all sit within the four-to-eight-hour envelope current machines deliver, and every series-production electric tractor on the market is aimed at one or more of them.
Regulatory friction favours electric machines at the margin. European Stage V emissions rules impose certification and after-treatment cost on diesel engines and do not apply to electric drivetrains, and noise limits give electric machines access to urban, municipal and night-time work that diesel machines are excluded from.
Key Restraints
★ Annual utilisation is the binding constraint and no policy instrument addresses it. Break-even needs more than 800 hours a year; the standard planning assumption for a row-crop tractor is 300, a worked mowing operation 92, and compact and amenity machines often under 200. A compact tractor used 200 hours a year cannot amortise a 73% purchase premium over any realistic life, and this is why subsidy schemes aimed at the price go unclaimed — one Indian state has offered 50% up to five lakh rupees since May 2022 with no recorded uptake.
Fuel taxation removes the operating-cost advantage across the developed markets. Rebated agricultural diesel in the United Kingdom and the European Union, and untaxed off-road diesel in the United States, mean the fuel an electric tractor displaces is among the cheapest energy a farm buys. Germany restored its full rebate in January 2026 and the United Kingdom cut rebated gas oil duty a further 3.7 pence in June 2026, both moving against electrification.
Less than half the price premium is battery, so cheaper cells do not solve it. The flagship European premium works out near GBP 840 per kilowatt-hour of installed pack against a pack price near GBP 400. The remainder is a volume problem — low-rate production of a machine with a small addressable duty cycle — and the duty cycle prevents the volume that would solve it.
The supply base has just contracted sharply and residual values are unestablished. Two American manufacturers have failed, more than 110 unsold new machines were liquidated at auction, and used examples changed hands at roughly half list price at 52 hours. Kubota's decision to rent rather than sell its electric tractor is a considered statement about exactly that risk.
Key Trends
Autonomy is displacing electrification as the value proposition. Caterpillar bought Monarch's technology stack after the tractors themselves went to auction, every dealer lawsuit concerns autonomy rather than the battery, and the most prominent autonomous agricultural machine in the market is diesel. Buyers who were sold labour replacement did not buy an energy transition.
Manufacturers are choosing rental and service models over sale. The world's largest compact tractor maker offers its electric machine only on two-to-five-year rental contracts, and aims it at municipalities rather than farms. Where residual values are unknown and utilisation is low, moving the machine off the customer's balance sheet is the rational structure.
Swappable and modular packs are appearing at the top of the range. A German pre-order machine carries a 200 kilowatt-hour swappable pack with a five-minute exchange and a spare priced at GBP 80,000, and a prototype uses stackable 30 kilowatt-hour modules over a 20 kilowatt-hour fixed base. These address duration without addressing cost, and none is in series production.
India and China are becoming the unit market while Europe remains the value market. India grows at 27.47% and China at 30.26% on unit deliveries to 2030, against 19.14% in Europe — but Europe still holds 57.1% of 2030 value. Any global average price, pack size or growth rate computed across this market is a description of which regional mix was assumed.
Market Segmentation
The segment where the premium is survivable, at 20% to 35% rather than the 73% seen higher up, and where duty cycles genuinely fit a small pack. It is also the segment with the largest non-farm buyer base. Machines here run from roughly USD 20,900 for a small American pre-order product to around 10.75 lakh rupees for the Indian market leader by price.
The commercial centre of the market and where every credible series product sits — the European flagship at 68 to 90 horsepower with a 100 kilowatt-hour pack, the American machines at 70 horsepower, and the Indian 45-horsepower leader. It is also where the premium bites hardest and where the 800-hour break-even is least likely to be met, because these machines are bought for field work they cannot complete on a charge.
Effectively a prototype class. A 130-horsepower machine with a 195 kilowatt-hour modular pack is targeted at limited launch in 2027, and a 110-horsepower pre-order machine carries 200 kilowatt-hours swappable. Independent analysis confirms the large-tractor case as infeasible on current energy density: the battery required for a full working day at these powers exceeds what the machine can carry and still do useful work.
The segment the market is named after and the one it serves least well. Field crop operations need sustained high-draft work that current packs cannot deliver, and their machines run the hours that would justify the premium. Where commercial agriculture does buy electric, it is for yard, loader and materials-handling duty rather than for tillage or harvest.
The strongest genuine agricultural fit. Row spacings suit narrow machines, tasks are low-draft and repetitive, operations are near a building with three-phase power, and the absence of exhaust matters in enclosed and canopy work. The European narrow-format machines are aimed squarely here.
Quietly the most important end user, and the one that explains the machines actually being built. Municipalities buy on noise and emissions rules rather than payback, acreage and lifestyle owners buy compact tractors for very low annual hours where operating cost is irrelevant, and both are served by exactly the sub-100-horsepower machines the technology can deliver. The world's largest compact tractor maker points its electric machine at this buyer explicitly.
By Geography
Europe
The value centre of the market at 57.1% of 2030 total on 27% of units, because European machines are utility-class and expensive. It carries the only credible Western series product, a narrow-format variant for vineyards, a Swiss artisanal builder, a Polish-built compact range and a Japanese-owned rental machine. Marqstats models deliveries rising from 250 in 2025 to 600 in 2030, a 19.14% CAGR — but no European registration series for electric tractors exists, so this is a construction from named machines and production statuses.
North America
The only region contracting in this forecast. Both American manufacturers failed inside fourteen months, over 110 unsold new machines were auctioned, and no agency or association publishes electric tractor unit sales for the United States in any year despite more than USD 250 million of venture funding entering the segment. Marqstats models deliveries falling from 150 in 2025 to 110 in 2026 before recovering to 350 by 2030, on Californian incentive programmes and the compact and municipal buyer rather than on row-crop agriculture.
India
The only country with a citable unit series, and the cleanest natural experiment in the market. Fully taxed diesel, near-free agricultural electricity, high utilisation through custom hiring centres and a derived 3.4-to-4.8-year payback should make this the world's leading market. It registered 208 units against 1,160,231 tractor sales. Marqstats models growth to 700 units by 2030, the fastest unit CAGR of any region at 27.47%, from a base so small that the result is 8.3% of 2030 global value.
China
The largest tractor installed base in the world and the least visible electric market in this report. Two battery-electric models with 141 and 58 kilowatt-hour packs were shown in October 2025, and peer-reviewed review work describes Chinese electric tractors as largely still at the prototype stage. No production or sales volume could be located for any year, so the entire Chinese series here is a Marqstats construction and should be read as an order of magnitude.
Rest of World
Japan, South Korea, Brazil, Australia and the remaining markets together account for under 7% of deliveries throughout the forecast. Korean dynamometer work provides some of the best measured energy-demand data on small electric tractors available anywhere, but no market in this group has a national electric tractor incentive or a registration series, and none has an evidenced series-production domestic machine.
How Competition Is Evolving
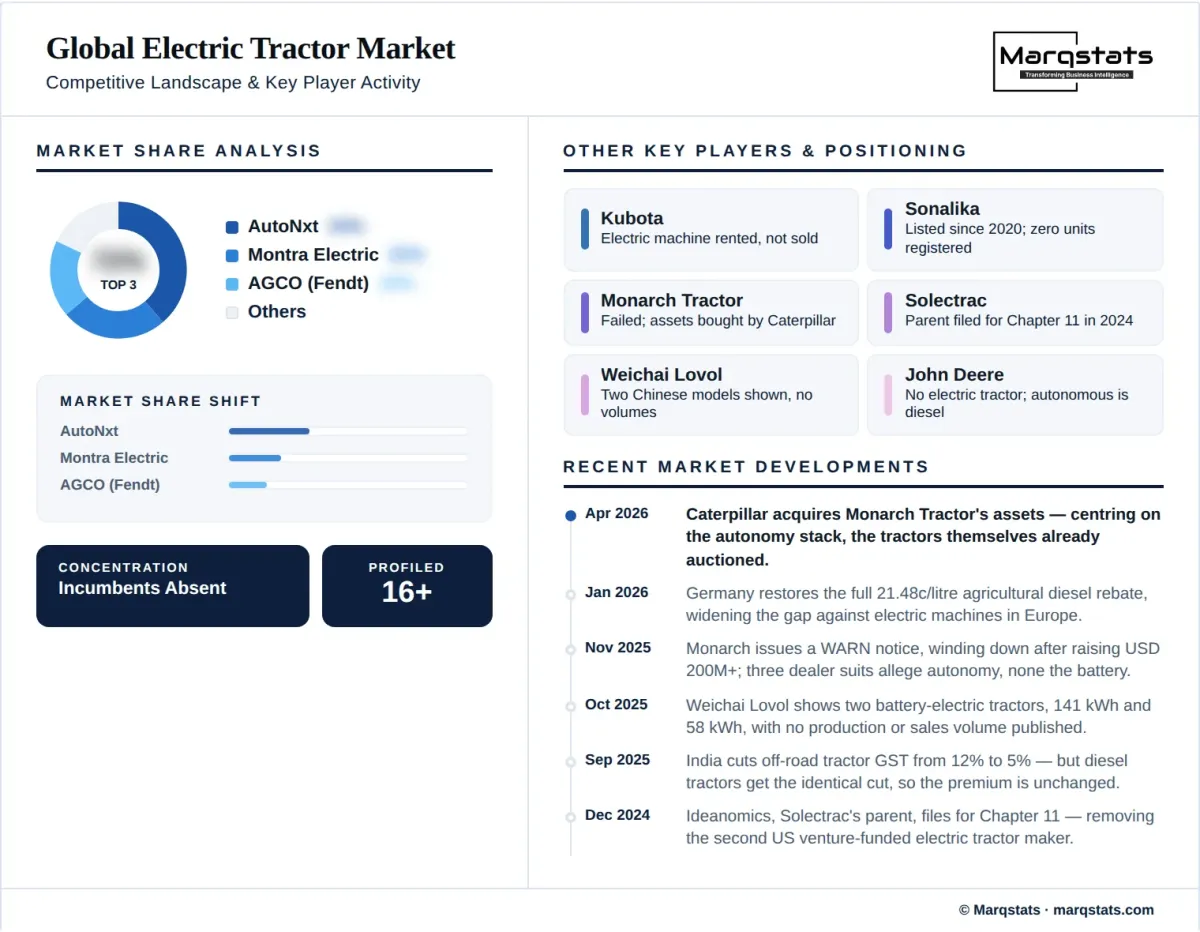
The competitive structure of this market is best described by who is absent from it. In India, two venture-backed startups account for 202 of 208 registered units — 97.1% — and not one established manufacturer appears in the register. The largest tractor maker on earth, with 505,930 domestic sales and 43.6% share, has no electric tractor; its lightweight range is frequently miscited as electric and is diesel. A second incumbent has listed an electric model since 2020 and registered zero units against it. Only three manufacturers hold the Indian certification required to sell one. Any analysis that names the Indian incumbents as electric tractor players is describing exhibits rather than products.
Among Western manufacturers the pattern is engagement without commitment. One European group has a genuine series product in two formats and is the most credible Western position in the market. Another offers a limited and ambiguously available machine. The largest American manufacturer has a 130-horsepower prototype targeted at limited launch in 2027. The world's largest compact tractor manufacturer will only rent its electric machine, on two-to-five-year contracts, and aims it at municipalities — a considered decision about residual-value risk and about who the customer really is. One major European manufacturer has publicly declined to build one at all, and another has nothing to report, which is itself the finding.
The venture layer has been through a full cycle and come out the other side. More than USD 250 million of venture capital entered the American segment; both funded manufacturers are gone, one liquidated at auction with more than 110 unsold new machines and one through its parent's Chapter 11. The acquirer of the flagship's assets was a construction equipment manufacturer, and what it bought was the autonomy stack rather than the tractors, which had already been sold. The remaining independents are small, artisanal or at pre-order, including a German builder whose 200 kilowatt-hour swappable machine is the most expensive electric tractor located anywhere and an American maker whose sub-10 kilowatt-hour machine is the cheapest. The distance between those two products is the market's whole unresolved question about what an electric tractor is for.
Companies Covered
The report profiles 16+ companies with full strategy and financials analysis, including:
Recent Market Activity
Table of Contents
Coverage & Segmentation
This study covers battery-electric agricultural tractors worldwide across 2021 to 2030, sold or registered as complete machines, in all power classes. Hybrid and diesel-electric drivetrains are excluded because they consume diesel — one Indian range marketed as electric is described by its maker as hybrid and is not counted here. Methane, hydrogen and autonomous diesel tractors are excluded from market value but covered in the analysis, because they compete for the same buyer and the same capital. On-farm charging equipment is excluded: farm charging is overwhelmingly existing single- or three-phase supply and no published installation series exists. Readers should note the overlap with the Marqstats Off-Highway Electric Vehicle report, which names tractors among its segments.
Market value is measured at machine supply price in United States dollars, with regional average selling prices anchored on published list prices and converted at prevailing rates. The base year is 2025, the historical period 2021 to 2025 and the forecast period 2026 to 2030. Readers should treat the global totals as constructed rather than measured. India is the only country with a citable electric tractor unit series; the United States has none in any year, China is a data void on volumes, and Europe has named machines and production statuses but no registration series. Each regional line states its basis, and the market's central uncertainty is not the forecast rate but the size of the base it starts from.