Market Snapshot
Middle bar: base-year value × (1 + CAGR), rounded to two decimals. This is a calculated illustration, not a separately researched annual estimate.
The Croatia used car market size is estimated at USD 4,339.24 million in 2025 and is projected to reach USD 5,089.47 million by 2030, growing at a CAGR of 3.24% over 2026 – 2030. Used passenger car transactions rise from 270,698 to 281,850, with domestic ownership transfers leading at 65.52% of 2025 value.
Croatia runs one of the oldest car fleets in the European Union, and used cars are its main source of renewal. In 2025 the market recorded 270,698 used passenger car transactions: 85,698 first registrations of used cars imported from other EU countries and an estimated 185,000 domestic ownership transfers. Imports average EUR 15,450 and domestic transfers EUR 13,600, so the market was worth EUR 3,840.03 million, converted at the 2025 European Central Bank average of USD 1.13 per euro.
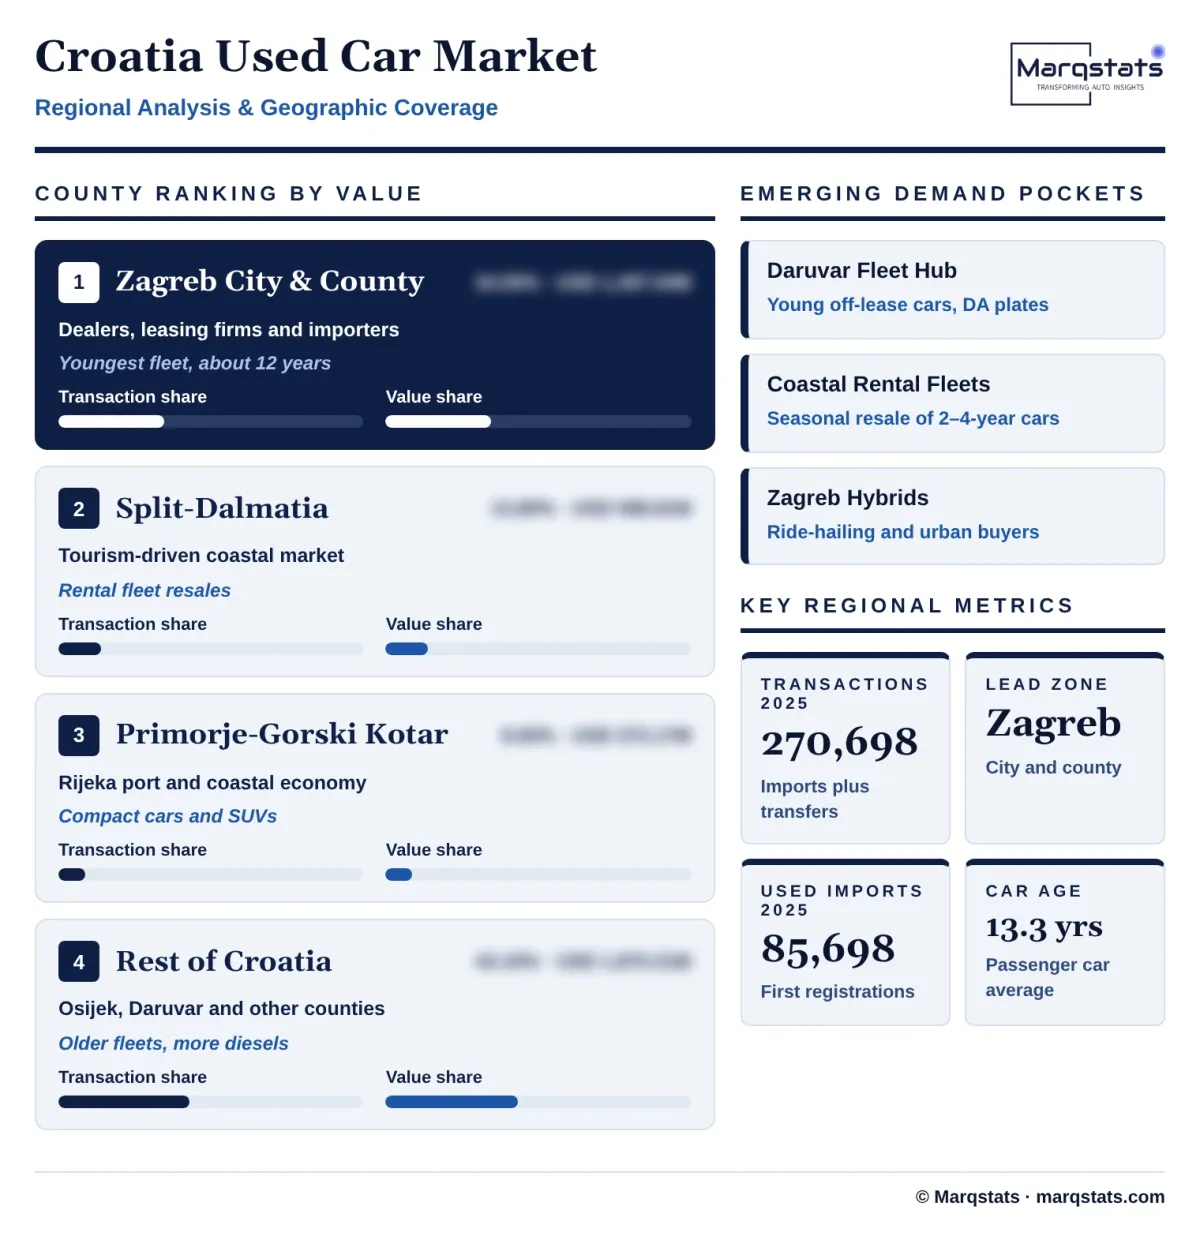
Demand is concentrated in the capital region. The City of Zagreb and Zagreb County account for an estimated 34.50% of transactions, Split-Dalmatia County for 13.80% and Primorje-Gorski Kotar County for 8.60%. The study segments the market by transaction type (domestic transfers and imported used cars), sales channel and powertrain (diesel, petrol, hybrid, plug-in hybrid and battery electric, and LPG), and covers M1 passenger cars only.
Key Takeaways
Market Overview & Analysis
Report Summary
Marqstats sizes the Croatia used car market as the value of all used passenger car transactions in a year: first registrations of used cars imported from other EU countries and domestic changes of ownership. In 2025 these totalled 270,698 transactions, 85,698 imports and an estimated 185,000 domestic transfers. Imports are valued at an average of EUR 15,450, based on Customs Directorate declared values, and domestic transfers at EUR 13,600, and values are converted at USD 1.13 per euro.
Buying a used car in Croatia is simple but taxed. Domestic transfers pay an administrative fee based on engine power and age, collected at the technical inspection station when the title changes; cars bought from VAT-registered dealers and battery electric cars are exempt. Imported cars must pass individual approval at a CVH station and pay the PPMV, which combines a value element and a CO2 element and is higher for diesels than for petrol cars with the same emissions.
Supply depends on Western Europe. Independent importers buy four- to nine-year-old cars at German, Belgian and French auctions and dealers, while franchise dealers and leasing companies supply younger cars from trade-ins and lease returns. Tourist rental fleets on the coast add a further seasonal supply of two- to four-year-old cars each autumn, and public-sector fleets such as HEP sell vehicles through public bidding. Online platforms, led by Njuškalo, carry most private and dealer listings.
Residual values differ sharply by powertrain. European benchmarks show hybrids retaining about 68% of their original price, petrol cars about 60%, plug-in hybrids about 59% and diesels about 58%, while battery electric cars retain only about 48% because of concerns about battery health and falling new-car prices. These differences shape import decisions: importers favour hybrids and petrol cars that sell quickly at stable prices, while used electric cars remain a niche bought mainly by price-sensitive early adopters.
The forecast rests on three conditions. Household incomes keep rising, new-car supply stays normal, and the PPMV structure remains broadly unchanged. Under these conditions imports stabilise at about 88,500 a year, domestic transfers reach about 193,350, and market value reaches USD 5,089.47 million by 2030.
Croatia Used Car Market Size and Forecast
The Croatia used car market grows from USD 4,339.24 million in 2025 to USD 5,089.47 million in 2030, a CAGR of 3.24%. In euro terms the market grows from EUR 3,840.03 million to EUR 4,503.96 million. Transactions grow from 270,698 to 281,850, a 0.81% annual rate, with imports dipping to about 81,500 in 2026 before recovering to 88,500 by 2030, and domestic transfers rising from 185,000 to about 193,350.
The average transaction rises from EUR 14,186 to EUR 15,980, a 2.39% annual increase. Growth comes from mix more than from price: hybrids, plug-in hybrids and younger Euro 6 cars replace older diesels, and franchise dealers sell a larger share of late-model stock. Domestic transfers grow at 3.33% a year in value and imports at 3.07%.
Market Dynamics
Key Drivers
Five conditions keep used cars at the centre of Croatian car buying.
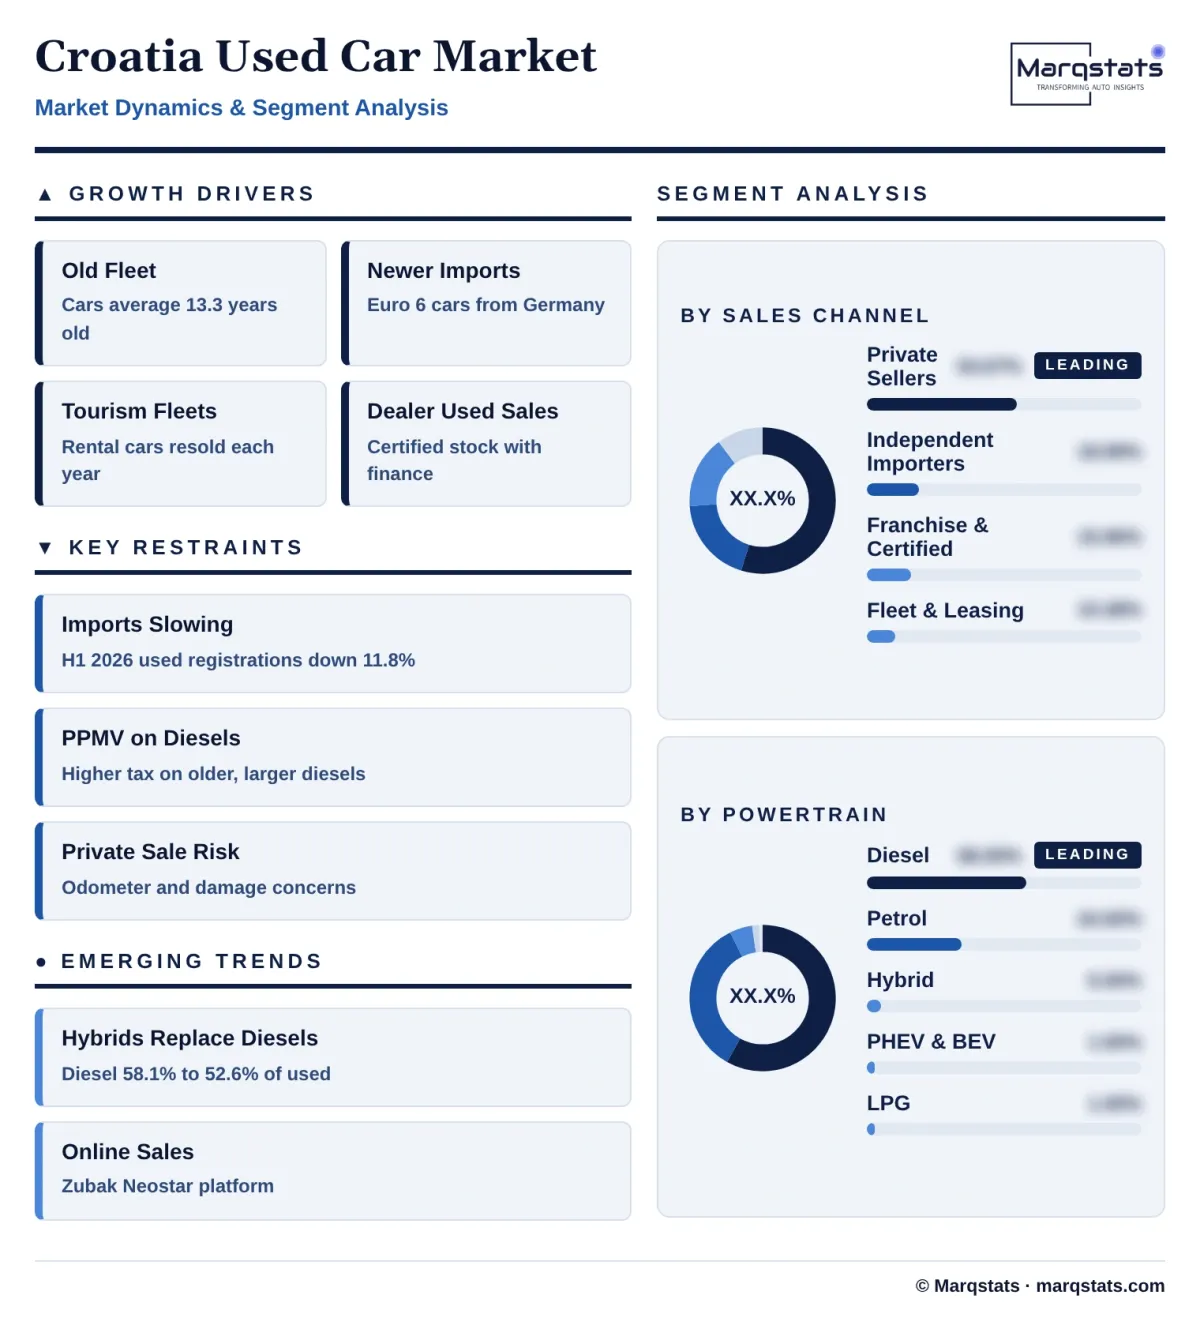
- Cars are old and need replacing. With the average passenger car about 13 years old and about two thirds of the fleet over ten years old, many households need to replace their cars regularly, and most do so with a used car.
- Used imports bring in newer Euro 6 cars. Imports of four- to nine-year-old cars from Germany and other EU countries are the main way Croatia adds modern, cleaner cars to its fleet, and imported cars are worth more on average than those traded domestically.
- Incomes and tourism support demand. Rising wages and a strong tourism economy support car ownership, particularly on the coast, where rental fleets are renewed every few years and their cars are resold into the used market. Rental companies typically keep cars for two to four seasons, so each year's tourist boom becomes the next years' supply of young, well-documented used cars.
- Dealers are professionalising used car sales. Zubak Grupa, Auto Hrvatska, Emil Frey, Porsche Inter Auto and Grand Auto offer certified used cars with inspections, warranties and financing. Dealer-arranged finance reaches 40% to 55% of dealer sales, which helps buyers move to newer cars.
- Hybrids are rising quickly. Hybrids were the most registered new-car powertrain in the first half of 2026, and they retain their value better than other powertrains. As these cars age, they will feed a fast-growing used hybrid segment.
Key Restraints
Four constraints slow growth in volume and squeeze dealer margins.
- Used imports are slowing. Used car registrations fell 11.8% in the first half of 2026 as new-car supply improved and German used car prices stayed high. Imports are expected to stay below their 2025 level in 2026.
- Import taxes weigh on older diesels. The PPMV is higher for diesels and for higher CO2 emissions, raising the cost of importing older, larger diesel cars that many buyers still prefer.
- Private sales lack transparency. More than half of transactions are private sales of older cars, often without verified service records. Odometer fraud and hidden damage remain concerns, which slow private sales and favour dealers. Imported cars in particular may arrive with incomplete histories, and buyers increasingly pay for independent checks before they commit.
- Used electric cars are slow to catch on. Battery electric cars lose value faster than other powertrains, and state grants from the Environmental Protection and Energy Efficiency Fund apply only to new electric cars, so electric cars remain a very small part of the used market. Limited charging outside the main cities adds to buyer caution.
Key Trends
Four shifts are changing what is imported, who sells it and how.
- Hybrids are replacing diesels in imports. Diesel fell from 58.1% to 52.6% of used car registrations between the first halves of 2025 and 2026, while hybrids gained. Hybrids retain about 68% of their value, the highest of any powertrain in European benchmarks.
- Online sales platforms are emerging. Zubak Grupa merged its digital platform Neostar into the group in 2025, combining online listings, inspection, warranty and finance with its showrooms. Njuškalo and Index Oglasi remain the main listing sites.
- Vehicle history checks are becoming routine. Buyers increasingly use carVertical and other history services to check imported cars for odometer fraud and accident damage before buying.
- Taxi rules are freeing up older cars. Rules requiring taxis to meet Euro 6 standards and a minimum length have pushed operators to replace older Euro 5 cars, which are being sold into the private used market. Ride-hailing drivers in Zagreb and on the coast are now among the main buyers of younger used hybrids.
Strategic Implications
- For dealers, certified used cars are the growth area. With volume flat, dealers that secure younger stock through trade-ins, rental fleet returns and lease returns and sell it with warranties and finance will grow faster than the market. Franchise dealers and certified programmes grow at 9.07% a year in value.
- For importers, sourcing must shift away from older diesels. Higher PPMV on diesels and falling diesel demand mean importers should focus on Euro 6 petrol cars and hybrids from Germany and other EU markets.
- For lenders, used car finance has room to grow. Private sales are mostly paid in cash or with personal loans, while dealer sales are financed in 40% to 55% of cases. Lenders that partner with dealers and platforms to finance verified used cars, particularly younger hybrids, can grow their portfolios with manageable risk.
- For platforms and data providers, trust is the product. Verified histories, inspection reports and online purchase with delivery give platforms a way to win share from private sales, which still account for more than half of transactions.
- The main uncertainty is the balance between new and used cars. If new-car supply and prices stay favourable, more buyers will choose new cars over imports. The base case assumes imports recover modestly after 2026 while domestic transfers keep growing.
Market Segmentation
Domestic ownership transfers account for an estimated 185,000 transactions in 2025, 65.52% of market value and USD 2,843.08 million. They rise to about 193,350 by 2030, with value growing at 3.33% a year to USD 3,349.38 million. Most involve older cars sold privately, and transfers are processed at technical inspection stations. Transfers between close family members are exempt from the transfer fee, and cars bought from VAT-registered dealers pay no fee, which encourages buyers of younger cars to buy from dealers.
First registrations of imported used cars total 85,698 in 2025, 34.48% of market value and USD 1,496.16 million. They dip in 2026 and recover to about 88,500 by 2030, with value growing at 3.07% a year to USD 1,740.09 million. Germany supplies more than half, and most imports are four to nine years old.
Private sales between individuals account for an estimated 54.67% of 2025 transactions, about 147,991 cars worth USD 2,372.26 million. They are the largest channel but their share falls to 48.50% by 2030, with value growing at only 0.80% a year to USD 2,468.39 million. Most involve cars 10 to 18 years old.
Independent importers and dealers account for an estimated 18.99% of 2025 transactions, about 51,406 cars worth USD 824.02 million, rising to 19.50% and USD 992.45 million by 2030, a 3.79% value CAGR. They source four- to nine-year-old cars from German and Belgian auctions.
Franchise dealers and certified programmes account for an estimated 15.96% of 2025 transactions, about 43,203 cars worth USD 692.54 million. They are the fastest-growing channel, rising to 21.00% and USD 1,068.79 million by 2030, a 9.07% value CAGR, led by Das WeltAuto, Audi Approved :plus and Emil Frey Select.
Fleet and leasing companies account for an estimated 10.38% of 2025 transactions, about 28,098 cars worth USD 450.41 million, rising to 11.00% and USD 559.84 million by 2030, a 4.45% value CAGR. Rental, leasing and public-sector fleets sell two- to five-year-old cars through dealers and auctions. These cars usually come with full service histories, which makes them attractive to dealers building certified stock.
Diesel cars account for an estimated 58.00% of 2025 transactions, about 157,005 cars worth USD 2,516.76 million. They remain the largest group but their share falls to 47.00% by 2030, and value declines 1.01% a year to USD 2,392.05 million as higher import taxes and changing preferences reduce demand.
Petrol cars account for an estimated 34.50% of 2025 transactions, about 93,391 cars worth USD 1,497.04 million, rising to 35.00% and USD 1,781.31 million by 2030, a 3.54% value CAGR. Small petrol cars dominate urban demand.
Hybrids account for an estimated 5.00% of 2025 transactions, about 13,535 cars worth USD 216.96 million. They rise to 12.00% and USD 610.74 million by 2030, a 23.00% value CAGR, as hybrids become the most registered new-car powertrain and reach the used market.
Plug-in hybrids and battery electric cars account for an estimated 1.50% of 2025 transactions, about 4,060 cars worth USD 65.09 million, and are the fastest-growing group. They rise to 5.00% and USD 254.47 million by 2030, a 31.35% value CAGR, as subsidised new electric cars reach their second owners.
LPG cars account for an estimated 1.00% of transactions, about 2,707 cars worth USD 43.39 million in 2025, rising to USD 50.89 million by 2030. LPG conversions are declining, and demand is concentrated among high-mileage drivers.
By Geography
City of Zagreb and Zagreb County
The City of Zagreb and Zagreb County, registered under ZG plates, account for an estimated 34.50% of 2025 transactions, about 93,391 cars worth USD 1,497.04 million. Higher incomes, a younger fleet averaging about 12 years, and most franchise dealers, leasing companies and importers are concentrated here. Zagreb is also the main market for hybrids and plug-in hybrids, and the main destination for cars imported from Germany and Austria.
Split-Dalmatia County
Split-Dalmatia County accounts for an estimated 13.80% of transactions, about 37,356 cars worth USD 598.81 million. Tourism supports incomes and rental fleets, and Split is the main dealer hub for Dalmatia. Demand peaks before the summer season, when rental companies and tourism businesses buy and sell vehicles, and prices for compact cars and SUVs rise accordingly.
Primorje-Gorski Kotar County
Primorje-Gorski Kotar County, centred on Rijeka, accounts for an estimated 8.60% of transactions, about 23,280 cars worth USD 373.17 million. Coastal tourism and port activity support steady demand for compact cars and SUVs. The county's proximity to Slovenia and Italy gives importers short supply routes for younger cars.
Osijek-Baranja County
Osijek-Baranja County accounts for an estimated 6.90% of transactions, about 18,678 cars worth USD 299.41 million. Eastern Slavonia has older cars and lower prices, and Auto Hrvatska has expanded its dealer presence in Osijek. Farming and cross-border trade support demand for diesel estates and light commercial vehicles, and many buyers import cars directly from Germany through family and work connections.
Bjelovar-Bilogora County
Bjelovar-Bilogora County accounts for an estimated 6.10% of transactions, about 16,513 cars worth USD 264.69 million, far above its population share. Leasing and rental companies register fleets in Daruvar because of lower insurance premiums, so many young off-lease cars enter the used market with DA plates.
Rest of Croatia
The remaining counties, including Zadar, Varaždin, Istria and Brod-Posavina, account for an estimated 30.10% of transactions, about 81,480 cars worth USD 1,306.11 million. Fleets are older, diesels more common and private sales dominate. Varaždin and Istria have higher incomes than the other counties in this group and stronger demand for younger imported cars. County shares are a Marqstats allocation based on registration and inspection data.
How Competition Is Evolving
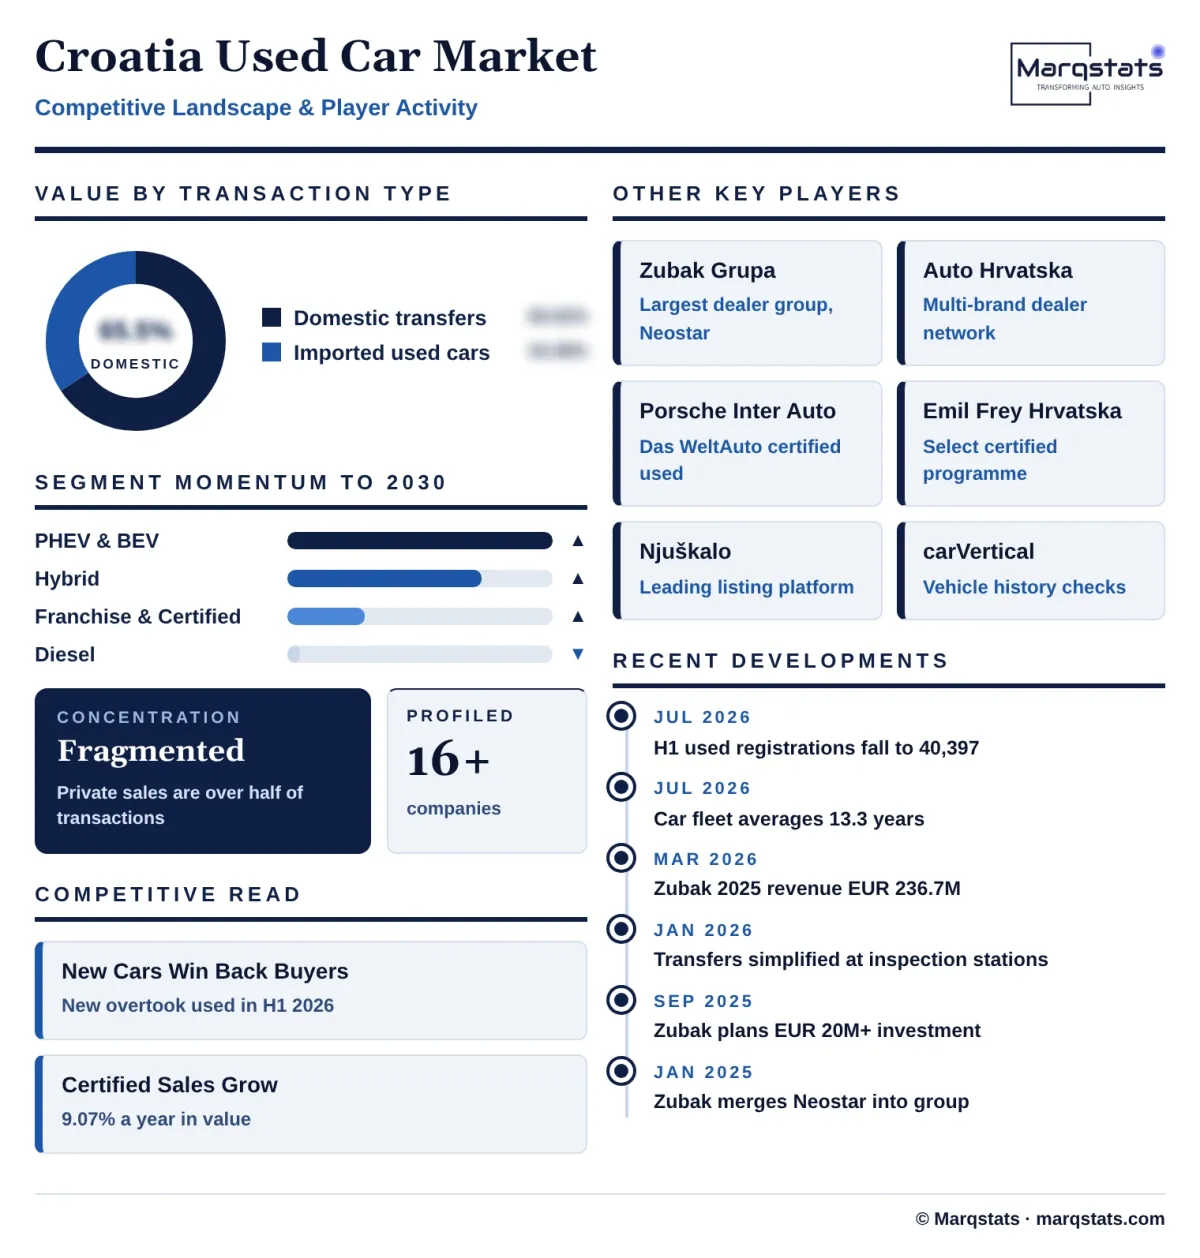
The Croatia used car market is fragmented. Private sales between individuals account for an estimated 54.67% of transactions, and hundreds of independent importers and dealers compete with franchise groups and leasing companies for the rest. No single seller holds a large share of transactions.
Large dealer groups lead the organised market. Zubak Grupa reported 2025 revenue of EUR 236.70 million and sells about 9,500 vehicles a year, split roughly evenly between new and used, and runs the Neostar online sales platform. Auto Hrvatska Automobili reported revenue of EUR 137.77 million. Porsche Inter Auto Hrvatska runs Das WeltAuto and Audi Approved :plus, Emil Frey Hrvatska runs Select for Mercedes-Benz and Stellantis brands, and Grand Auto sells used Ford, Hyundai and MG cars.
Platforms and lenders shape the market. Njuškalo, owned by Styria Media Group, carries most online used car listings and sets the price reference, with Index Oglasi as an alternative. Leasing companies and banks such as UniCredit Leasing and OTP Leasing finance dealer sales, while carVertical and the Hrvatski autoklub (HAK) provide history checks and pre-purchase inspections.
Competition is shifting toward certified, financed sales. As new cars regain share and imports slow, dealers that combine verified younger stock, warranties, finance and online sales will take share from private sellers and small importers.
Companies Covered
Companies covered in the report include:
Recent Market Activity
Table of Contents
Coverage & Segmentation
The study covers the Croatia used car market nationally, with 2025 as the base year, 2021 – 2025 as the historical period and 2026 – 2030 as the forecast period. Values are in US dollars, converted from euros at the 2025 European Central Bank average of USD 1.13 per euro. The market is defined as the value of used passenger car (M1) transactions: first registrations of used cars imported from abroad and domestic changes of ownership. It is segmented by transaction type, sales channel and powertrain.
Light commercial vehicles, motorcycles, buses, trucks and tractors are excluded, as are new-car sales and finance, insurance and aftersales revenue. The domestic transfer count, the average transaction values and the channel, powertrain and county splits are Marqstats estimates built on CVH registration data, Customs Directorate declared values and dealer and listing prices.