Market Snapshot
Middle bar: base-year value × (1 + CAGR), rounded to two decimals. This is a calculated illustration, not a separately researched annual estimate.
The Jordan used car market size is estimated at USD 3,059.22 million in 2025 and is projected to reach USD 3,907.55 million by 2030, growing at a CAGR of 5.02% over 2026 – 2030. Used vehicle transactions rise from 249,740 to 288,100, with domestic ownership transfers leading at 59.71% of 2025 value.
Jordan has no car assembly plants, so every vehicle in its fleet of about 2 million was imported. Used cars account for more than 80% of vehicle transactions, and the market runs on two flows. Imported used cars are cleared from the Zarqa Free Zone into the local market, an estimated 64,740 vehicles in 2025, and existing vehicles change hands through the Drivers and Vehicles Licensing Department (DVLD), an estimated 185,000 transfers. Marqstats values imports at an average of JOD 13,500 and domestic transfers at JOD 7,000, converted at the pegged rate of JOD 0.709 per US dollar.
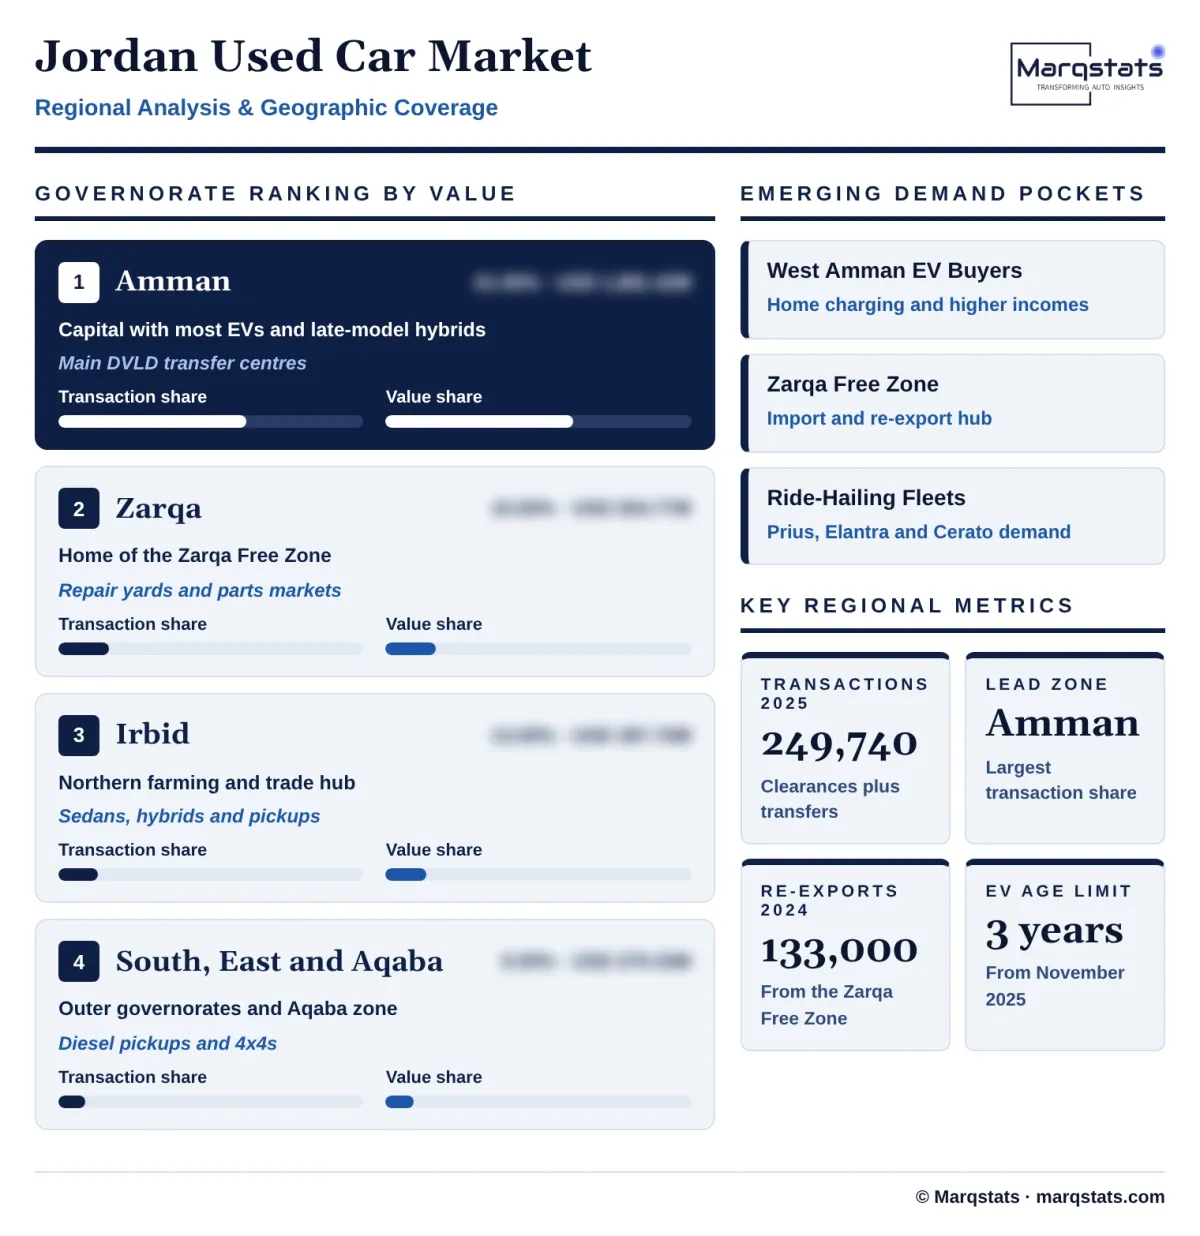
Demand is concentrated in the capital. Amman Governorate accounts for an estimated 61.50% of transactions, followed by Zarqa at 16.50% and Irbid at 13.00%. The study segments the market by transaction type (imported clearances and domestic transfers), powertrain (gasoline, hybrid, battery electric and diesel) and body type (sedans, SUVs and crossovers, and light commercial vehicles).
Key Takeaways
Market Overview & Analysis
Report Summary
Marqstats sizes the Jordan used car market as the value of all used vehicle transactions in the domestic market in a year: imported used vehicles cleared from the Zarqa Free Zone for first registration in Jordan, and ownership transfers of vehicles already registered with the DVLD. In 2025 these totalled an estimated 249,740 transactions, 64,740 clearances and 185,000 transfers. Clearances are valued at an average of JOD 13,500 and transfers at JOD 7,000, based on retail listing prices and dealer pricing, and converted at the pegged rate of JOD 0.709 per US dollar.
The market depends on a single import gateway. The Zarqa Free Zone, overseen by the Jordan Free Zones Investors Commission (JFZIC), hosts hundreds of showrooms and clearance agents that import cars from China, South Korea, the United States and Europe. Cars cleared into Jordan pay customs duty and special tax; cars re-exported to Iraq, Syria and Saudi Arabia do not. This makes the zone a regional trading hub as much as a domestic supply point.
Imports must meet strict age and quality rules. Petrol and hybrid cars can be imported up to five years old, and since November 2025 electric cars only up to three years old, including the year of clearance. Imported cars sold by non-agency dealers must carry a mandatory warranty, two years or 40,000 kilometres for petrol, diesel and hybrid cars and three years or 50,000 kilometres for electric cars, which adds 3% to 7% of the vehicle value to the price.
The forecast rests on three conditions. The November 2025 tax cuts stay in place and lift imported clearances back toward 78,100 by 2030. Hybrids continue to gain share among middle-income buyers. And regional re-export demand remains strong enough to keep Zarqa traders well stocked. Under these conditions transactions reach 288,100 in 2030 and market value USD 3,907.55 million.
Jordan Used Car Market Size and Forecast
The Jordan used car market grows from USD 3,059.22 million in 2025 to USD 3,907.55 million in 2030, a CAGR of 5.02%. In local currency the market grows from JOD 2,168.99 million to JOD 2,770.45 million; because the dinar is pegged to the dollar, growth rates are the same in both currencies. Transactions grow from 249,740 to 288,100, a 2.90% annual rate, with imported clearances rising from 64,740 to 78,100 and domestic transfers from 185,000 to 210,000.
2025 was a reset year. Imported clearances fell from about 78,000 in 2024 as buyers waited for the tax changes announced in June 2025 to take effect in November. Marqstats expects clearances to recover from 2026 as lower taxes on petrol cars and hybrids take hold, while the salvage ban and the three-year limit on electric imports raise the average value of each imported car.
The powertrain mix shifts steadily. Gasoline falls from 40.85% of transactions in 2025 to 34.24% by 2030 as older petrol cars leave the fleet, while hybrids rise from 29.44% to 33.64% and battery electric cars from 22.92% to 25.76%. Because electrified cars carry higher prices than the petrol cars they replace, the average transaction value rises faster than inflation. SUVs and crossovers also gain share, rising from 38.00% to 42.50% of transactions, which adds further to the average value.
Market Dynamics
Key Drivers
Five conditions support recovery after the 2025 slowdown in imports.
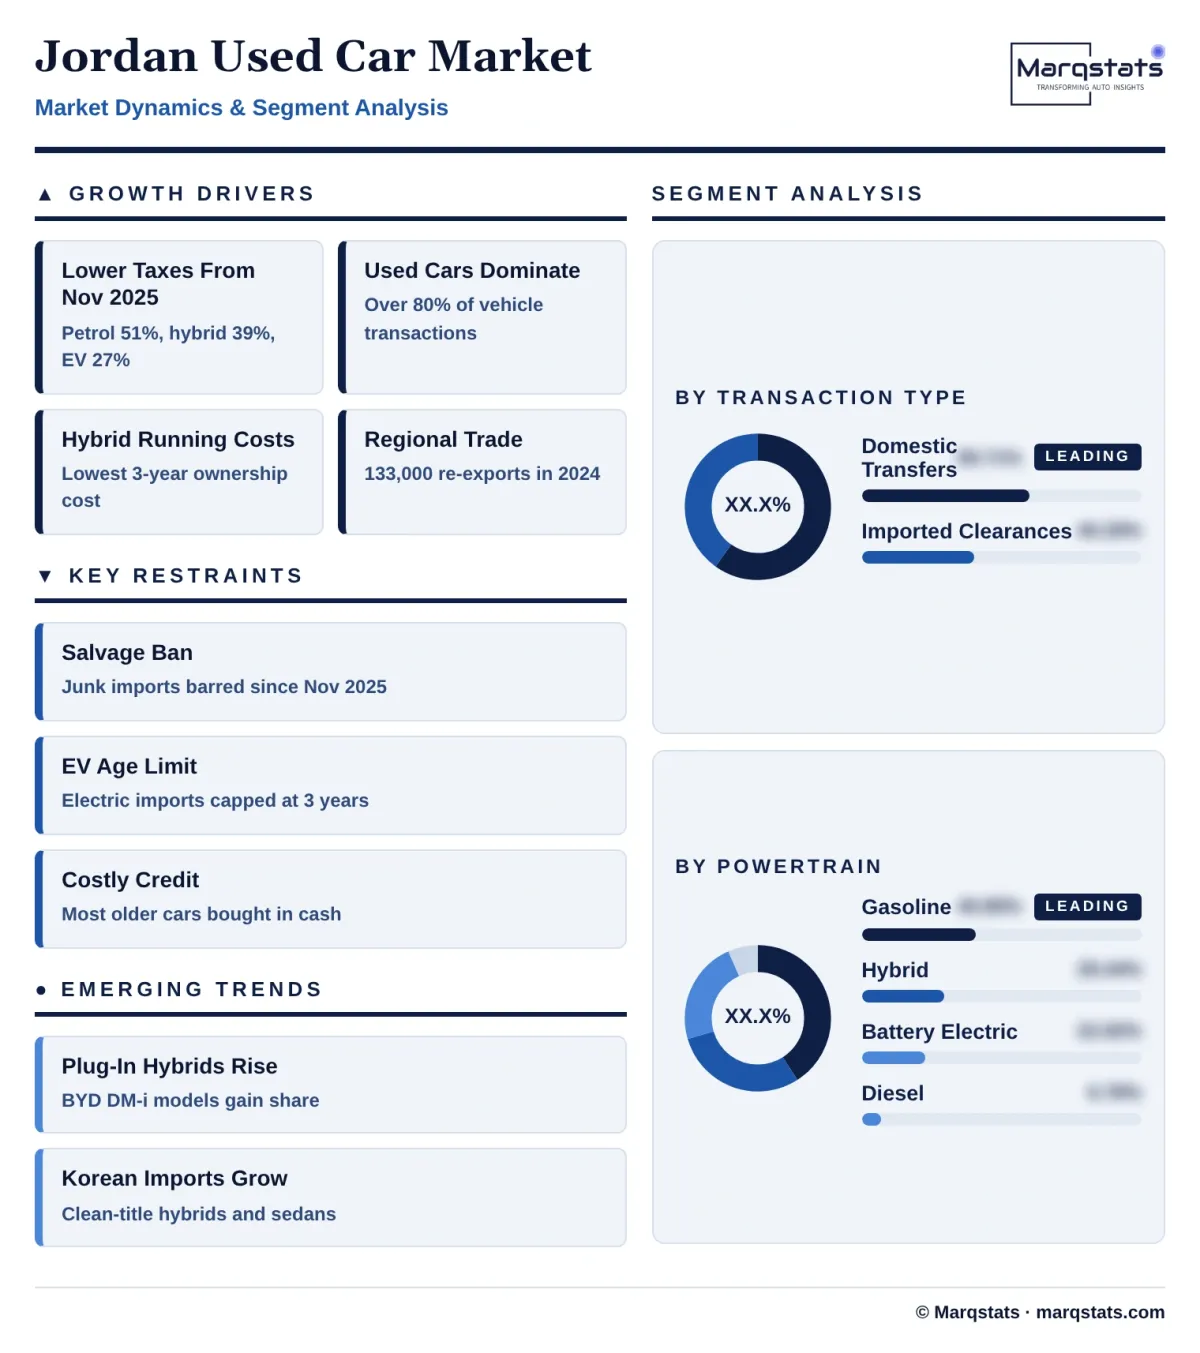
- Lower taxes from November 2025 make imported cars cheaper. Special tax on petrol cars fell from 71% to 51% and on hybrids from 60% to 39%, and a single 27% rate replaced the planned rise in electric car taxes of up to 55%. Lower landed costs bring buyers back to the Zarqa Free Zone after the 2025 slowdown.
- Used cars are the affordable choice. Used cars account for more than 80% of vehicle transactions in Jordan, because high taxes on new cars and high lending rates put new vehicles out of reach for most households. More than 90% of privately owned cars are valued below JOD 25,000, and about 30% below JOD 10,000.
- Hybrids offer the best running costs. High fuel prices make hybrids such as the Toyota Prius, Hyundai Ioniq and Kia Niro the most economical choice for many buyers. Hybrid clearances rose 31% in the first half of 2025, and hybrids hold their value better than petrol or electric cars.
- Ride-hailing creates steady demand for efficient sedans. Drivers working for Uber, Careem and Jeeny buy fuel-efficient used sedans and hybrids, keeping demand strong for the Toyota Prius, Hyundai Elantra and Kia Cerato in Amman and Zarqa.
- Regional trade keeps the import pipeline full. Re-exports from the Zarqa Free Zone to Iraq, Syria and Saudi Arabia reached about 133,000 vehicles in 2024 and rose 67% in the first half of 2025. This regional demand lets traders hold larger, more varied stock than the domestic market alone would support.
Key Restraints
Four constraints hold back how fast the market rebuilds.
- The salvage ban and age limits narrow supply. Since November 2025, salvage and junk vehicles cannot be cleared and electric cars must be no more than three years old. These rules remove the cheapest imported stock and raise the average import price.
- Financing is expensive. High interest rates and strict lending criteria limit bank finance to newer, higher-value cars. Most older cars are bought with cash, which caps how much buyers can spend. Banks typically require large deposits and comprehensive insurance, and few lend on cars more than eight to ten years old, which leaves a large share of the domestic transfer market without access to formal credit.
- Used electric cars lose value quickly. Concerns about battery wear in Jordan's summer heat and the cost of replacement batteries make buyers cautious about older electric cars. A four-year-old electric SUV loses about 28.5% of its value over three years, against about 17.6% for a hybrid.
- Frequent tax changes create uncertainty. Electric car taxes changed several times between 2024 and 2025, and each change stalled clearances while buyers and traders waited. In January 2025, clearances from the Zarqa Free Zone fell 40% year on year, and in the first quarter by 34%.
Key Trends
Four shifts are reshaping supply, powertrains and how cars are sold.
- Plug-in hybrids are filling the gap left by electric cars. Chinese plug-in hybrids such as the BYD Qin Plus, Song Plus and Sealion DM-i offer electric driving in the city with petrol backup for longer trips, and they are gaining share among buyers wary of pure electric cars.
- South Korean imports are gaining share. Clean-title Korean-market hybrids and petrol sedans such as the Hyundai Elantra, Sonata and Kia K5, and diesel vans, are replacing US auction cars as the main source of mid-priced imports.
- Vehicle history and inspection services are spreading. Carseer provides vehicle history reports drawing on US auction records, European registries and Jordan Customs data, and Autoscore runs pre-purchase inspections in Amman and Zarqa. Buyers increasingly expect a report before they pay. Reports are especially valued for imported cars, where past accident damage and altered odometers were common before the salvage ban.
- Online classifieds dominate the search. OpenSooq and Motory list most used cars for sale, and DVLD services, including ownership transfers, are moving online through the Sanad digital government platform.
Strategic Implications
- For Zarqa traders, clean-title supply is now essential. With salvage imports banned, traders need reliable sources of clean-title cars from South Korea, China, Europe and the Gulf. Traders that secure these channels early will benefit most as lower taxes lift demand.
- For importers of electric cars, the three-year limit changes the model. Only young electric cars can now be cleared, so importers should focus on two- to three-year-old models with documented battery health, which also helps them meet mandatory warranty requirements.
- For lenders, hybrids are the safest collateral. Hybrids hold their value best, while used electric cars depreciate faster. Lenders can widen used car finance by pricing loans to powertrain-specific residual values and by requiring inspection and history reports.
- The main uncertainty is further tax change. Jordan has changed vehicle taxes several times since 2024. The base case assumes the November 2025 schedule stays in place; another change would shift demand between powertrains more than it would change the overall size of the market.
Market Segmentation
Domestic ownership transfers through the DVLD account for an estimated 185,000 transactions in 2025, 59.71% of market value and USD 1,826.52 million. They grow to 210,000 transactions and USD 2,310.30 million by 2030, a 4.81% value CAGR. Older gasoline and hybrid sedans dominate, and transfer fees range from JOD 30 to JOD 200 depending on engine size and age.
Imported used vehicles cleared from the Zarqa Free Zone account for an estimated 64,740 transactions in 2025, 40.29% of market value and USD 1,232.71 million. They are the faster-growing transaction type, rising to 78,100 clearances and USD 1,597.25 million by 2030, a 5.32% value CAGR, as lower taxes from November 2025 bring buyers back.
Gasoline vehicles account for an estimated 102,025 transactions in 2025, 40.85% of volume and USD 1,060.73 million, mostly older cars changing hands domestically. Their share falls to 34.24% of volume by 2030, with value growing at only 1.53% a year to USD 1,144.31 million.
Hybrids account for an estimated 73,535 transactions in 2025, 29.44% of volume and USD 874.40 million. They are the fastest-growing powertrain, rising to 96,930 transactions and 33.64% of volume by 2030, with value growing at 8.05% a year to USD 1,287.78 million. The Toyota Prius, Hyundai Ioniq and Kia Niro lead, joined by Chinese plug-in hybrids.
Battery electric vehicles account for an estimated 57,250 transactions in 2025, 22.92% of volume and USD 903.56 million, and make up 57% of imported clearances. They rise to 74,212 transactions and 25.76% of volume by 2030, with value growing at 5.84% a year to USD 1,200.22 million. The BYD Atto 3, Volkswagen ID.4 and ID.6 are common models.
Diesel vehicles account for an estimated 16,930 transactions in 2025, 6.78% of volume and USD 220.53 million, mostly pickups and vans. They grow to 18,310 transactions and USD 275.24 million by 2030, a 4.53% value CAGR, led by the Toyota Hilux and Isuzu D-Max.
Compact and mid-size sedans account for an estimated 46.50% of 2025 transactions, about 116,129 vehicles and USD 1,422.54 million. Commuters and ride-hailing drivers favour the Toyota Prius, Hyundai Elantra, Kia Cerato and BYD Qin. Share eases to 41.50% by 2030, with value growing at 2.65% a year to USD 1,621.63 million.
SUVs and crossovers account for an estimated 38.00% of 2025 transactions, about 94,901 vehicles and USD 1,162.51 million. They are the fastest-growing body type, rising to 42.50% of transactions and USD 1,660.71 million by 2030, a 7.39% value CAGR, led by the Hyundai Tucson, Kia Sportage, Toyota RAV4 and Volkswagen ID.4.
Pickups and vans account for an estimated 15.50% of 2025 transactions, about 38,710 vehicles and USD 474.18 million, rising to 16.00% and USD 625.21 million by 2030, a 5.69% value CAGR. Logistics, farming and construction drive demand for the Toyota Hilux, Isuzu D-Max and Hyundai Porter.
By Geography
Amman
Amman Governorate is the largest market, with an estimated 61.50% of 2025 transactions, about 153,590 vehicles worth USD 1,881.42 million. Higher incomes, shorter commutes and home charging in west Amman make it the main market for electric cars and late-model hybrids. DVLD centres in Marka and west and north Amman handle the most ownership transfers. Corporate fleets, leasing companies and ride-hailing operators are concentrated in the capital, and certified used programmes run by authorised distributors operate mainly from Amman showrooms.
Zarqa
Zarqa Governorate accounts for an estimated 16.50% of transactions, about 41,207 vehicles worth USD 504.77 million. It hosts the Zarqa Free Zone, the country's import hub, along with repair yards and spare parts markets. Local buyers favour affordable sedans and light vans. Many Zarqa traders sell both to local buyers and to regional re-export customers, so local prices respond quickly to changes in demand from Iraq and Syria.
Irbid
Irbid Governorate accounts for an estimated 13.00% of transactions, about 32,466 vehicles worth USD 397.70 million. Northern farming and trading communities favour fuel-efficient sedans, hybrids and pickups. Licensing centres in west Irbid and Ramtha handle most transfers, and the governorate's position near the Syrian border links local traders to cross-border demand.
Southern and Eastern Governorates
Karak, Ma'an, Tafilah, Mafraq and the other outer governorates account for an estimated 5.50% of transactions, about 13,736 vehicles worth USD 168.26 million. Rough terrain and rural transport drive demand for diesel pickups and four-wheel-drive vehicles. Fleets here are older, prices lower and private cash sales more common than in the main cities.
Aqaba Special Economic Zone
The Aqaba Special Economic Zone accounts for an estimated 3.50% of transactions, about 8,741 vehicles worth USD 107.07 million. The port of Aqaba is also a landing point for vehicles shipped into Jordan. Vehicles registered in Aqaba pay lower duties and carry distinctive plates; moving them to national plates requires paying the duty difference. Regional shares are a Marqstats allocation based on DVLD and fleet distribution.
How Competition Is Evolving
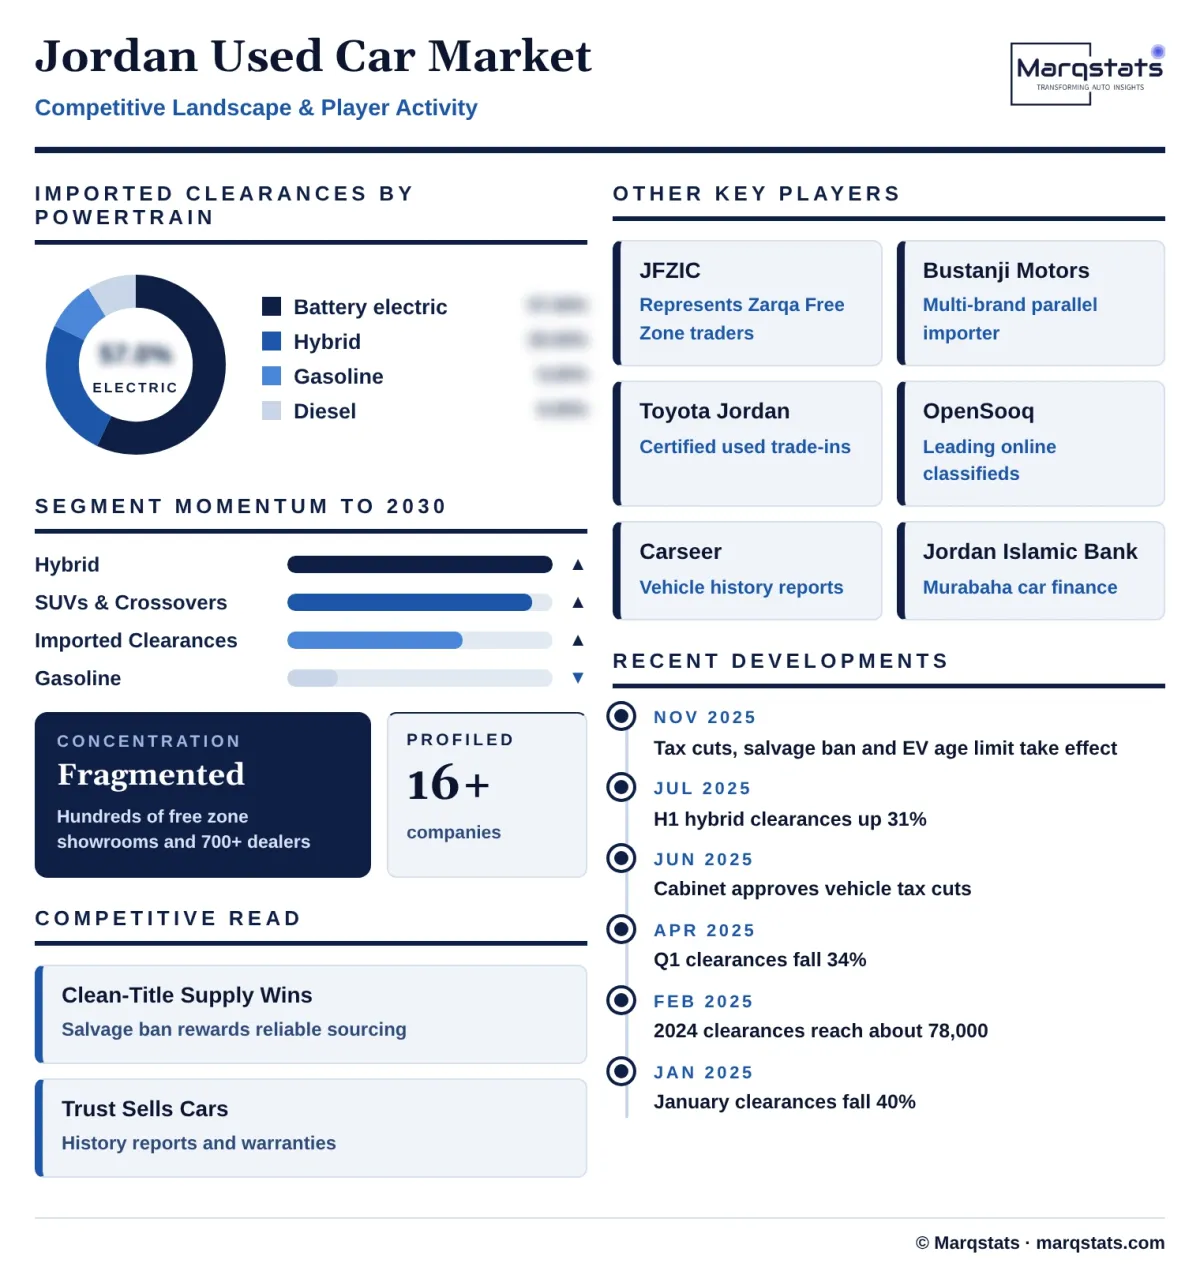
The Jordan used car market is fragmented. Hundreds of showrooms and clearance agents operate in the Zarqa Free Zone, more than 700 non-agency dealers are registered under the mandatory warranty system, and most domestic transfers happen between private individuals. No single dealer or group holds a large share of transactions.
Free zone traders and authorised distributors compete for buyers. Large parallel importers such as Bustanji Motors import multi-brand stock through the Zarqa Free Zone, and the Jordan Free Zones Investors Commission represents the zone's traders. Authorised distributors such as Toyota Jordan run certified used programmes based on trade-ins, offering warranties and finance that free zone traders cannot always match.
Platforms, data providers and lenders shape the market. OpenSooq and Motory carry most online listings, Carseer and Autoscore provide history reports and inspections, and banks such as Capital Bank of Jordan, Bank al Etihad and Jordan Islamic Bank, which offers Sharia-compliant Murabaha finance, provide used car loans. Traders that combine clean-title stock, inspection reports and finance partnerships are best placed to grow.
Regulation is pushing the market toward formal operators. The mandatory warranty system, the salvage ban and stricter technical standards favour traders with reliable supply and after-sales capability. Smaller brokers that relied on cheap auction stock face higher costs and will either consolidate or shift to re-export trade.
Companies Covered
Companies covered in the report include:
Recent Market Activity
Table of Contents
Coverage & Segmentation
The study covers the Jordan used car market nationally, with 2025 as the base year, 2021 – 2025 as the historical period and 2026 – 2030 as the forecast period. Values are in US dollars, converted from Jordanian dinars at the pegged rate of JOD 0.709 per US dollar. The market is defined as the value of used passenger cars and light commercial vehicles cleared from the Zarqa Free Zone for first registration in Jordan and of ownership transfers of registered vehicles through the DVLD. It is segmented by transaction type, powertrain and body type.
Re-exports from the Zarqa Free Zone to other countries, new-vehicle sales by authorised agents, motorcycles, buses and heavy trucks are excluded, as are finance, insurance and aftersales revenue. The transaction counts for 2025, the average transaction values and the powertrain, body type and regional splits are Marqstats estimates built on JFZIC clearance statistics, DVLD data and dealer and listing prices.