Market Snapshot
Middle bar: base-year value × (1 + CAGR), rounded to two decimals. This is a calculated illustration, not a separately researched annual estimate.
The Chile software-defined vehicle market is an estimated USD 312.45 million in 2025 and is projected to reach USD 844.75 million by 2030, a CAGR of 22.01% over 2026 – 2030. Active connected and software-defined vehicle endpoints rise from an estimated 950,000 to 2,150,000, a CAGR of 17.75%. Fleets, transit and mining pay 75.70% of the value; private car buyers pay the rest.
The market sits on an import-only vehicle base. The Asociación Nacional Automotriz de Chile (ANAC) recorded 310,598 new light and medium vehicles in 2025, up 2.7%, plus 14,394 trucks, up 18%, and 4,932 buses, up 139%. Chile assembles no passenger cars, so every operating system, domain controller and driver-assistance stack arrives already integrated by the brand that built the vehicle. Brands of Chinese origin took 32.4% of 2025 light-vehicle sales, Japanese brands 26.3% and Korean brands 14.0%, which means the software architecture of the national fleet is decided in Shenzhen, Toyota City and Seoul rather than in Santiago.
Coverage spans four software stack layers, five vehicle application domains, two delivery architectures and five sub-national regions, measured in value terms in US dollars. The analysis counts embedded software, middleware, telematics and fleet software subscriptions, driver-assistance software, cloud services and over-the-air (OTA) update pipelines. It excludes the vehicle, its battery and its mechanical powertrain, as well as telematics hardware boxes, sensors and generic mobile voice plans.
Key Takeaways
Market Overview & Analysis
Report Summary
Chile's vehicle software market is decided by who operates the vehicle, not by who buys it. The headline figures in circulation about Chilean car sales, electric adoption and 5G coverage describe the host fleet. They do not describe the software layer, and they point the wrong way. Private buyers bought 310,598 new light vehicles in 2025 and remain reluctant to pay recurring subscriptions, while freight operators, transit concessionaires and copper miners pay every month for tracking, dispatch, driver monitoring and autonomy. The thesis of the analysis is simple: the Chile software-defined vehicle market is an enterprise software market that happens to run on vehicles, and it turns into a factory-software market only late in the forecast period.
The measure is net software, middleware, platform licensing and digital service revenue, in US dollars at a constant 2025 exchange rate. Counted: embedded operating systems and middleware, telematics and fleet management software as a service, driver-assistance and safety software, connected apps, cloud services and OTA pipelines. Excluded: vehicle hardware, batteries, chassis, telematics boxes, sensors and wiring, and consumer voice plans. Autonomous haulage trucks inside private mining concessions are included, because their software is the largest single value pool per vehicle in the country, even though the trucks never carry a road registration. A study that drew the boundary at road-registered vehicles only would report a market an estimated 12.5% smaller, and the difference is definitional rather than empirical.
The analysis is built for four buyers with distinct decisions. A telematics platform vendor deciding whether to open a Chilean office needs the split between retrofit and factory channels. An automotive importer such as Inchcape or Astara deciding whether to build an in-house connected-services team needs the passenger-car trajectory. A mining technology supplier sizing its northern Chile service footprint needs the mining haulage line. A transit concessionaire bidding the next Red Movilidad contract needs to know what Ley 21.663 now demands of its fleet software.
Chile Software-Defined Vehicle Market Size and Forecast
Marqstats sizes the Chile software-defined vehicle market at an estimated USD 312.45 million in 2025, rising to USD 844.75 million in 2030. Absolute growth is USD 532.30 million over five years. The value is a Marqstats estimate built bottom-up from vehicle classes rather than read from any single published statistic, because Chilean customs records register whole vehicles under Chapter 87 tariff lines and the software inside them carries no separate value.
The build has three steps. First, the host fleet: ANAC sales of 310,598 light and medium vehicles, 14,394 trucks and 4,932 buses in 2025, the Directorio de Transporte Público Metropolitano (DTPM) electric bus count and company disclosures of autonomous trucks at named mines. Second, the connected share of each class, which converts host vehicles into an estimated 950,000 active software endpoints in 2025. Third, software value per endpoint by class, which ranges from a basic connectivity licence on an imported car to a full autonomy licence on an ultra-class haul truck. The endpoint series is primary for volume; value is derived.
Value grows faster than endpoints, at 22.01% against 17.75%. The mechanism is mix. Factory-integrated platforms, which carry more software per vehicle than an aftermarket tracker, grow from 38.00% to 54.00% of value, and driver-assistance software rises from 18.00% to 22.00%. Average value per endpoint therefore climbs from about USD 329 in 2025 to about USD 393 in 2030. The input the estimate is most sensitive to is software value per autonomous haul truck, because a few hundred trucks carry an estimated USD 39.05 million of value between them.
Fleets, Not Car Buyers, Pay for Software in Chile
Consumer connectivity is the visible part of this market and the smaller part. Consumer passenger cars and light SUVs account for an estimated USD 75.93 million, or 24.30% of 2025 value. Light commercial vans, heavy freight trucks, transit buses and mining haulage account for the other 75.70%, about USD 236.52 million.
The reason is willingness to pay. A freight operator measures a tracking subscription against fuel theft, idling, traffic fines and insurance terms, and renews it every month because the saving is visible. A private owner sees a connected-services trial expire. Chilean regulation has reinforced that pattern rather than broken it: Ley 21.170, the Ley Antiportonazo, made insurers responsible for supplying tracking devices with motor policies, which turned consumer telematics into an insurer cost rather than a consumer purchase.
The consumer share does rise, to 29.00% by 2030, because factory connectivity is spreading through the imported fleet. Brands of Chinese origin, now 32.4% of light-vehicle sales, increasingly ship models with embedded modems and app ecosystems fitted as standard. The software arrives whether the buyer asks for it or not. Who earns the recurring revenue from it is the open question for every importer.
The Retrofit Market Becomes a Factory Market in 2029
Chile's software layer is built today by aftermarket platforms bolted onto vehicles that left the factory without them. Enterprise fleet retrofit platforms hold an estimated USD 193.72 million, 62.00% of 2025 value. Factory-integrated platforms hold USD 118.73 million, or 38.00%.
The paths cross. Factory-integrated software grows at an estimated 30.89% a year to USD 456.17 million in 2030, while retrofit platforms grow at 14.94% to USD 388.58 million. On those paths factory value passes retrofit value during 2029. This is a Marqstats estimate, and its timing depends on how fast Chinese-origin and Korean-origin brands activate the connectivity they already fit.
Three forces drive the crossover. Imported models now arrive with modems, cameras and driver-assistance software fitted. The Red Movilidad electric bus fleet, 4,088 units in February 2026, reports every vehicle to a central fleet management platform. And the SERNAC conciliation of 5 May 2025, in which HDI Seguros and Seguros Generales Suramericana agreed to pay about CLP 1,300 million to nearly 400,000 policyholders over undelivered or late GPS devices, showed insurers the cost of relying on aftermarket installer networks. Retrofit platforms do not disappear. Their growth shifts from installing boxes to integrating factory data feeds, which is a different business.
SUBTEL's M2M Count Is Not a Connected-Vehicle Count
The most cited national statistic for connected machines points the wrong way. SUBTEL counted 505,191 machine-to-machine accesses in December 2025, 24.5% fewer than a year earlier. Over the same period ANAC recorded more trucks, more buses and more electrified light vehicles than in 2024, and 5G connections rose 58.8% to 9,698,786.
The two series measure different things. The M2M category tracks lines registered as machine-to-machine plans; vehicle connectivity increasingly runs on standard data plans, embedded manufacturer SIMs managed abroad and private networks at mine sites. A model that scales Chile's connected vehicle base from the SUBTEL M2M series would shrink the market in a year when it grew. Marqstats sizes endpoints from vehicle classes instead, and treats the M2M line count as a floor for the dedicated-line segment only.
Cybersecurity Law Turns Fleet Telematics into Regulated Infrastructure
Vehicle software in Chile is no longer only a product decision. Ley 21.663, the Ley Marco de Ciberseguridad, made the reporting of cyber incidents mandatory from 1 March 2025: an early alert within three hours of detection, a second report within 72 hours and a final report within 15 calendar days, sent to the national CSIRT. ANCI Resolución Exenta 187, dated 24 July 2026, then fixed the second-stage list of Operadores de Importancia Vital at 239 institutions across sectors that include land, rail, maritime and air transport.
For a transit concessionaire or a logistics operator on that list, the telematics platform is now part of the regulated perimeter. A dispatch system that cannot log, isolate and report an intrusion within three hours is a compliance exposure, and the law sets fines of up to 40,000 UTM for the most serious infractions. The commercial consequence is a shift in buying criteria from price per vehicle to auditable security controls, which favours vendors with certified security management systems and local incident-response capacity.
Market Dynamics
Key Drivers
Five conditions move the market, and enterprise economics matter more than consumer demand.
- Fleet operators buy software because it pays back inside a budget year. Chile's 2025 truck sales rose 18% to 14,394 units and bus sales rose 139% to 4,932, adding new vehicles to fleets that already run tracking, fuel monitoring and driver scoring. Light commercial vans and heavy freight trucks together hold an estimated 50.00% of 2025 software value, USD 156.23 million, because operators treat telematics as a cost-control tool rather than an option.
- Public procurement makes every new bus a connected bus. Every Red Movilidad bus reports to the system's central fleet management platform, and the electric fleet reached 4,088 electric units in February 2026, 62% of the system. The Ministerio de Transportes y Telecomunicaciones (MTT) projected on 29 September 2026 that Santiago will pass 4,500 zero-emission buses during 2027 and that regional cities will reach 1,254. Each bus carries battery telemetry, passenger information and driver-monitoring software from the day it enters service.
- Copper mining converts haul trucks into software platforms. BHP's Spence operation runs 33 Komatsu 980E-5 trucks under the FrontRunner autonomous haulage system, Escondida reached 33 autonomous trucks in July 2025, Teck's Quebrada Blanca 2 operates 20 autonomous units with 28 planned for 2026, and Minera Centinela began autonomous operation at Encuentro Sulfuros on 12 February 2026. Site counts are figures reported by the operators and the mining trade press that Marqstats has not independently verified. Mining haulage software grows at an estimated 22.97% a year to USD 109.81 million in 2030.
- Imported vehicles arrive with more software fitted every model year. Brands of Chinese origin took 32.4% of 2025 light-vehicle sales and increasingly fit embedded connectivity, app control and driver-assistance features as standard. Consumer passenger software value grows at an estimated 26.40% a year, faster than the market, from USD 75.93 million to USD 244.98 million.
- Network capacity has stopped being a constraint. SUBTEL counted 9,698,786 5G connections in December 2025, up 58.8% in a year. Cloud services, connected apps and OTA infrastructure grow at an estimated 23.61% a year to USD 160.49 million in 2030, because a national 5G footprint makes full-vehicle software updates and video telematics practical outside the largest cities.
Key Restraints
Four constraints stand between the market and the software-led value case its forecast assumes.
- Private buyers do not pay subscriptions, and Chilean regulation has taught them not to. Ley 21.170 placed the cost of anti-theft tracking on insurers, so consumer telematics reached the market as a free accessory. Consumer passenger cars hold only 24.30% of 2025 software value despite making up most new registrations. Without a paying consumer, importers absorb connectivity costs into the vehicle price and the recurring revenue stays with fleet platforms.
- The installer channel has already failed once in public. Under the SERNAC conciliation of 5 May 2025, HDI Seguros and SURA agreed to compensate about 400,000 policyholders, roughly 251,000 and 148,000 respectively, with around CLP 1,300 million for GPS devices that were never delivered or arrived late. Any software model that depends on a physical retrofit at scale carries the same execution risk.
- Chile has no domestic vehicle engineering base to shape software. With no passenger car assembly in the country, local suppliers cannot sell into factory architectures, and importers control access to vehicle data only as far as each brand allows. Factory-integrated platforms grow at an estimated 30.89% a year, but most of that value is booked by foreign manufacturers and their cloud partners, not by Chilean companies.
- Compliance raises the cost of serving the most valuable buyers. The three-hour early-alert rule under Ley 21.663 and ANCI's Resolución Exenta 187 list of 239 institutions require transport operators to show security controls across their vehicle data flows. Smaller telematics vendors without certified security management systems face higher costs to keep those accounts, which concentrates the regulated segment among larger platforms.
Key Trends
Four shifts show where the market is heading and who benefits.
- Video telematics is replacing location tracking as the entry product in mining logistics. Geotab presented its GO Focus Plus AI video telematics system at Exponor 2026 in Antofagasta on 10 June 2026, detecting distraction, phone use and close following in real time. Driver-assistance and safety software rises from an estimated 18.00% of market value in 2025 to 22.00% in 2030, the fastest-gaining stack layer at a 27.01% CAGR.
- Charging and fleet software are being bought together with the depot. Copec won a DTPM tender in February 2026 to build six electroterminals in Santiago serving about 559 electric buses, with its Copec EMOAC and Copec Voltex units handling software operation, charging infrastructure and energy management. Transit software is moving from the bus to the depot contract, which changes who sells it.
- Autonomy is moving from one-off pilots to whole pits. Minera Centinela started its Encuentro Sulfuros pit with six autonomous trucks in February 2026 and plans 26 during the year, as part of an investment above USD 1,000 million in that pit. When a new pit is designed for autonomy from the start, software is specified with the trucks, not retrofitted later.
- Plug-in vehicles are finally adding software-native architectures to the private fleet. ANAC recorded 12,702 plug-in sales between January and August 2026, up 143.4% year on year and 6.2% of light-vehicle sales, against 8,754 in the whole of 2025. Battery-electric platforms run centralised computing and OTA updates by design, so each plug-in sale adds more software value than a mild hybrid on a conventional network.
Strategic Implications
- For an entrant, the opening is enterprise fleets, not the consumer aftermarket. Three quarters of 2025 value, an estimated 75.70%, comes from fleets, transit and mining. A vendor entering Chile should lead with a fleet platform that can show Ley 21.663-ready security controls and a local support team, and should avoid any model that depends on mass physical installation, given the SERNAC conciliation of May 2025.
- For an incumbent retrofit platform, the 2029 crossover is the planning horizon. Retrofit value still grows, from an estimated USD 193.72 million to USD 388.58 million, but its share falls from 62.00% to 46.00%. Platforms that build data integrations with the Chinese-origin and Korean-origin brands now taking nearly half of light-vehicle sales keep their fleet customers when the hardware becomes factory-fitted. Platforms that only sell boxes lose them.
- For an automotive importer, connectivity is an aftersales asset that is currently given away. Inchcape, Astara and the other distribution groups control the delivery point for 310,598 new light vehicles a year. Activating factory telematics at delivery, and using it to satisfy insurer tracking obligations, turns a compliance cost into a service relationship that lasts the life of the vehicle.
- For a mining technology supplier, northern Chile is a service market as much as an equipment market. Autonomous fleets at Spence, Escondida, Quebrada Blanca 2, Gabriela Mistral and Centinela need dispatch software, private networks, on-vehicle computing maintenance and remote operations support for the life of each pit. Mining haulage software grows at an estimated 22.97% a year, faster than the market, and the contracts run for years.
Market Segmentation
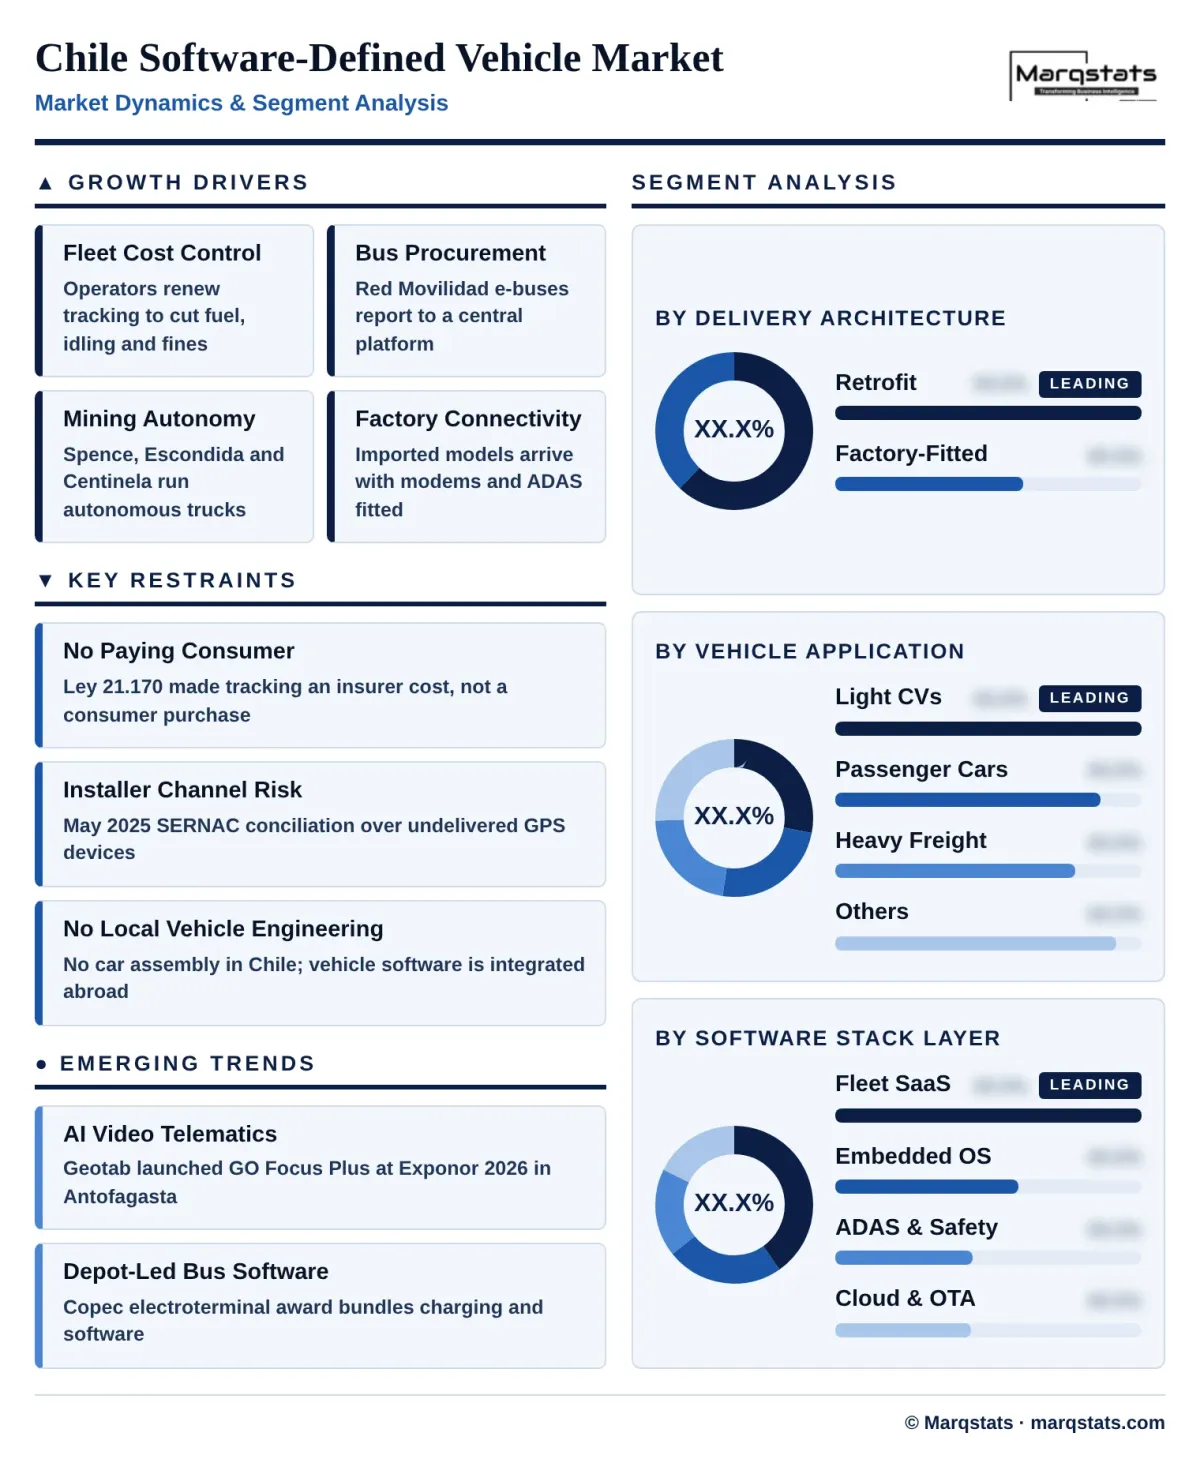
Enterprise retrofit platforms are the incumbent channel and the declining share. They account for an estimated USD 193.72 million, 62.00% of 2025 value, falling to 46.00% by 2030 at USD 388.58 million, a CAGR of 14.94%. The segment covers CAN-bus integrated tracking, video telematics, fuel and driver analytics and autonomy retrofits sold by Geotab, Wisetrack, SONDA and mining automation suppliers to operators whose vehicles left the factory without usable connectivity.
Factory-integrated platforms are the challenger and the growth engine. They hold an estimated USD 118.73 million, 38.00% of 2025 value, and reach USD 456.17 million, 54.00%, by 2030, a CAGR of 30.89%. Growth comes from embedded modems, manufacturer apps and OTA pipelines on imported models from General Motors, BYD, Stellantis and the Chinese-origin brands, and from factory telematics on every new Red Movilidad electric bus. On these paths the factory channel overtakes retrofit value during 2029, a Marqstats estimate.
Light commercial vehicles are the largest application and the steadiest. They account for an estimated USD 87.49 million, 28.00% of 2025 value, and USD 236.53 million, 28.00%, in 2030, a CAGR of 22.01%. Last-mile delivery, utilities and service fleets in Santiago run route optimisation and driver scoring as standard, and ANAC classifies 11% of 2025 light-vehicle sales as commercial vehicles.
Passenger cars are the largest fleet and only the second-largest software buyer. They hold an estimated USD 75.93 million, 24.30% of 2025 value, rising to USD 244.98 million, 29.00%, by 2030, a CAGR of 26.40%, the fastest of the five applications. SUVs took 51.1% of 2025 light-vehicle sales, and the factory-connected share rises with each model year as Chinese-origin brands extend embedded connectivity.
Heavy freight trucks carry the most software per road vehicle and grow below the market. They account for an estimated USD 68.74 million, 22.00% of 2025 value, and USD 168.95 million, 20.00%, by 2030, a CAGR of 19.70%. Long-haul fleets on Ruta 5 run fuel-theft monitoring, cold-chain compliance and tachograph data, and 14,394 new trucks entered the fleet in 2025.
Transit buses are the most electrified application and the slowest growing in value. They hold an estimated USD 41.24 million, 13.20% of 2025 value, and USD 84.48 million, 10.00%, by 2030, a CAGR of 15.42%. Santiago reached 4,088 electric buses in February 2026, so the remaining growth comes from regional cities, depot software and fleet renewal rather than first-time electrification.
Mining haulage is the smallest application by vehicle count and the most valuable per vehicle. It accounts for an estimated USD 39.05 million, 12.50% of 2025 value, rising to USD 109.81 million, 13.00%, by 2030, a CAGR of 22.97%. Autonomous systems from Komatsu and Caterpillar run at operations owned by BHP, Codelco, Teck and Antofagasta Minerals, with dispatch, collision avoidance and remote operations licensed for the life of each pit.
Fleet software is the largest layer and the one most exposed to the factory shift. It accounts for an estimated USD 125.61 million, 40.20% of 2025 value, and USD 312.56 million, 37.00%, by 2030, a CAGR of 20.00%. Recurring subscriptions for tracking, fuel analytics and driver behaviour sit here, supplied by Geotab, Wisetrack, SONDA and the mobile operators that resell fleet bundles.
Embedded software is the layer Chile imports entirely. It holds an estimated USD 74.99 million, 24.00% of 2025 value, and USD 185.85 million, 22.00%, by 2030, a CAGR of 19.90%. Real-time operating systems such as BlackBerry QNX, AUTOSAR middleware and drive-by-wire firmware on autonomous haul trucks are all integrated abroad by the vehicle or equipment manufacturer.
Driver-assistance software is the fastest-gaining layer. It accounts for an estimated USD 56.24 million, 18.00% of 2025 value, rising to USD 185.85 million, 22.00%, by 2030, a CAGR of 27.01%. Camera and radar fusion on imported cars, fatigue and distraction monitoring on buses and trucks, and collision avoidance on haul trucks all sit in this layer, with Mobileye, Bosch and Continental among the suppliers.
Cloud and OTA services are the smallest layer and grow faster than the market. They hold an estimated USD 55.61 million, 17.80% of 2025 value, and USD 160.49 million, 19.00%, by 2030, a CAGR of 23.61%. Manufacturer connected-services platforms such as General Motors OnStar, remote diagnostics and update pipelines expand as 5G coverage reaches 9,698,786 connections.
By Geography
Región Metropolitana de Santiago
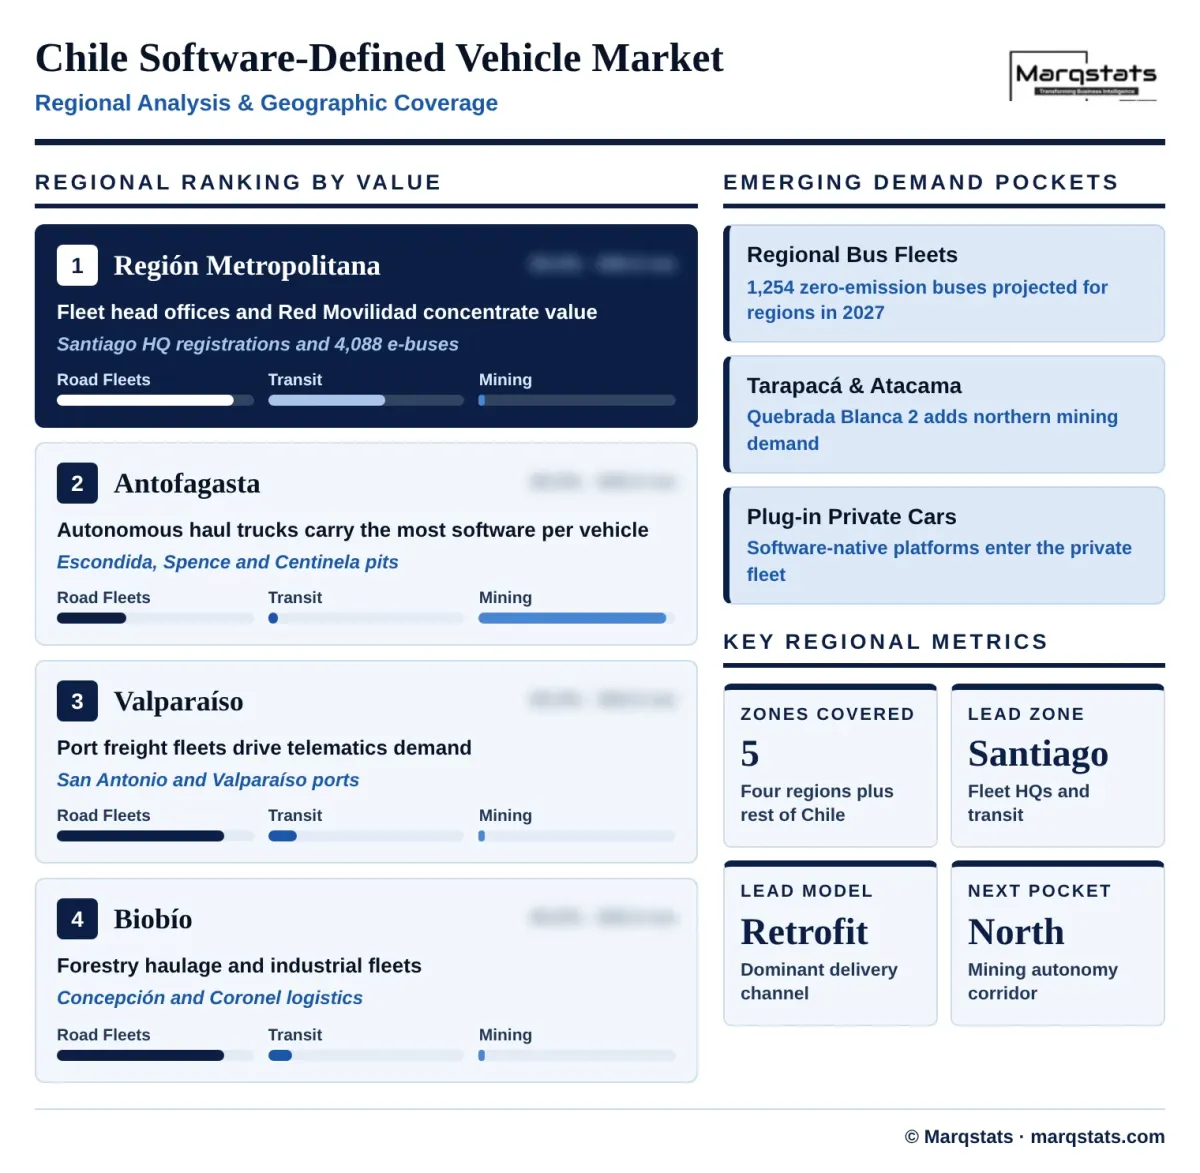
Santiago is where fleets are registered and where the transit system runs, and both inflate its share. The region accounts for an estimated USD 165.60 million, 53.00% of 2025 value. Part of that is an artefact: ANAC records 59.6% of 2025 new light-vehicle sales, 185,296 units, in the Metropolitan Region because importers, rental companies and leasing fleets register vehicles at their Santiago head offices before deploying them elsewhere. Red Movilidad's 4,088 electric buses are a genuine local concentration.
Antofagasta Region
Antofagasta holds a small share of the national fleet and the second-largest share of software value. The region accounts for an estimated USD 53.12 million, 17.00% of 2025 value, because autonomous haul trucks at Escondida, Spence and Centinela carry far more software per vehicle than any road vehicle. Exponor, held in Antofagasta, is where telematics suppliers such as Geotab now launch mining products.
Valparaíso Region
Valparaíso is the freight gateway, and its software demand follows containers rather than cars. The region accounts for an estimated USD 28.12 million, 9.00% of 2025 value, driven by truck fleets serving the ports of San Antonio and Valparaíso and by interurban freight on the Santiago corridor.
Biobío Region
Biobío is an industrial freight region with forestry at its core. It accounts for an estimated USD 23.43 million, 7.50% of 2025 value, from forestry haulage, manufacturing fleets and logistics around Concepción and the Coronel port terminals.
Rest of Chile
The rest of Chile combines the other northern mining districts with the agricultural south. It accounts for an estimated USD 42.18 million, 13.50% of 2025 value, of which Tarapacá and Atacama, home to Quebrada Blanca 2 and Collahuasi, represent about USD 18.75 million. MTT's projection of 1,254 zero-emission buses in regional cities during 2027 adds a transit component that this group largely lacked in 2025. Regional values are Marqstats estimates for the base year; regional forecasts are part of the delivered analysis.
How Competition Is Evolving
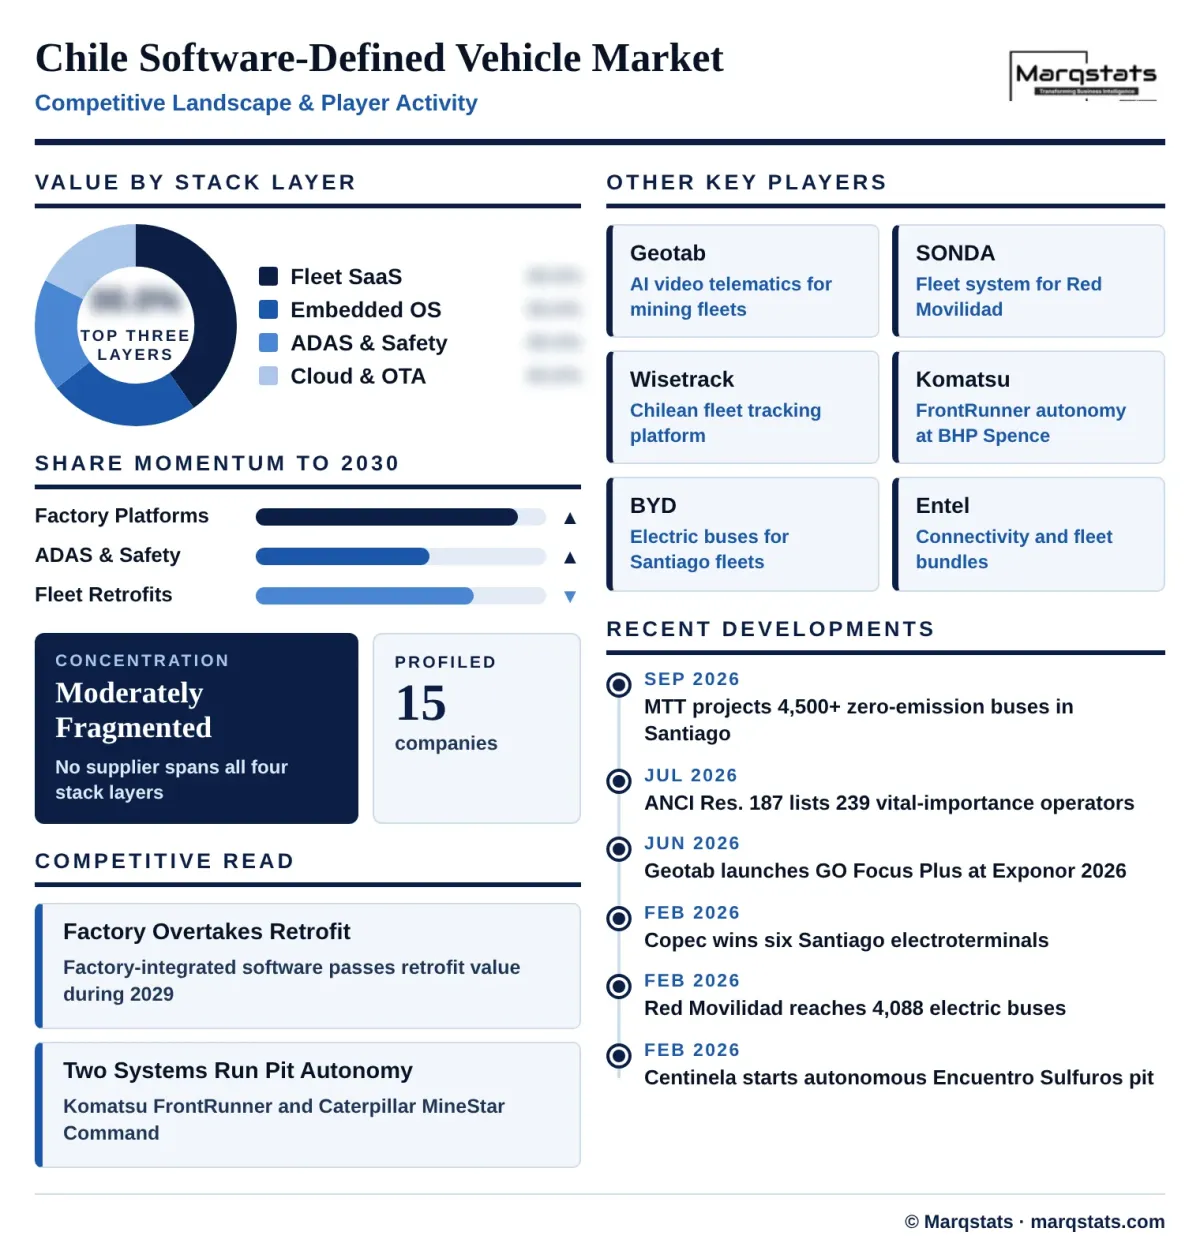
The market is moderately fragmented, and concentration differs sharply by layer. No supplier spans all four stack layers. Fleet software is split between global platforms such as Geotab, Chilean platforms such as Wisetrack and integrators such as SONDA, which runs the fleet management system for Red Movilidad. Mining autonomy is concentrated in two equipment-maker systems, Komatsu FrontRunner and Caterpillar MineStar Command. Embedded software and driver assistance belong to the vehicle manufacturers and their Tier-1 suppliers. Marqstats builds the group-level league table by layer in the delivered analysis; company subscriber or revenue shares are not published here because no Chilean regulator reports them.
The competitive question in 2026 is not which tracker wins the fleet but who owns the vehicle data once it is factory-fitted. Retrofit vendors compete on integration across mixed fleets, local installation and compliance support. Manufacturers compete on default activation at delivery. Mobile operators Entel and Movistar compete as the connectivity and bundling layer, and Copec's February 2026 electroterminal award shows energy companies entering through depot software.
Corporate identity needs care in this market. Komatsu Cummins Chile and Finning Chile are the local distributors of Komatsu and Caterpillar equipment, not separate autonomy suppliers, so counting them alongside the manufacturers double-counts the same revenue. Codelco, BHP, Teck, Antofagasta Minerals and Metbus are customers of the market rather than suppliers to it, and they appear in the analysis as demand, not as players.
Companies Covered
Companies covered in the report include:
Recent Market Activity
Table of Contents
Coverage & Segmentation
Coverage spans the Chile software-defined vehicle market from 2021 to 2030, with 2025 as the base year, 2021 – 2025 as the historical period and 2026 – 2030 as the forecast period. Values are in USD million at a constant Banco Central de Chile 2025 annual average observed dollar rate, so forecast growth carries no exchange-rate effect. Volume is measured as active connected and software-defined vehicle endpoints. The study covers three segmentation dimensions with eleven segments and five sub-national regions, and profiles 15 companies.
The boundary includes software, middleware, platform licences and recurring digital services on road vehicles and on autonomous haul trucks inside mining concessions. It excludes vehicle hardware, batteries and powertrains, telematics boxes, sensors and wiring, agricultural tractors, warehouse forklifts and construction machinery, and consumer voice plans. Endpoint and value series are Marqstats estimates; the primary host-fleet inputs are ANAC, SUBTEL and DTPM figures for 2025 and 2026. Regional values cover the base year only, because registration geography overstates Santiago and the normalisation is set out in Regional Analysis.