Market Snapshot
Middle bar: base-year value × (1 + CAGR), rounded to two decimals. This is a calculated illustration, not a separately researched annual estimate.
Market Size (2025, Base Year): USD 3,160.00 Million
Estimated Value (2026): USD 3,655.80 Million
Forecast Value (2030): USD 6,550.00 Million
CAGR: 15.69% | Forecast Period: 2026 – 2030
Growth — Absolute: USD 3390.00 Million
Active Connected Vehicle Parc: 15.47 Million Units (2025) to 24.04 Million Units (2030), Volume CAGR 9.22%
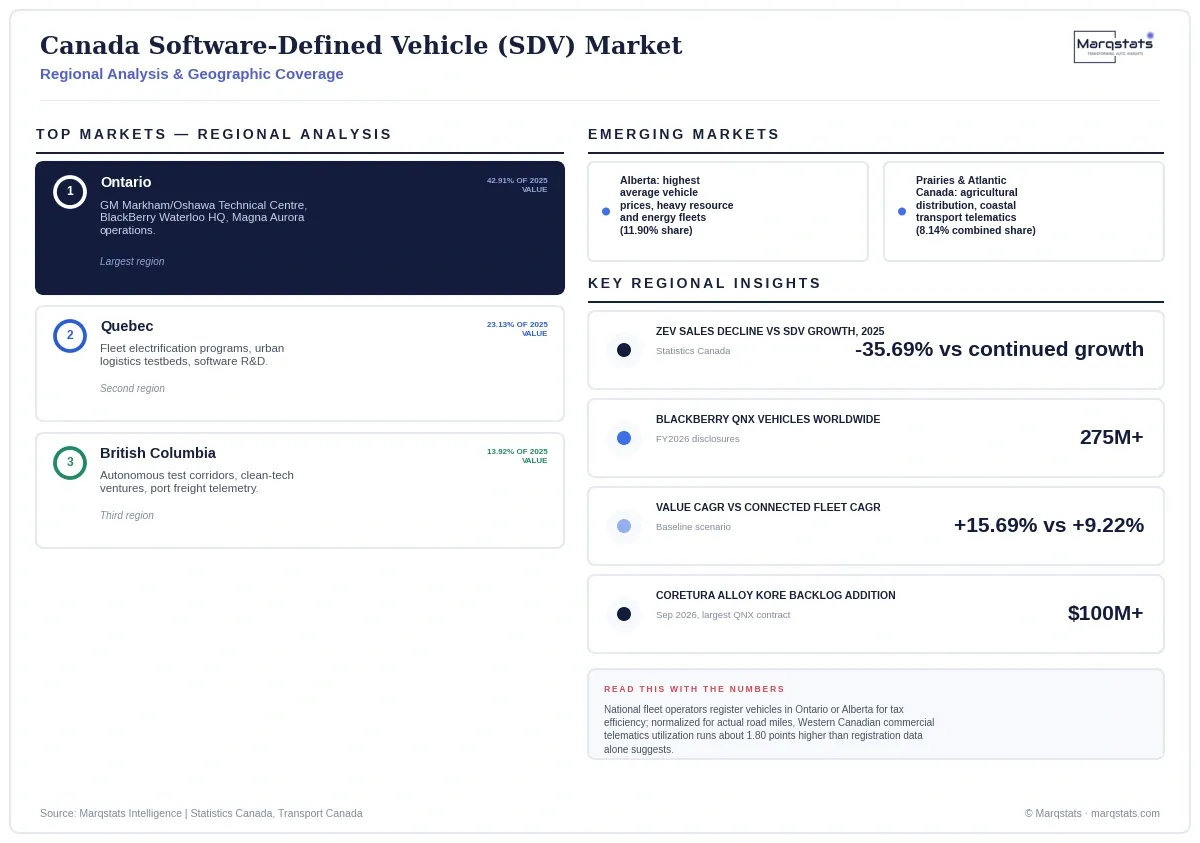
Largest Market: Ontario (42.91% of 2025 value)
Fastest Growing Segment: Commercial Freight & Utility (17.11% CAGR, 2025-2030)
Dominant Layer: Factory Embedded TCUs & Central Compute (73.13% of 2025 value)
Market Concentration: Moderately Concentrated (BlackBerry, Magna, GM Lead)
Base Year: 2025 | Historical Period: 2021 – 2025 | Forecast Period: 2026 – 2030
Units Considered: Value (USD Million)
Segments Covered: 2 | Regions Covered: 6 | Companies Profiled: 8
Report Pages: 165 | Deliverables: PDF, Excel, PPT
Key Takeaways
Market Overview & Analysis
Report Summary
Canada's software-defined vehicle market runs on a genuinely counterintuitive engine: the same year EV incentives were cut and zero-emission sales collapsed, SDV commercialization kept accelerating, carried by premium combustion and hybrid trucks rather than the electric transition federal policy was designed to drive.
The analysis measures the value of factory-embedded TCUs and central compute, middleware and OS runtimes, and cloud/OTA/fleet telematics software inside vehicles sold in Canada: USD 3,160.00 million in 2025, growing to USD 6,550.00 million by 2030.
The headline sizing chain derives substantially from Marqstats' own previously published Canada Connected Car Market report; this is disclosed prominently below and in the accompanying verification log as a methodological characteristic, not omitted.
The analysis is written for four readers: an OEM deciding how to commercialize SDV features on light-truck platforms rather than EVs, a software vendor evaluating Canada's engineering-export model, a telematics provider preparing for Bill C-8 compliance, and an investor tracking two regulation-anchored forward scenarios.
Canada's combination of a light-truck-dominated sales mix, a globally significant automotive software engineering base concentrated around Waterloo and Markham/Oshawa, and a fast-moving federal cybersecurity framework makes it a structurally distinct SDV market from EV-led jurisdictions elsewhere in this vertical, one worth reading on its own terms rather than as a smaller copy of a US or European pattern.
A Market That Grew While the Policy Meant to Drive It Shrank
The single fact that best explains Canada's SDV market in 2025 is also the one most likely to be misread if you assume SDV adoption tracks EV adoption everywhere.
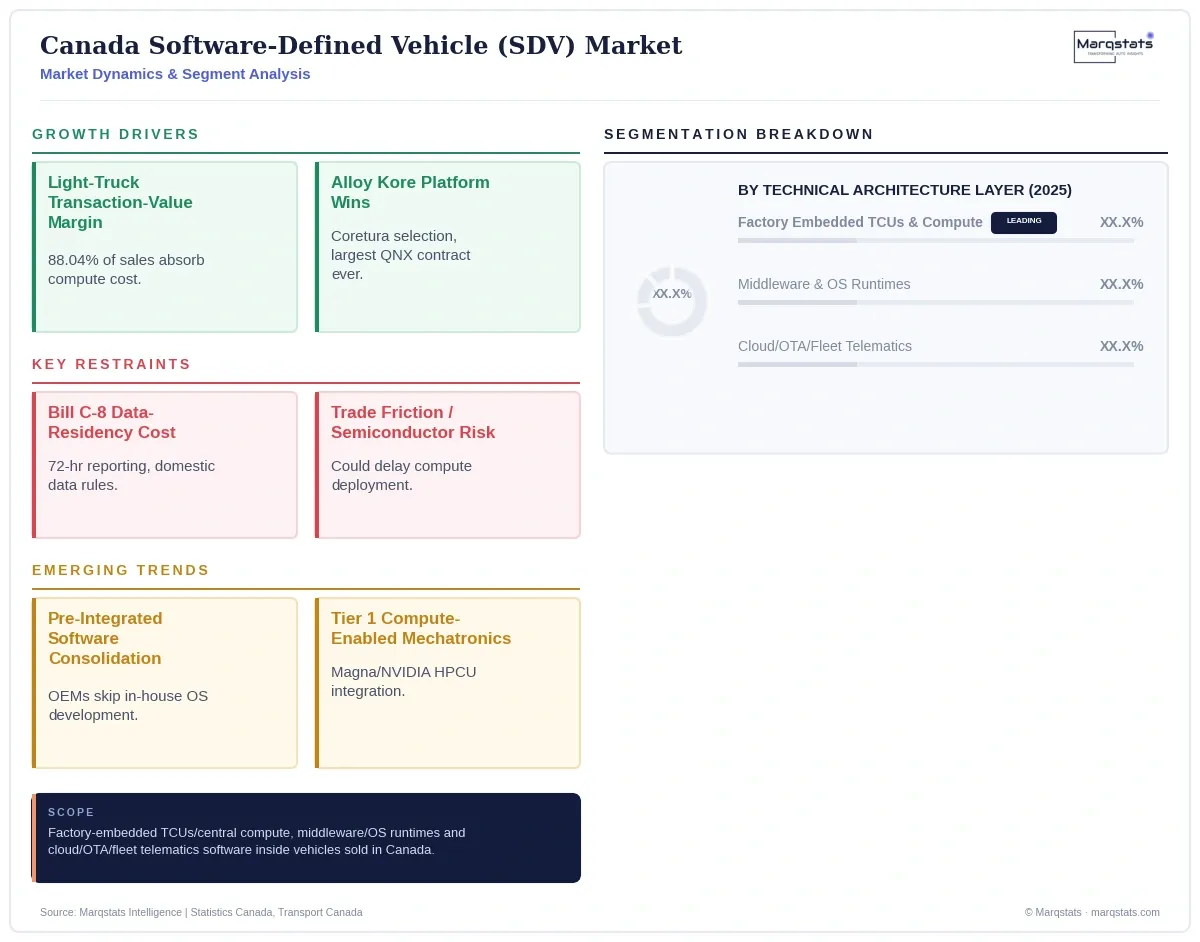
Following the exhaustion of the federal iZEV incentive and Quebec's Roulez vert rebate reduction from CAD 7,000 to CAD 4,000, zero-emission vehicle sales fell 35.69% year-over-year, from 264,277 units in 2024 to 169,972 in 2025. Under a model where SDV commercialization tracks electrification, that collapse should have dragged SDV growth down with it. It did not. Light trucks, SUVs and commercial vans, which reached 88.04% of 2025 unit sales and carried an average transaction price of CAD 57,276 against CAD 45,163 for passenger cars, continued absorbing centralized compute units, embedded modems and digital cockpit platforms regardless of powertrain. The structural driver of Canadian SDV adoption turns out to be transaction value, not propulsion technology: a vehicle expensive enough to carry high-performance compute silicon adopts SDV architecture whether it runs on gasoline, a hybrid system, or a battery, and Canada's fleet happens to be dominated by exactly that kind of vehicle.
A Country That Assembles a Fraction of What It Actually Powers
Canada's physical vehicle-assembly footprint and its actual software footprint are measured on entirely different scales, and the gap between them is the real story.
Canadian facilities assembled between 1.20 and 1.34 million physical light vehicles in 2024-2025 across Ontario plants run by GM, Ford, Stellantis, Honda and Toyota. Meanwhile, BlackBerry QNX's safety-certified operating system runs in more than 275 million vehicles worldwide, and GM's own Canadian Technical Centre in Markham and Oshawa, employing over 1,100 engineers, develops the Super Cruise software supporting more than 4.5 million GM vehicles globally that receive over-the-air updates, a fleet more than three times larger than Canada's own annual assembly output. Geotab, headquartered in Oakville, processes telematics data from over 5.0 million active commercial subscriptions worldwide. Canada's automotive economic footprint has become an intellectual-property export engine that operates almost independently of how many vehicles actually roll off Canadian assembly lines.
Why Commercial Vehicle Software Just Stopped Being Built From Scratch
Coretura's September 2026 decision is a small transaction with a large signal attached to it: heavy commercial-vehicle manufacturers have concluded that building proprietary operating systems in-house is no longer worth the cost.
Coretura, the joint venture between Daimler Truck and Volvo Group, selected the Alloy Kore platform, BlackBerry QNX's safety-certified real-time operating system co-developed with Vector Informatik's AUTOSAR Adaptive middleware, as its foundational software layer, adding over USD 100 million to QNX's royalty backlog in the largest single contract in the division's history. The commercial logic is straightforward: standardizing on a pre-integrated, pre-validated RTOS-and-middleware stack lets a heavy-vehicle manufacturer avoid the fragmented multi-vendor integration work and software launch delays that plague bespoke development, while the software provider triples realized per-vehicle revenue compared to a single-component licensing deal. For any commercial-vehicle OEM still weighing whether to build its own operating system, Coretura's decision is a live case study in what the alternative actually costs to skip.
A Provincial Registration Pattern That Hides Where Vehicles Really Work
Corporate tax efficiency, not operational geography, explains a meaningful slice of how Canada's SDV market appears to be distributed by province.
National commercial leasing corporations and rental fleet operators frequently register vehicle assets in Ontario or Alberta specifically to optimize provincial corporate tax and licensing structures, even though those vehicles operate nationally across interprovincial supply corridors. When normalized for actual interprovincial road miles traveled rather than raw registration counts, Western Canadian commercial telematics utilization runs approximately 1.80 percentage points higher than statutory registration data alone would suggest. For a telematics provider or fleet software vendor sizing regional opportunity, Ontario's 42.91% registration share overstates its share of actual operational activity, and Western Canada's true commercial footprint runs somewhat larger than the province-level numbers show on their face.
What Canada's Sensitivity Analysis Actually Admits
The most credible part of a market model is often the specific number it assigns to its own uncertainty, and this one names both figures plainly.
61.99% of the 2025 baseline valuation is directly supported by published statutory sales figures, documented hardware bills of materials, and audited software segment revenues, real, verifiable transaction data. The remaining 38.01% is derived through platform architecture allocations, a modelled rather than directly observed input. Sensitivity testing quantifies exactly how much that modelled portion matters: a USD 10.00 shift in realized annual software spend per active vehicle alone moves the 2025 baseline market by USD 154.70 million, and a 1.00 percentage-point deviation in the factory-embedded TCU fitment rate shifts initial hardware and software allocation by USD 24.08 million. For anyone treating this market's headline figure as a precise, singular number, these sensitivity ranges are a useful reminder that a meaningful share of it rests on an assumption, not an audited statement.
Why a Truck's Sticker Price Predicts Its Software Content Better Than Its Engine Does
If you had to guess which single number best predicts whether a Canadian vehicle ships with centralized compute architecture, transaction price beats propulsion type every time.
A CAD 57,276 average light truck and a CAD 45,163 average passenger car sit on opposite sides of a margin threshold that matters more to SDV adoption than whether either vehicle runs on gasoline, a hybrid powertrain, or a battery. High-performance compute silicon, multi-sensor perception suites and digital cockpit platforms carry a real bill-of-materials cost that a manufacturer needs pricing headroom to absorb without eroding margin, and Canada's light-truck-heavy sales mix supplies exactly that headroom independent of powertrain choice. This is a genuinely different adoption logic than markets where SDV rollout tracks EV rollout closely, and it means forecasting Canadian SDV penetration by watching EV incentive policy alone would have produced a badly wrong prediction for 2025.
A Provincial Fund That Spent Twice as Much to Get the Second Result
Ontario's provincial automotive technology funding history shows how a programme can outgrow its own original name while the underlying strategy stays remarkably consistent.
The province's current Ontario Vehicle Innovation Network commitment, CAD 56.4 million under Phase 2 of Driving Prosperity, builds directly on a prior CAD 85.0 million investment in the predecessor Autonomous Vehicle Innovation Network, bringing cumulative provincial funding to CAD 141.4 million. That programme connects over 400 domestic small- and medium-sized technology enterprises with global OEMs and academic research labs. Separately, and at a much larger scale, Invest Ontario reports having supported over CAD 15.1 billion in advanced automotive manufacturing commitments, creating more than 14,100 jobs. Together, these two funding streams show a province betting on both ends of the value chain simultaneously: OVIN cultivating smaller software and technology ventures, Invest Ontario anchoring large-scale manufacturing capital, a dual strategy that only makes sense if Ontario expects both the physical assembly side and the software engineering side of SDV production to keep growing together.
Market Dynamics
Key Drivers
- A light-truck-dominated sales mix, 88.04% of 2025 unit volume, provides the transaction-value margin needed to absorb high-performance compute silicon independent of powertrain or EV incentive status, a pattern 2025's ZEV sales collapse made unmistakably clear.
- BlackBerry QNX's pre-integrated Alloy Kore platform is winning major commercial-vehicle design contracts, most recently Coretura's, by letting OEMs skip costly proprietary operating system development entirely, a pattern likely to repeat across the sector.
- Canada's globally significant automotive software talent base, concentrated around Waterloo and Markham/Oshawa, sustains SDV value creation independent of domestic assembly-line volume, functioning effectively as an intellectual-property export engine.
- Ontario's OVIN and Invest Ontario programmes are channeling over CAD 15 billion in provincial commitments toward advanced automotive manufacturing and SDV-adjacent technology development.
- Rising commercial fleet software adoption, reducing unplanned downtime by up to 24% through CAN-bus predictive diagnostics, is sustaining enterprise ARPU growth independent of consumer subscription sentiment, especially across cold-climate fleets.
Key Restraints
- Bill C-8's cross-border data-residency requirements, if interpreted restrictively, could force costly infrastructure changes on telematics providers currently relying on North American cloud workflows.
- Escalating North American trade friction and automotive semiconductor supply-chain disruption would directly decelerate centralized compute deployment, the Trade & Supply Chain Bifurcation scenario's central trigger.
- Provincial registration clustering distorts regional demand data relative to where vehicles actually operate, complicating accurate territory-level planning for software and telematics vendors.
- Consumer EV incentive withdrawal, while not slowing SDV adoption overall, does remove one segment's purchase-subsidized pathway into centralized-compute vehicle ownership.
Key Trends
- Commercial-vehicle manufacturers are consolidating around pre-integrated third-party software foundations, following Coretura's Alloy Kore selection, rather than pursuing bespoke in-house operating system development.
- Tier 1 suppliers are transitioning from passive mechanical component manufacturing toward integrated, compute-enabled mechatronic systems, exemplified by Magna's expanded NVIDIA partnership.
- Edge AI processing integration is accelerating, with BlackBerry QNX and Hailo announcing an engineering partnership for low-latency automated-driving execution on safety-certified RTOS.
- Foundation-model-based simulation is beginning to replace hand-coded drive policies in automated-driving development, as outlined in Magna's August 2026 technical framework.
Strategic Implications
- Automotive manufacturers should decouple software release cycles from physical assembly tooling and adopt pre-integrated, safety-certified foundational platforms rather than building proprietary operating systems, freeing engineering investment for brand-differentiating cabin applications and fleet utility features rather than commodity infrastructure work.
- Tier 1 suppliers should accelerate the transition from passive mechanical component supply toward integrated, compute-enabled mechatronic systems, following Magna's systems-integration model with NVIDIA, since standalone mechanical parts risk commercial commoditization as centralized processors replace distributed microcontrollers.
- Software developers, telematics operators and cloud platform providers should build automated 72-hour incident-reporting workflows and domestic Canadian data-residency capability into product roadmaps now, ahead of Bill C-8's final enforcement, rather than treating compliance as a later retrofit.
- Investors should track Bill C-8's Royal Assent timeline and Transport Canada's UN GTR adoption schedule for Automated Driving Systems, the two named regulatory triggers separating the Baseline, Regulatory Acceleration and Trade Bifurcation scenarios, and should note that the headline sizing chain here draws substantially on a prior Marqstats report rather than fresh independent research, disclosed plainly in the evidence section.
Outlook
Two scenarios are tested against the Baseline trajectory, each anchored to a distinct, named trigger rather than differing growth-rate assumptions applied to the same story.
The Baseline scenario assumes Bill C-8 receives Royal Assent by late 2026 without disruptive cross-border data restrictions, factory-installed connectivity reaches 99.50% of new registrations by 2030, and the connected fleet expands to 24.04 million units. Value reaches USD 6,550.00 million, a 15.69% CAGR, with annual revenue per active unit rising to USD 272.46.
Under Scenario A (Regulatory Acceleration), Transport Canada formally adopts the UN GTR on Automated Driving Systems into the Motor Vehicle Safety Regulations by mid-2027, paired with a federal AEB and Level 2++ driver-monitoring mandate for commercial vehicles above Class 3 by 2028. The connected parc reaches 25.80 million units, and value reaches USD 7,680.00 million, a 19.44% CAGR, with annual revenue per unit climbing to USD 297.67.
Under Scenario B (Trade & Supply Chain Bifurcation), escalating North American trade friction and restrictive Bill C-8 data-rule interpretations disrupt automotive semiconductor supply chains by early 2027, extending legacy distributed-ECU lifecycles. The connected parc reaches only 21.90 million units, and value reaches USD 5,420.00 million, a 11.39% CAGR, with annual revenue per unit falling to USD 247.49.
Market Segmentation
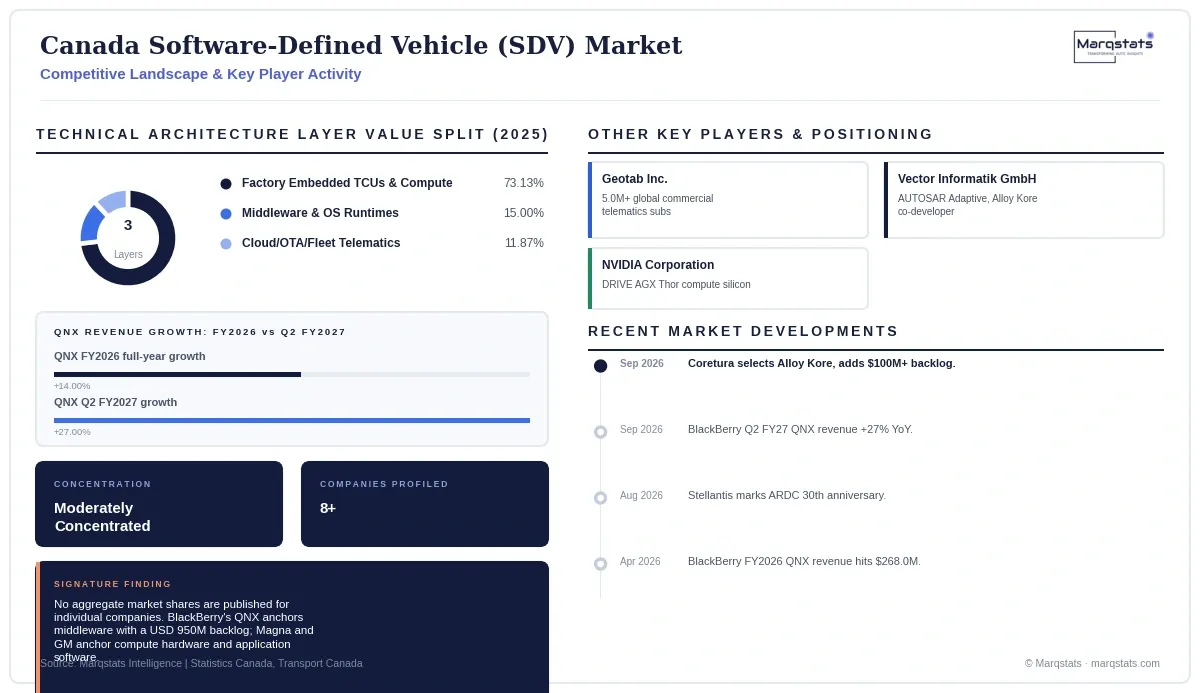
USD 2310.90 million (73.13% share) in 2025, moving to USD 5010.00 million (76.49% share) by 2030, a 16.74% CAGR.
USD 474.00 million (15.00% share) in 2025, moving to USD 851.50 million (13.00% share) by 2030, a 12.43% CAGR.
USD 375.10 million (11.87% share) in 2025, moving to USD 688.50 million (10.51% share) by 2030, a 12.91% CAGR.
USD 1863.13 million (58.96% share) in 2025, moving to USD 3746.60 million (57.20% share) by 2030, a 14.99% CAGR.
USD 1011.20 million (32.00% share) in 2025, moving to USD 2227.00 million (34.00% share) by 2030, a 17.11% CAGR.
USD 285.67 million (9.04% share) in 2025, moving to USD 576.40 million (8.80% share) by 2030, a 15.06% CAGR.
By Geography
Ontario
USD 1355.95 million (42.91% share) of national SDV value in 2025.
Quebec
USD 730.91 million (23.13% share) of national SDV value in 2025.
British Columbia
USD 439.87 million (13.92% share) of national SDV value in 2025.
Alberta
USD 376.04 million (11.90% share) of national SDV value in 2025.
Prairies (SK & MB)
USD 145.36 million (4.60% share) of national SDV value in 2025.
Atlantic Canada
USD 111.87 million (3.54% share) of national SDV value in 2025.
Corporate Fleet Registration Clustering
National commercial leasing corporations and rental fleet operators frequently register vehicle assets in Ontario or Alberta to optimize provincial corporate tax and licensing structures, even though those vehicles operate nationally across interprovincial supply corridors; normalized for actual road miles travelled, Western Canadian commercial telematics utilization runs approximately 1.80 percentage points higher than raw statutory registration distributions suggest.
How Competition Is Evolving
Canada's SDV ecosystem operates as an integrated multi-tier value stack spanning global OEM engineering centres, safety-certified software providers, Tier 1 compute integrators, and commercial fleet telematics platforms, alongside federal and provincial regulatory and investment bodies.
BlackBerry Limited, headquartered in Waterloo, Ontario, supplies safety-critical QNX RTOS and hypervisors embedded in over 275 million vehicles globally, backed by a USD 950 million royalty backlog as of fiscal 2026; its QNX division generated USD 268.0 million in FY2026 revenue (+14.00% YoY, 27.00% adjusted EBITDA margin, 84.00% gross margin), with Q2 FY2027 revenue of USD 80.3 million (+27.00% YoY) prompting raised full-year guidance to USD 616.0-636.0 million.
Magna International, headquartered in Aurora, Ontario, manufactures high-performance compute units and executes multi-sensor systems integration, expanding its NVIDIA partnership in January 2026 to produce DRIVE Hyperion-compatible ECUs on DRIVE AGX Thor processors. General Motors Canada operates its Canadian Technical Centre across Markham and Oshawa, employing over 1,100 engineers developing Super Cruise motion-control software supporting more than 4.5 million GM vehicles globally that receive over-the-air updates.
Geotab Inc., headquartered in Oakville, Ontario, processes CAN-bus telematics data from over 5.0 million active commercial vehicle subscriptions worldwide. Stellantis Canada operates its Automotive Research & Development Centre in Windsor, marking its 30th anniversary in 2026 with a new battery and software validation wing. Linamar Corporation (Guelph) and Martinrea International (Vaughan) both supply advanced drivetrain and AI-enabled manufacturing systems; Linamar's mobility segment normalized operating earnings grew 28.6% in Q2 2026.
Vector Informatik, based in Stuttgart with Waterloo operations, co-developed the Alloy Kore SDV software foundation with BlackBerry QNX, selected by Coretura (the Daimler Truck/Volvo Group commercial-vehicle joint venture) in September 2026. Transport Canada regulates federal vehicle safety under the Motor Vehicle Safety Act; the Ontario Centre of Innovation administers the Ontario Vehicle Innovation Network, and Invest Ontario supports provincial automotive manufacturing investment attraction.
Companies Covered
Companies covered in the report include:
Recent Market Activity
Table of Contents
Coverage & Segmentation
The analysis measures factory-embedded TCUs and central compute, middleware and OS runtimes, and cloud/OTA/fleet telematics software inside vehicles sold in Canada, for a 2025 base year and a 2026 to 2030 forecast, in United States dollars. It excludes passive automotive electronic components, discrete non-programmable relays, wiring harnesses and basic sensors, which represent a separate USD 1,420.00 million in domestic supplier turnover without SDV software integration.
The analysis covers two segmentation dimensions, technical architecture layer and vehicle application class, a six-province regional split, and eight profiled entities. The headline sizing chain derives substantially from a prior Marqstats report; this is disclosed as a methodology note rather than a sourcing gap. See the verification log for full detail.