Market Snapshot
Middle bar: base-year value × (1 + CAGR), rounded to two decimals. This is a calculated illustration, not a separately researched annual estimate.
Market Size (2025, Base Year): USD 896.72 Million
Estimated Value (2026): USD 1,148.42 Million
Forecast Value (2030): USD 2,568.10 Million
CAGR: 23.42% | Forecast Period: 2026 – 2030
Growth — Absolute: USD 1671.38 Million
SDV-Architected Delivery Volume: 353,695 Units (2025) to 898,500 Units (2030), Volume CAGR 20.50%
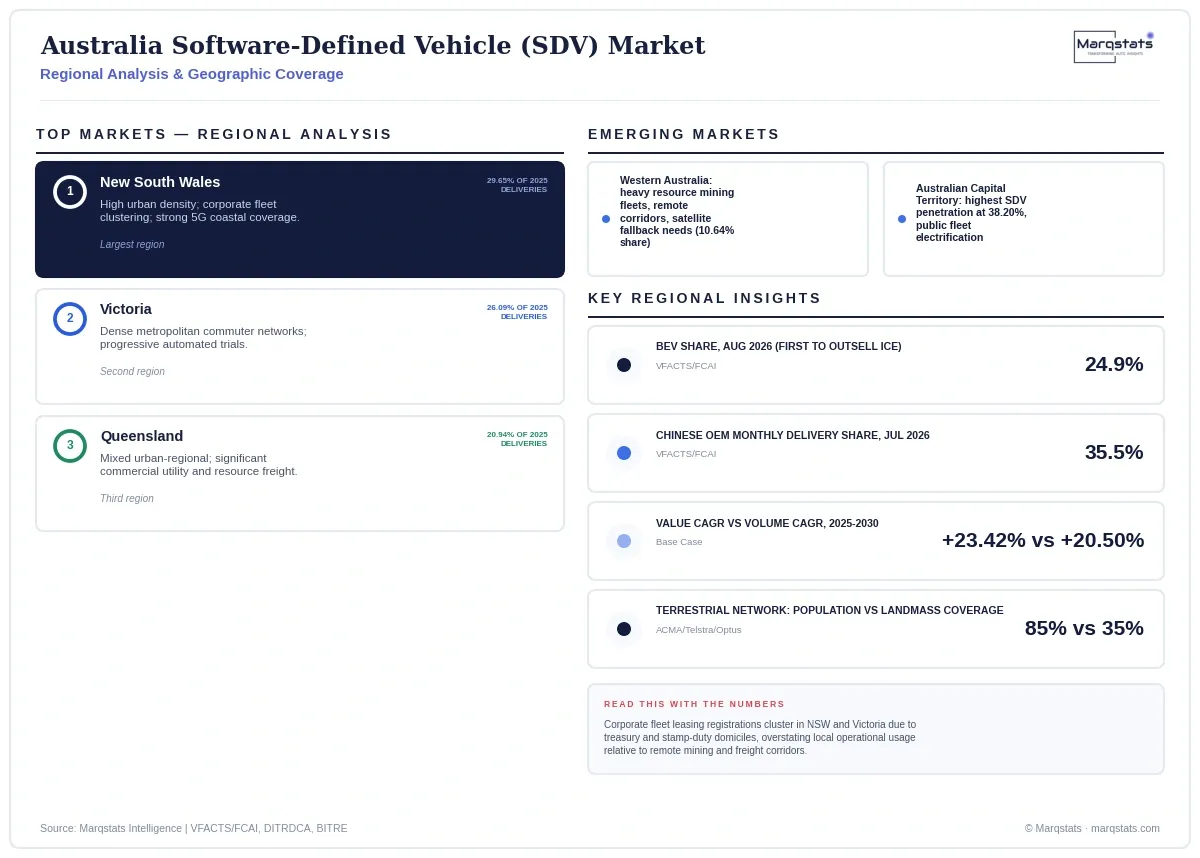
Largest Market: New South Wales (29.65% of 2025 deliveries)
Fastest Growing Monetization Stream: B2B Fleet Telematics & SaaS (28.36% CAGR, 2025-2030)
Dominant Stack Layer: Compute Hardware & Zonal Controllers (37.00% of 2025 value)
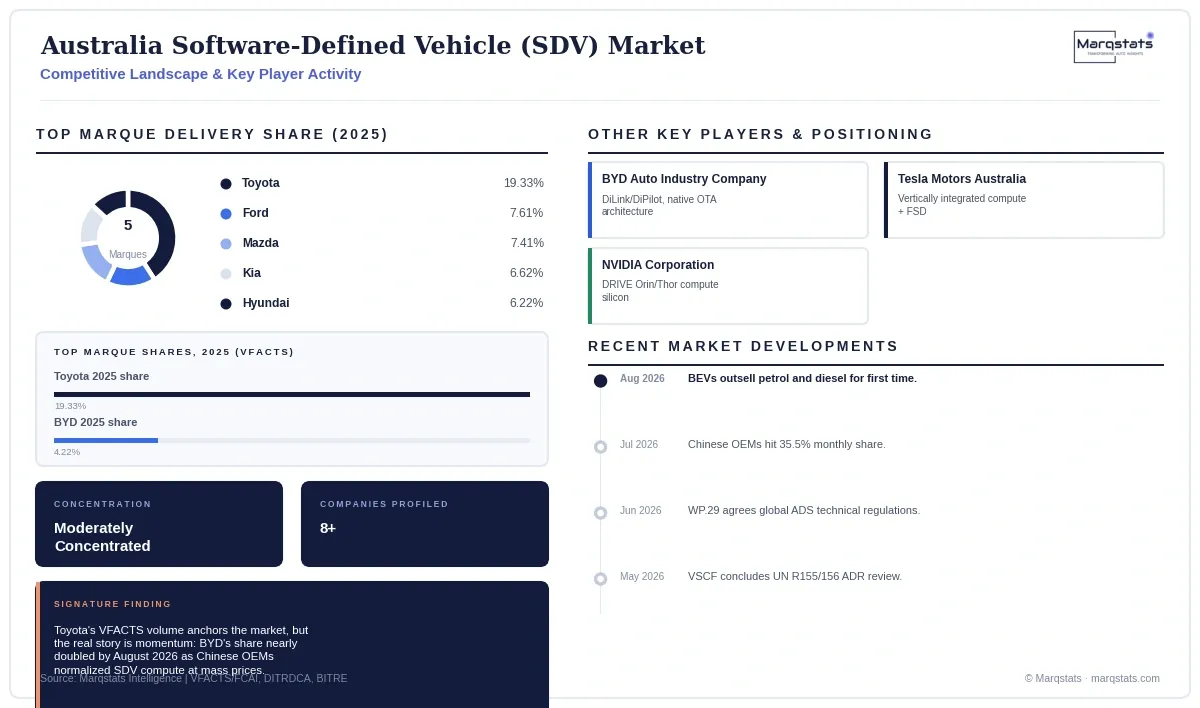
Market Concentration: Moderately Concentrated (Toyota Leads at 19.33%)
Base Year: 2025 | Historical Period: 2021 – 2025 | Forecast Period: 2026 – 2030
Units Considered: Value (USD Million)
Segments Covered: 2 | Regions Covered: 8 | Companies Profiled: 8
Report Pages: 165 | Deliverables: PDF, Excel, PPT
Key Takeaways
Market Overview & Analysis
Report Summary
Australia's SDV market is being written by importers, not builders: with no domestic passenger car manufacturing to protect, the country functions as an open testing ground where foreign architectures compete directly for market share, and that openness is exactly why Chinese OEMs have moved so fast.
The analysis measures the value of compute hardware, operating systems and middleware, connectivity and cybersecurity infrastructure, and ADAS/digital cockpit software inside new vehicles delivered in Australia: USD 896.72 million in 2025, growing to USD 2,568.10 million by 2030.
The core sizing and segmentation chain traces to a source Marqstats could not independently verify; this is disclosed prominently below and in the accompanying verification log, not omitted.
The analysis is written for four readers: an OEM deciding how fast to match Chinese competitors' standard-equipment compute strategy, a telecommunications carrier weighing satellite-hybrid coverage investment, a fleet operator budgeting for UN R155/R156 compliance, and an investor tracking three regulation-anchored forward scenarios.
Australia's position as a pure-import market with no tariff protection, combined with a continent-scale connectivity gap and a fast-accelerating Chinese OEM presence, makes it a useful stress test for how SDV architecture competes on merit alone, without the industrial-policy scaffolding that shapes markets like France or Germany, where domestic manufacturers can shape the transition on their own terms.
A Milestone Month That Ties Two Trends Into One
August 2026 produced two Australian automotive statistics that look unrelated until you notice they are actually the same story told twice.
Battery-electric vehicles outsold both petrol (25,824 units) and diesel (23,608 units) for the first time in Australian history that month, reaching 27,089 units and a record 24.9% share. The same month, Chinese manufacturers captured 35.5% of monthly deliveries and placed 5 brands in the national top ten. These are not two separate trends running in parallel; they are largely the same vehicles. Battery-electric platforms are architecturally built around centralized high-voltage battery management and digital drive-by-wire control, which makes them the natural host for SDV compute, and Chinese manufacturers have specifically built their competitive strategy around deploying that compute as standard equipment on affordable electric models rather than reserving it for premium grades. Electrification and SDV architecture are converging in Australia through the same vehicles at the same time, not through two independent adoption curves.
Why Australia Can't Just Wait for Global Standards to Arrive
Every other major SDV market in this vertical has some form of domestic industrial policy shaping its transition. Australia has almost none, and that absence is itself the story.
Because Australia maintains no domestic passenger vehicle manufacturing industry, DITRDCA cannot use tariffs, local-content rules, or industrial subsidies to steer which architectures win. The market imports whatever global platforms are commercially available and regulates them at the border through Australian Design Rule type-approval. This is precisely why the country's UN R155/R156 transposition schedule matters so much more than it would in a market like France or Germany: with no domestic industry to protect from disruption, the only lever DITRDCA has is timing the mandatory compliance date, and the HVIA's request for a three-to-four-year transition runway is really a request to delay the one regulatory tool that actually shapes which platforms Australian consumers get access to.
A Privacy Gap That Exists Because Nobody Closed It
Australia's connected-car privacy problem is not a new kind of risk. It is an old regulatory gap that connected vehicles happened to grow large enough to fall into.
UNSW Sydney's Law & Justice faculty found that automotive importers routinely bundle telemetry and behavioural-tracking consent into core safety, navigation and roadside-assistance functionality, structuring contracts so a consumer cannot decline data collection without disabling features most people would consider essential. That practice would be illegal under the EU's GDPR, which mandates explicit opt-in consent, and under California's CCPA, which prohibits withholding core product function from users who decline commercial profiling. The Australian Privacy Act 1988 simply does not contain an equivalent restriction, not because Australian regulators disagree with the principle, but because the Act predates connected vehicles by decades and nobody has yet closed the gap it left open. The AAA's 'My Car My Data' campaign is, in effect, asking parliament to retrofit 1988-era privacy law for a product category that did not exist when it was written.
The Infrastructure Problem No Software Update Can Fix
Some of the barriers to SDV adoption in Australia are regulatory. This one is purely physical, and no amount of better software changes it.
Terrestrial mobile networks cover more than 85% of the Australian population but less than 35% of the continent's landmass, a gap that matters enormously for an SDV architecture built around continuous cloud connectivity for navigation, ADAS calibration and fleet telematics. The 2024 shutdown of 3G networks made the stakes concrete: thousands of older connected vehicles lost automatic emergency crash notification and remote telematics entirely when their 3G-only modems went dark, a preview of what happens when infrastructure assumptions embedded in a vehicle's architecture stop holding true years after purchase. Hybrid satellite-cellular gateways are a genuine technical answer to the coverage gap itself, but the 3G shutdown demonstrated a separate, harder problem: connectivity infrastructure has a shorter useful life than the vehicles that depend on it, and no OTA update can retrofit a hardware modem that no longer has a network to talk to.
Two Ownership Models Competing for the Same Customer
Tesla and Toyota are both selling connected cars to the same Australian buyer. They are selling fundamentally different relationships with that buyer's data and software.
Tesla operates the market's most vertically integrated model: proprietary compute boards, in-house firmware, and self-managed cloud infrastructure, which enables fast over-the-air functional updates but locks owners into a single, closed software environment with no third-party alternative. Toyota is pursuing a deliberately transitional strategy instead, developing its proprietary Arene platform through Woven by Toyota while partnering with Telstra for domestic telematics, hedging between full vertical control and the horizontal-ecosystem approach Ford and Volvo take with Google Android Automotive OS. Which model wins isn't just a technology question, it is a question of how much control an Australian buyer is willing to hand a single manufacturer over their vehicle's entire digital experience, and that answer may differ sharply between a Tesla buyer and a Toyota buyer.
Why the Independent Mechanic Is Watching This Market Too
SDV architecture is creating collateral damage for a business that has nothing directly to do with software: the independent car repair shop.
Australia's Motor Vehicle Information Scheme already requires manufacturers to share diagnostic and repair data with independent mechanics on commercially fair terms. But as centralized SDV architectures route physical OBD-II diagnostic access through encrypted cybersecurity gateways to comply with UN R155, independent mechanics risk losing practical access to raw diagnostic streams even though the legal entitlement under MVIS hasn't changed. The Australian Automotive Aftermarket Association's push for standardized, open diagnostic APIs is really a request to make sure a cybersecurity regulation aimed at protecting vehicles from malicious actors doesn't accidentally lock out the legitimate repair sector as a side effect.
A Sizing Model That Admits What It Cannot Directly Measure
Most market reports present their headline number without explaining how much of it rests on a genuinely uncertain input. This one names the number.
Approximately 39.4% of the headline valuation represents directly audited hardware bill-of-materials allocations and carrier data contracts, real, verifiable transaction data, while the remaining 60.6% represents modelled OEM embedded software stack apportionments derived from published platform filings rather than a single disclosed figure. Sensitivity testing makes the stakes concrete: a USD 100 swing in the average capitalized software and middleware value per imported vehicle moves the entire 2025 baseline market sizing by USD 35.37 million on its own. That single variable, the value analysts can least directly observe, is also the one the market's size is most sensitive to, which is a useful reminder for anyone treating this market's headline figure as more precise than the underlying inputs actually support.
Market Dynamics
Key Drivers
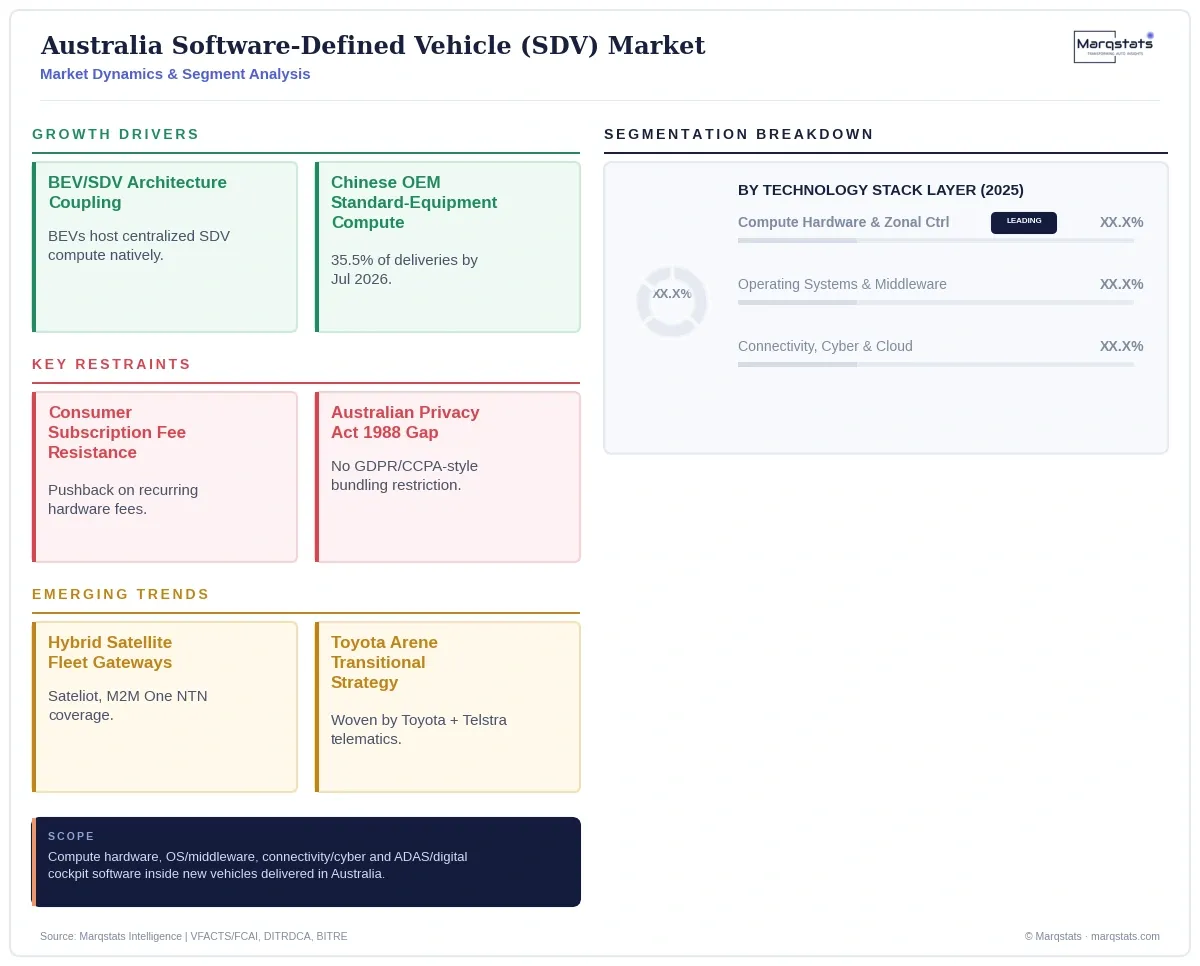
- Battery-electric vehicle growth is directly coupled to SDV adoption, since BEV platforms are architecturally built around the centralized compute that hosts SDV software, a link August 2026's BEV milestone made unmistakably concrete.
- Chinese OEM expansion is normalizing high-compute, OTA-capable architecture as standard equipment at mass-market price points, forcing legacy importers to accelerate their own deployment timelines rather than reserving centralized compute for premium grades.
- UN R155/R156 transposition into the Australian Design Rules is establishing a mandatory compliance floor that legacy distributed-ECU architectures cannot meet, on a timeline DITRDCA is actively negotiating with commercial vehicle body builders.
- Commercial B2B fleet telematics adoption is accelerating on genuine operational need, real-time diagnostics, road-user-charging verification, and driver safety scoring, independent of consumer subscription sentiment, making it the more resilient of the market's two monetization channels.
- Hybrid satellite-cellular connectivity investment from Sateliot and M2M One is extending SDV-dependent fleet telematics into terrestrial network blackspots.
Key Restraints
- Consumer resistance to recurring subscription fees for pre-installed hardware functionality is constraining the smallest but most visible monetization channel.
- A privacy-law gap in the Australian Privacy Act 1988 is drawing sustained advocacy pressure that could eventually force costly retrofits to existing telemetry consent architecture.
- Continent-scale connectivity gaps outside the top two states mean SDV architecture built around continuous cloud connectivity cannot function uniformly nationwide without hybrid satellite fallback investment.
- A delayed AVSL and potential geopolitical restrictions on foreign sensor hardware could constrain Level-3 automated-driving deployment and cap SDV value growth in the Downside scenario.
Key Trends
- Hybrid satellite-cellular telematics gateways are becoming standard equipment for commercial fleets operating across remote mining, agricultural and freight corridors.
- Toyota's transitional Arene platform strategy, developed through Woven by Toyota, signals legacy importers moving from bundled hardware telematics toward proprietary software platforms.
- Independent repair sector advocacy for standardized diagnostic APIs is intensifying as centralized SDV architecture routes OBD-II access through encrypted cybersecurity gateways.
- Level-3 automated driving deployment is emerging as a discrete regulatory trigger point, with the AVSL's ADSE liability framework the key mechanism separating scenario outcomes.
Strategic Implications
- Vehicle importers should treat Chinese OEMs' standard-equipment compute strategy as the competitive benchmark, not a niche threat, since five Chinese brands already rank in the national top ten and the gap in digital cockpit and OTA capability at sub-AUD 40,000 price points is closing fast.
- Telecommunications carriers and satellite operators should prioritise commercial fleet telematics contracts over consumer subscription products, given B2B fleet telematics is both the fastest-growing monetization stream and structurally insulated from consumer subscription-fatigue dynamics.
- OEMs and Tier 1 suppliers should prepare for UN R155/R156 compliance ahead of DITRDCA's final enforcement date rather than relying on the delayed Australian timeline indefinitely, since the EU's own July 2024 deadline shows the direction of travel is fixed.
- Investors should track AVSL passage timing and the DITRDCA's phased UN R155/R156 enforcement schedule, the two named regulatory triggers separating the Base, Upside and Downside scenarios, and should treat the core sizing and segmentation figures here with the caution disclosed in the evidence section, since a majority of the headline valuation rests on modelled rather than directly audited inputs.
Outlook
Three scenarios are tested, each anchored to a distinct, named regulatory trigger rather than differing growth-rate assumptions applied to the same story.
Under the Base Case (Structured Harmonization), DITRDCA transposes UN R155/156 with phased enforcement across 2027-2028 and the Automated Vehicle Safety Law passes federal parliament, while Chinese OEMs hold a 30-35% delivery share. Volume reaches 898,500 units, a 20.50% CAGR, and value reaches USD 2,568.10 million, a 23.42% CAGR.
Under the Upside Case (Autonomy Acceleration), the AVSL is fully operationalized by early 2027, enabling Level-3 automated driving on major national freight highways, and importers shift from proprietary walled-garden ecosystems toward standardized Android Automotive/Linux platforms. Volume reaches 1,080,000 units at 80.00% penetration, and value reaches USD 3,184.50 million, a 28.85% CAGR.
Under the Downside Case (Regulatory Friction), geopolitical data-security concerns trigger sovereign data-storage restrictions or import constraints on foreign sensor hardware, while the AVSL faces prolonged legislative delay, leaving Level-3 systems prohibited. Volume reaches only 675,000 units at 50.00% penetration, and value reaches USD 1,892.40 million, a 16.11% CAGR.
Market Segmentation
USD 331.79 million (37.00% share) in 2025, moving to USD 873.15 million (34.00% share) by 2030.
USD 251.08 million (28.00% share) in 2025, moving to USD 667.71 million (26.00% share) by 2030.
USD 179.34 million (20.00% share) in 2025, moving to USD 564.98 million (22.00% share) by 2030.
USD 134.51 million (15.00% share) in 2025, moving to USD 462.26 million (18.00% share) by 2030.
USD 672.54 million (75.00% share) in 2025, moving to USD 1797.67 million (70.00% share) by 2030, a 21.73% CAGR.
USD 140.03 million (15.62% share) in 2025, moving to USD 487.94 million (19.00% share) by 2030, a 28.36% CAGR.
USD 84.15 million (9.38% share) in 2025, moving to USD 282.49 million (11.00% share) by 2030, a 27.41% CAGR.
By Geography
New South Wales
367,947 deliveries (29.65% share) in 2025; 109648.00 SDV-equipped deliveries at a 29.80% SDV penetration rate.
Victoria
323,768 deliveries (26.09% share) in 2025; 98749.00 SDV-equipped deliveries at a 30.50% SDV penetration rate.
Queensland
259,903 deliveries (20.94% share) in 2025; 68095.00 SDV-equipped deliveries at a 26.20% SDV penetration rate.
Western Australia
132,067 deliveries (10.64% share) in 2025; 33545.00 SDV-equipped deliveries at a 25.40% SDV penetration rate.
South Australia
78,811 deliveries (6.35% share) in 2025; 21358.00 SDV-equipped deliveries at a 27.10% SDV penetration rate.
Tasmania
19,892 deliveries (1.60% share) in 2025; 4476.00 SDV-equipped deliveries at a 22.50% SDV penetration rate.
Australian Capital Territory
16,917 deliveries (1.36% share) in 2025; 6462.00 SDV-equipped deliveries at a 38.20% SDV penetration rate.
Northern Territory
10,503 deliveries (0.85% share) in 2025; 1355.00 SDV-equipped deliveries at a 12.90% SDV penetration rate.
Registration-vs-Operation Distinction
Major national fleet management organizations, corporate leasing providers and rental operators frequently register assets in New South Wales or Victoria due to consolidated treasury operations and centralized corporate headquarters, so published metropolitan registration statistics overstate local operational usage relative to vehicles actually deployed across Western Australian mining hubs, Queensland resource corridors and agricultural logistics routes.
How Competition Is Evolving
The Australian SDV ecosystem spans vehicle importers, Tier 1 semiconductor and software vendors, telecommunications carriers, and statutory/advocacy bodies. Vehicle importer market shares are independently and specifically sourced to VFACTS data published by the Federal Chamber of Automotive Industries and are shown in full.
Toyota Motor Corporation Australia leads with 239,863 2025 deliveries (19.33% share), operating the myToyota Connect platform on Telstra 4G/5G eSIM infrastructure with tiered Connect+ and Multimedia subscription services. Ford Motor Company of Australia follows with 94,399 deliveries (7.61%), built on its Fully Networked Vehicle (FNV4) zonal architecture across the Ranger utility platform.
BYD Auto Industry Company, with 52,415 2025 deliveries (4.22% share, rising to 8.10% by August 2026 YTD), deploys its DiLink digital cockpit and DiPilot ADAS with native over-the-air firmware update architecture across its BEV and PHEV range. Tesla Motors Australia operates the market's most vertically integrated model, designing proprietary compute boards, firmware and cloud infrastructure in-house, offering its FSD (Supervised) suite for either a one-time AUD 10,100 upfront fee or an AUD 149 monthly subscription.
Tier 1 semiconductor supply is anchored by NVIDIA Corporation (DRIVE Orin/Thor compute platforms) and Qualcomm Technologies (Snapdragon Digital Chassis and Ride platforms), both supplying central compute silicon across imported OEM platforms. BlackBerry Limited supplies the QNX Neutrino RTOS underlying safety-critical cluster and gateway ECUs across multiple brands, while Google LLC's Android Automotive OS anchors the digital cockpit layer for Polestar, Volvo, Renault and Ford lines.
Telstra Group and Optus Networks provide the dominant terrestrial M2M/cellular connectivity infrastructure; Telstra mandated IPv6 addressing for all newly onboarded IoT/M2M devices from 2026 to prevent address exhaustion as the connected fleet scales. Statutory oversight runs through the Department of Infrastructure (DITRDCA), which is transposing UN R155/R156 into the Australian Design Rules, and the National Transport Commission, which is drafting the Automated Vehicle Safety Law and its Automated Driving System Entity framework.
Companies Covered
Companies covered in the report include:
Recent Market Activity
Table of Contents
Coverage & Segmentation
The analysis measures compute hardware and zonal controllers, operating systems and middleware, connectivity/cyber/cloud orchestration, and ADAS/ADS/in-cabin digital software inside new vehicles delivered in Australia, for a 2025 base year and a 2026 to 2030 forecast, in United States dollars at a constant 0.655 AUD/USD rate matching the Reserve Bank of Australia's 2025 trade-weighted baseline. It excludes the physical vehicle glider and electromechanical assemblies.
The analysis covers two segmentation dimensions, technology stack layer and commercial monetization stream, an eight-state/territory regional split, and eight profiled entities. The core sizing/segmentation chain carries a sourcing flag; vehicle importer market shares (VFACTS) do not. See the verification log for full disclosure.