Market Snapshot
The Australia passenger car market is valued at USD 32.73 billion in 2025 and is forecast to reach USD 38.65 billion by 2030, a CAGR of 3.38%. Volume rises from 922,544 new passenger cars and SUVs to 1,012,000 units, a 1.87% CAGR. Value outruns volume because the buyer is trading up in powertrain, not in body size.
Marqstats builds the value from units, not from a published dollar total. The 922,544 units are the Federal Chamber of Automotive Industries (FCAI) VFACTS passenger and SUV deliveries combined with Tesla and Polestar deliveries reported through the Electric Vehicle Council (EVC). Each unit carries a Marqstats average transaction price of AUD 55,000 before on-road costs, derived from the AUD 34,466 million customs value of passenger motor vehicle imports that the Department of Foreign Affairs and Trade (DFAT) reports for 2025, grossed up for freight, distribution margin, Luxury Car Tax and GST. The forecast is most sensitive to that price: every AUD 1,000 on the 2025 average moves the base value by USD 0.60 billion.
The headline hides a sharp internal rotation. SUVs took 757,697 deliveries in 2025, or 82.13% of the in-scope market, while sedans, hatches, wagons, sports cars and people movers fell to 164,847 units. That is 22.01% below the 211,361 passenger cars sold in 2023.
Electrification is now the faster-moving variable. Battery-electric vehicles (BEVs) were 8.3% of all new vehicles in 2025, then 18.9% of light-vehicle sales in the first nine months of 2026, while the FCAI-only year-to-date total barely moved (914,312 against 914,439). Buyers are swapping drivetrains inside a market that is not getting bigger.
The New Vehicle Efficiency Standard (NVES) sets the pace. The Type 1 passenger limit fell from 141 g CO2/km in 2025 to 117 g/km in 2026 and reaches 58 g/km in 2029, and the policy itself became an election question in September 2026 when the Coalition pledged to repeal the Act.
Key Takeaways
Market Overview & Analysis
Report Summary
Australia is a mature, fully imported market of about 1.24 million new vehicles a year, and its passenger car and SUV layer stopped growing in volume during 2025. What changed in 2026 is the powertrain. Battery-electric share of light-vehicle sales climbed from 8.4% in January to 23.4% in June, according to the FCAI, and FCAI chief executive Tony Weber said the market had shifted on its axis. That makes 2025 an unusually clean base year: the last full year before electrified drivetrains moved from a niche to a quarter of the showroom.
The measure is new passenger cars (micro, light, small, medium, large and upper large cars, people movers and sports cars) plus SUVs of every size, delivered in Australia in calendar 2025. Units are the VFACTS passenger and SUV categories combined with Tesla and Polestar deliveries reported by the Electric Vehicle Council. Value is retail transaction value before on-road costs, inclusive of GST and Luxury Car Tax, excluding stamp duty, registration and compulsory third-party insurance. Light commercial vehicles, including 4x2 and 4x4 utes and vans (273,229 units in 2025), and heavy commercial vehicles (45,264 units) are out of scope, as are used vehicles, grey imports and the aftermarket.
Four readers use the analysis. Brand distributors deciding which body styles and drivetrains to land in 2027 and 2028 use the powertrain path. Dealer groups weighing franchise additions, especially Chinese brands, use the brand and origin evidence. Fleet and novated-lease providers pricing residual values use the BEV and PHEV trajectory. Component and charging investors use the NVES timetable to judge when demand for electrified parts and home charging turns from policy-led to buyer-led.
Australia Passenger Car Market Size and Forecast
Marqstats carries the in-scope unit series on the combined FCAI and EVC basis. Passenger cars and SUVs totalled 777,688 units in 2022 (203,056 cars and 574,632 SUVs out of 1,081,429 total deliveries), 890,823 in 2023 (211,361 and 679,462 out of 1,216,780), about 915,600 in 2024 (74.0% of 1,237,287, from the published 17.1% and 56.9% shares) and 922,544 in 2025. The total market was about 1.05 million in 2021. The in-scope series therefore grew 14.55% in 2023 and less than 1% in 2025. Marqstats forecasts 1,012,000 units in 2030, which is 1.87% a year.
Value is units multiplied by a Marqstats average transaction price. The 2025 customs value of passenger motor vehicle imports was AUD 34,466 million (down 3.6% from AUD 35,758 million in 2024), or about AUD 37,360 per in-scope delivery. A 1.47 factor converts that landed customs value into a showroom transaction price: about 5% for freight and insurance, about 25% for distributor and dealer gross margin and pre-delivery cost, 10% GST, and Luxury Car Tax on the share of vehicles above the threshold. The price is a Marqstats construction, not a published statistic. The result, AUD 55,000 per unit, gives AUD 50.74 billion, or USD 32.73 billion at AUD 1 = USD 0.6451. Marqstats holds the exchange rate constant through 2030 so that the forecast shows market movement rather than currency movement.
The 2030 average transaction price is AUD 59,200, which is 1.48% a year of nominal growth. Two forces offset each other. Mix pushes the average up: plug-in hybrids and premium BEVs carry list prices well above the petrol equivalent, and NVES compliance costs on Type 2 four-wheel-drive wagons get passed to buyers. Competition pulls it down: Chinese-built BEVs and PHEVs entered in volume at prices that undercut legacy hybrids. The net result is AUD 59.91 billion in 2030, or USD 38.65 billion. The gap between the 3.38% value CAGR and the 1.87% unit CAGR is a price-and-mix effect of about 1.5 points, and Marqstats treats the unit path as the primary series because it rests on registrations rather than on margins.
Customs value is a shipment measure, not a delivery measure, so inventory build or run-down in a given year moves it. The 2025 reading came in a year when imports fell 3.6% while in-scope deliveries rose about 0.8%, which suggests distributors ran stock down rather than up. Marqstats sizes the market on the delivery count and uses the import value only to set price, which keeps stock timing out of the headline. The unit count is published. The price is modelled.
The 31,229-unit gap between the two official totals changes every share
Australia publishes two versions of its new-vehicle market, and most commentary mixes them. VFACTS, run by the FCAI, counted 1,209,808 deliveries in 2025, with 733,831 SUVs and 157,484 passenger cars. Tesla and Polestar report through the Electric Vehicle Council instead. Adding them gives 1,241,037 deliveries, 757,697 SUVs and 164,847 passenger cars. The difference is 31,229 units, and almost all of it sits in the passenger and SUV layer: Tesla Model Y alone delivered 22,239 units and ranked tenth among all models.
The consequence is practical. A share of SUVs quoted as 60.7% uses the FCAI-only base; 61.1% uses the combined base. A passenger car decline quoted as 22.6% compares FCAI-only years. Live Marqstats pages on adjacent markets (the Australia and New Zealand electric vehicle market and the Australia SDV market) use the 1,209,808 total. Marqstats sizes the passenger car market on the combined 922,544 base because a BEV-heavy market cannot be measured while leaving out its best-selling BEV maker. Any comparison with those pages should add 31,229 units back before comparing shares.
Electrification is reallocating a flat market rather than enlarging it
The 2026 data show the fastest powertrain shift Australia has recorded, inside a total that did not grow. FCAI-only deliveries to the end of September 2026 were 914,312, against 914,439 a year earlier. Over the same nine months, BEVs took 180,591 light-vehicle sales and 18.9% share, up from 8.1%; petrol fell to 28.2% of the year-to-date light-vehicle market. In September alone, BEVs (26,287) outsold petrol (26,018).
Marqstats reads this as substitution. The Electric Vehicle Council counted 157,957 BEVs and PHEVs in the first half of 2026, a 25.8% share, up from 12.1% in the first half of 2025, with 196 models on sale. EVC chief executive Julie Delvecchio tied the growth to vehicle availability, affordability and cost-of-living pressure. None of that adds a buyer. Not one. It changes what the existing buyer drives away in.
That is why the in-scope market grows faster than the total. In September 2026, FCAI-only SUV sales rose 6.1% and passenger car sales 6.3%, while light commercial sales fell 13.2%. The electrified choice is concentrated in cars and SUVs, and the ute buyer has fewer electric options. Marqstats expects the passenger and SUV layer to lift its share of total deliveries from 74.34% in 2025 to about 78% by 2030, which is the main source of the 1.87% unit CAGR.
NVES splits the passenger market across two compliance classes
The NVES does not follow the VFACTS body categories. Type 1 covers passenger cars and most SUVs. Type 2 covers light commercial vehicles and heavy-duty SUVs, the ladder-frame four-wheel-drive wagons such as the Toyota Prado (26,106 deliveries in 2025) and Ford Everest (26,161). Those two models alone are 52,267 in-scope units that are measured against the looser Type 2 limit of 210 g/km in 2025, falling to 180 g/km in 2026 and 110 g/km in 2029.
The first results were easier than the headline limits suggest. For 1 July to 31 December 2025, the NVES Regulator reported a Type 1 average of 114 g/km against an average target of 144, and a Type 2 average of 199 against 214. Of 59 regulated entities, 40 beat their target and generated 17.2 million NVES units, leaving a potential net surplus of 15.9 million after the 19 entities in deficit. An infringement notice prices each unit of excess at AUD 50, with a maximum civil penalty of AUD 100.
The squeeze comes later. It starts after 2027. A Type 1 limit of 58 g/km in 2029 is about half the 2025 average result, and it is unreachable with petrol and conventional hybrid sales alone. Marqstats therefore models BEVs at 34.0% and PHEVs at 11.0% of in-scope units by 2030. The policy risk is two-sided: on 29 September 2026 shadow energy minister Dan Tehan said a Coalition government would introduce a bill to repeal the New Vehicle Efficiency Standard Act 2024 within 30 days of taking office. Marqstats keeps the legislated path in the forecast, because the law stands and the 2026 shift was led by buyers, not by fines. Fines came second.
Small SUVs, not small cars, are now the entry point
The entry-level Australian new car is a small SUV. Small SUVs rose 10.9% to 202,643 units in 2025, while small cars fell 22.3% to 72,222. The leaders in each tell the story: the Hyundai Kona (22,769) and Chery Tiggo 4 (20,149) against the Toyota Corolla (18,968) and Hyundai i30 (10,688).
This is structural. It is not a cycle. Passenger cars lost 46,514 units between 2023 and 2025 while SUVs gained 78,235. Marqstats forecasts a slower decline from here, to 150,000 passenger cars in 2030, because electric sedans and hatches such as the Tesla Model 3 and BYD Seal give the body style a new reason to exist. Passenger car sales rose 6.3% in September 2026 on that basis.
Market Dynamics
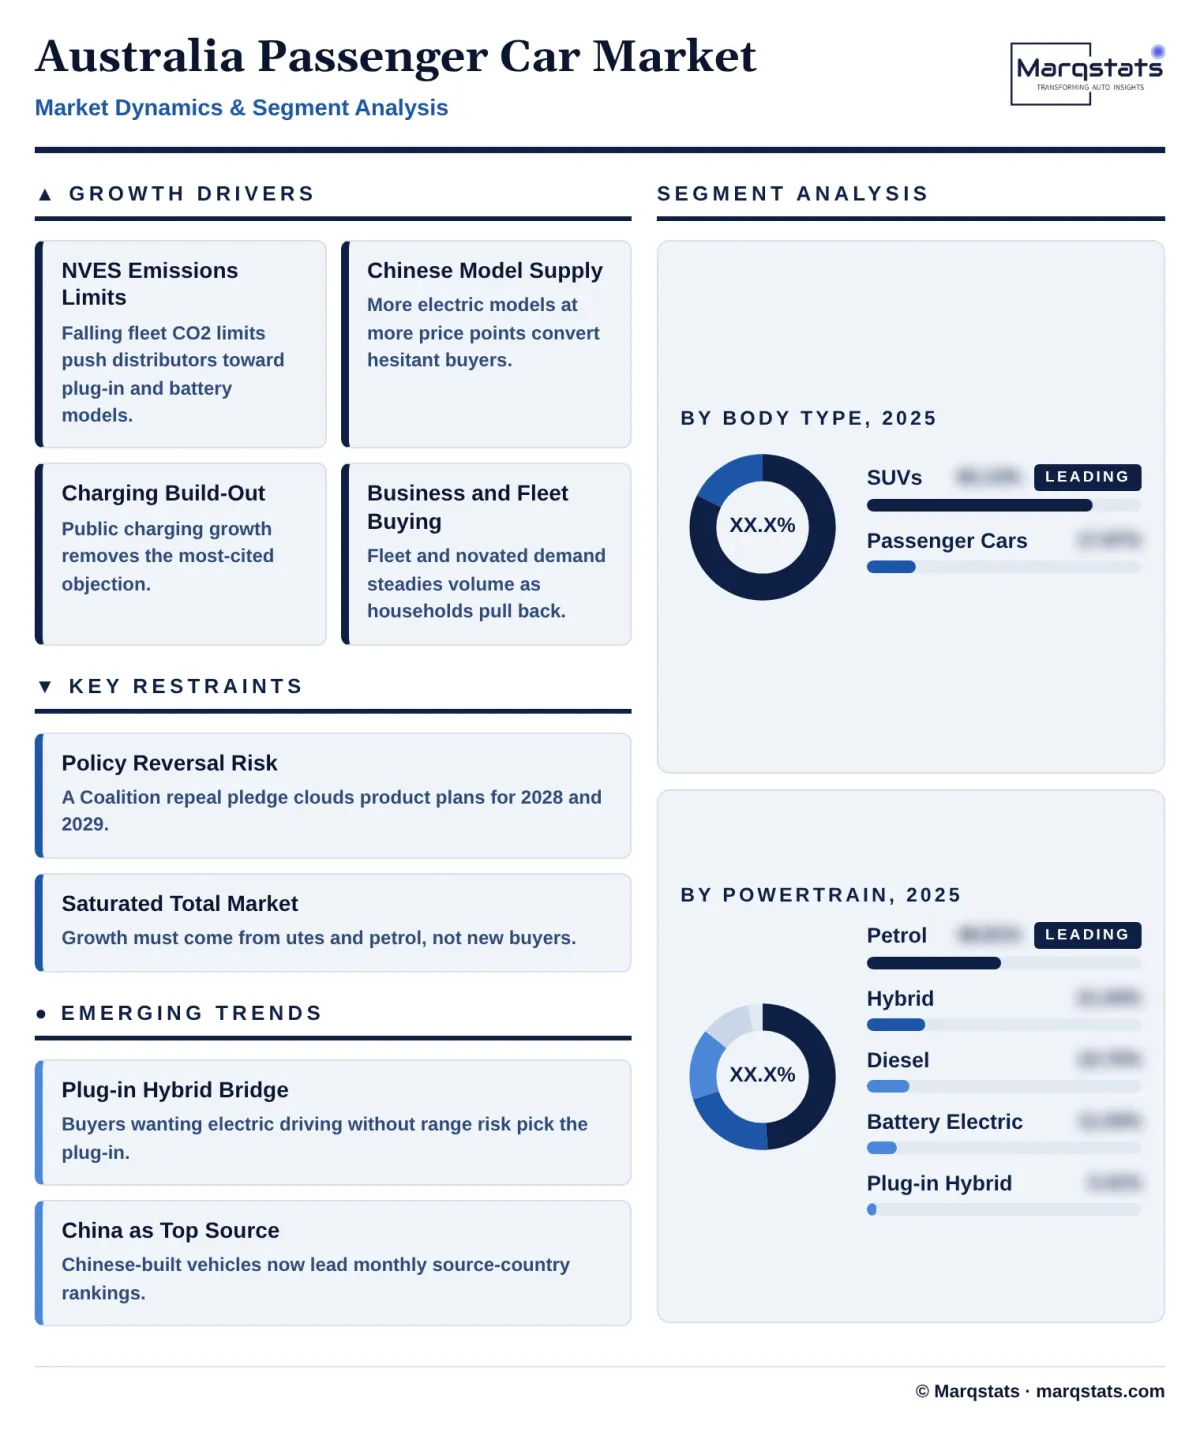
Key Drivers
Four forces lift the value of the market faster than its volume.
- Legislated emissions limits: the NVES Type 1 limit falls from 141 g/km in 2025 to 117 g/km in 2026, 96 in 2027, 75 in 2028 and 58 in 2029, which forces distributors to sell more BEVs and PHEVs every year and raises the average price of what they sell.
- Model supply from China: the EVC counted 196 BEV and PHEV models on sale by mid-2026, up from 153 in 2025, and BYD deliveries rose 156.2% to 52,415 in 2025, taking eighth place among all brands. More choice at more price points converts intenders who had no suitable electric option.
- Charging build-out: public charging reached 4,268 locations and 11,602 connectors by June 2026, up 235% and 175% on June 2025, which removes the most-cited objection outside the capital-city cores.
- Business and fleet buying: business buyers took 460,371 light vehicles in 2025, up 2.2%, while private buyers fell 1.8% to 600,580. Novated leasing and fleet replacement cycles favour SUVs and electrified models, and keep demand steadier than household budgets alone would.
Key Restraints
Three constraints keep the unit growth below 2%.
- Policy reversal risk: the Coalition pledged on 29 September 2026 to repeal the NVES Act within 30 days of taking office, so distributors planning 2028 and 2029 product must hedge between two compliance regimes.
- A saturated total market: FCAI-only deliveries for January to September 2026 were 914,312 against 914,439 in 2025, and the in-scope market can only outgrow that total by taking share from light commercial vehicles.
- Government and private demand softness: government purchases fell 15.3% to 32,916 in 2025 and private purchases fell 1.8%, leaving business and rental channels to carry growth.
Key Trends
Three trends reshape the mix of what is sold.
- Plug-in hybrids as the bridge: PHEV deliveries grew 130.9% to 53,484 in 2025 and a further 122.7% year on year in September 2026, as buyers who want electric driving without range risk pick the plug-in.
- China as the largest source country: Chinese-built vehicles took about 18% of 2025 sales and 35.5% of September 2026 sales, ahead of Japan; Geely entered the monthly top ten brands with 4,473 sales that month.
- Rental fleets as a growing channel: rental registrations rose 3.5% to 70,677 in 2025, one of only two buyer channels to grow, and rental disposals two to three years later shape which drivetrains reach the used market.
Strategic Implications
- For entrants: launch SUVs before sedans and plug-ins before conventional hybrids. The 202,643-unit small SUV segment is the volume entry point, and a PHEV or BEV with a credit surplus is worth more to the importer under NVES than the same car is worth in margin alone.
- For incumbents: the Type 2 four-wheel-drive wagons that carry Toyota, Ford and Isuzu profits are protected only until the 110 g/km limit of 2029. Plan hybrid or plug-in versions of those wagons now, and buy or bank NVES units while the 15.9 million surplus keeps them cheap.
- For dealer groups: franchise value is moving to brands that grew in 2025 (BYD up 156.2%, GWM up 23.4%) and away from brands that fell (Mitsubishi down 17.9%, MG down 18.4%). Review franchise mix against powertrain exposure, not past volume.
- For suppliers and investors: home charging, battery service and tyre and brake demand will follow 344,080 BEVs a year by 2030. Price the policy risk explicitly; the 2026 shift was led by buyers, which makes it harder for a repeal to reverse than a subsidy-led surge would be.
Market Segmentation
SUVs are the market. They delivered 757,697 units in 2025, 82.13% of in-scope volume and USD 26.88 billion of value at the market average price, and Marqstats forecasts 862,000 units and 85.18% share by 2030, a 2.61% CAGR. Small and medium SUVs lead. Growth comes from them, where the Toyota RAV4 (51,947), Hyundai Kona, Mazda CX-5 (22,742), Mitsubishi Outlander (22,459) and Tesla Model Y (22,239) compete.
Large four-wheel-drive wagons grow more slowly. They sit in NVES Type 2 and face the steepest compliance step after 2027, and their buyers tow and travel remote, which keeps the electric share low. The Ford Everest and Toyota Prado were separated by just 55 deliveries in 2025.
Passenger cars delivered 164,847 units in 2025, 17.87% of in-scope volume, and Marqstats forecasts 150,000 units and 14.82% share by 2030, a -1.87% CAGR. The decline slows because electric sedans and hatchbacks now carry a larger share of the remaining body-style buyers, and passenger car sales rose 6.3% in September 2026.
Petrol still leads. It remains the largest drivetrain in 2025 with an estimated 450,281 in-scope units, 48.81% of the market. Marqstats removes about 25,000 petrol vans and utes from the 475,279 light-vehicle petrol total. Petrol falls to 273,240 units and 27.00% share by 2030, a -9.51% CAGR, the steepest absolute loss of any segment.
Conventional hybrids account for an estimated 194,133 units and 21.04% share in 2025, out of 199,133 hybrid light vehicles. Toyota built most of that volume, with the RAV4 sold only as a hybrid. Hybrids reach 212,520 units by 2030 at 21.00% share, a 1.83% CAGR, as NVES limits below 75 g/km push buyers past the hybrid towards the plug-in.
Diesel here means the big wagon. Marqstats estimates 144,876 units and 15.70% share in 2025, after allocating about 219,700 of the 364,605 diesel light vehicles to utes and vans. Diesel falls to 70,840 units and 7.00% by 2030, a -13.33% CAGR, the fastest-falling segment.
BEVs account for an estimated 101,770 in-scope units and 11.03% share in 2025, out of 103,270 BEVs in total, and Marqstats forecasts 344,080 units and 34.00% share by 2030, a 27.59% CAGR. The forecast is not aggressive against 2026 evidence: BEVs already took 18.9% of all light-vehicle sales to September.
PHEVs account for an estimated 31,484 in-scope units and 3.41% share in 2025, after removing the 18,073 BYD Shark 6 utes and about 3,900 other plug-in utes from the 53,484 total. They reach 111,320 units and 11.00% share by 2030, a 28.74% CAGR and the fastest-growing segment, because they suit buyers who tow, travel remote or charge irregularly.
By Geography
New South Wales
New South Wales is the largest market, with 30.42% of deliveries, about 280,579 in-scope units and USD 9.96 billion of value in 2025. Total state deliveries were 367,947, down 0.3%. The state holds share because its buyer mix sits close to the national average. Marqstats allocates in-scope units by each state's share of all VFACTS deliveries, since state totals are not published by body type. The state split remains a construction.
Victoria
Victoria holds 26.76% of deliveries, about 246,891 in-scope units and USD 8.76 billion in 2025, from 323,768 total deliveries (down 1.4%). Victoria lost more volume than New South Wales in 2025, and the allocation applies the same national car-and-SUV ratio to it.
Queensland
Queensland holds 21.48% of deliveries, about 198,190 in-scope units and USD 7.03 billion in 2025, from 259,903 deliveries (down 1.3%). The state skews towards utes and large four-wheel-drive wagons, so the share-based allocation likely overstates its passenger and SUV volume slightly.
Western Australia
Western Australia holds 10.92%, about 100,708 in-scope units and USD 3.57 billion. It was the only one of the five largest states to grow in 2025, up 1.0% to 132,067 deliveries.
South Australia
South Australia holds 6.51%, about 60,098 in-scope units and USD 2.13 billion, from 78,811 deliveries (down 2.4%).
Tasmania, Australian Capital Territory and Northern Territory
The three smallest jurisdictions together hold 3.91%, about 36,078 in-scope units and USD 1.28 billion: Tasmania 15,169 units (19,892 total deliveries, down 2.2%), the ACT 12,900 (16,917, down 3.8%) and the Northern Territory 8,009 (10,503, up 0.6%). The ACT fell fastest of any jurisdiction in 2025.

How Competition Is Evolving
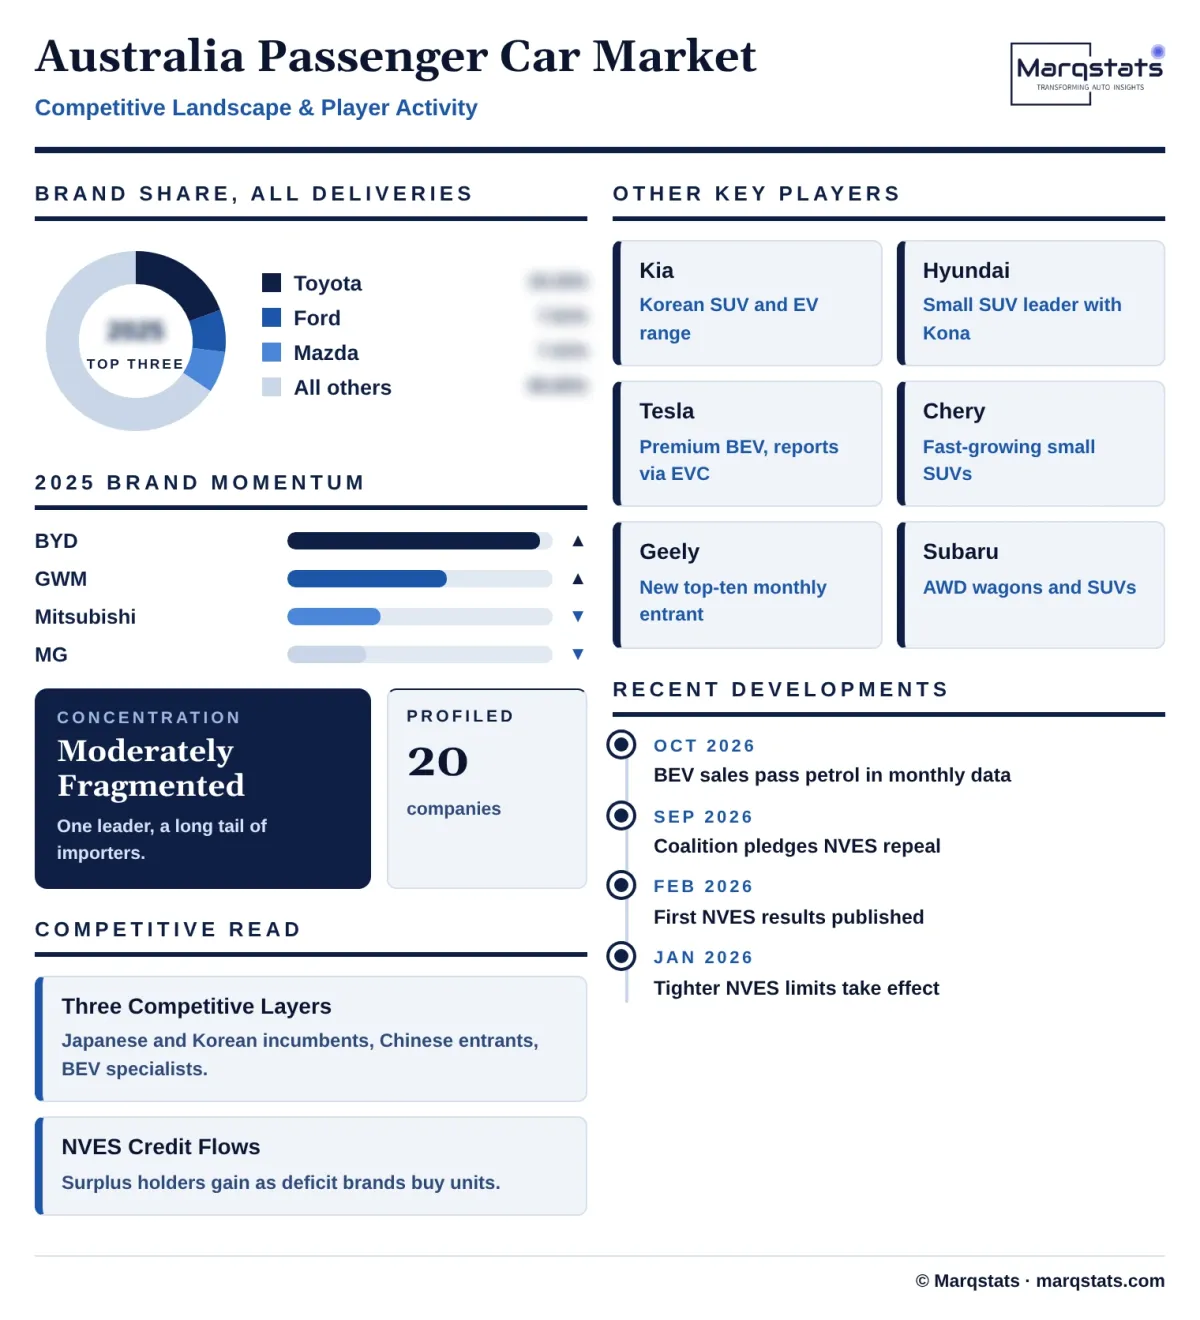
The market is moderately fragmented at brand level and concentrated at the top. Across all 1,241,037 deliveries in 2025, VFACTS shows Toyota at 239,863 units (19.33%), Ford at 94,399 (7.61%) and Mazda at 91,923 (7.41%). Kia (82,105), Hyundai (77,208), Mitsubishi (61,198), GWM (52,809), BYD (52,415), Isuzu Ute (42,297) and MG (41,298) complete the top ten. Those shares include utes and vans; Ford and Isuzu Ute in particular are smaller in the passenger and SUV layer than their totals suggest, and Marqstats does not convert brand totals into in-scope shares.
Competition runs in three layers. Japanese and Korean incumbents (Toyota, Mazda, Kia, Hyundai, Mitsubishi, Subaru, Nissan) own the petrol and hybrid SUV volume and face the hardest NVES transition. Chinese brands (BYD, GWM, MG, Chery, Geely and their sub-brands) grew fastest, with BYD up 156.2% and GWM up 23.4% in 2025, and in September 2026 BYD ranked second among all brands with 8,191 sales. Tesla and Polestar, reporting outside VFACTS, anchor the premium BEV layer; Tesla sold 5,654 units in September 2026 to rank sixth.
The losers of 2025 are as instructive as the winners. Mitsubishi fell 17.9% and MG 18.4%, both brands with ageing ICE line-ups facing newer Chinese plug-ins at similar prices. In the NVES ledger, BYD (4,234,294 units), Toyota (2,890,625) and Tesla (2,212,093) built the largest surpluses in the first performance period, while Mazda, Nissan and Subaru carried interim liabilities. Brand-level unit balances are as reported by the regulator and not independently verified. Credit trading will move money from the second group to the first through 2029.
Companies Covered
Companies covered in the report include:
Recent Market Activity
Table of Contents
Coverage & Segmentation
In scope: new passenger cars (micro, light, small, medium, large and upper large cars, people movers and sports cars) and SUVs of every size delivered in Australia in calendar 2025, counted on the combined FCAI VFACTS and Electric Vehicle Council basis that includes Tesla and Polestar. Value is retail transaction value before on-road costs, inclusive of GST and Luxury Car Tax. Base year 2025, history 2021 to 2025, forecast 2026 to 2030, in USD at a constant AUD 1 = USD 0.6451.
Out of scope: light commercial vehicles including 4x2 and 4x4 utes and vans (273,229 units in 2025), heavy commercial vehicles (45,264 units), motorcycles, used vehicles, grey and personal imports, and aftermarket parts and service. Plug-in utes such as the BYD Shark 6 are excluded even though they appear in the light-vehicle PHEV total.
Boundaries with live Marqstats pages: the Australia and New Zealand Electric Vehicle Market page covers electrified vehicles of all types in both countries and uses the 1,209,808 VFACTS-only total; the Australia SDV Market page values software-defined vehicle content, not vehicles. Do not add the BEV and PHEV units here to the electric vehicle page, and do not add SDV content value to the vehicle value here; each counts a different layer of the same deliveries.