Market Snapshot
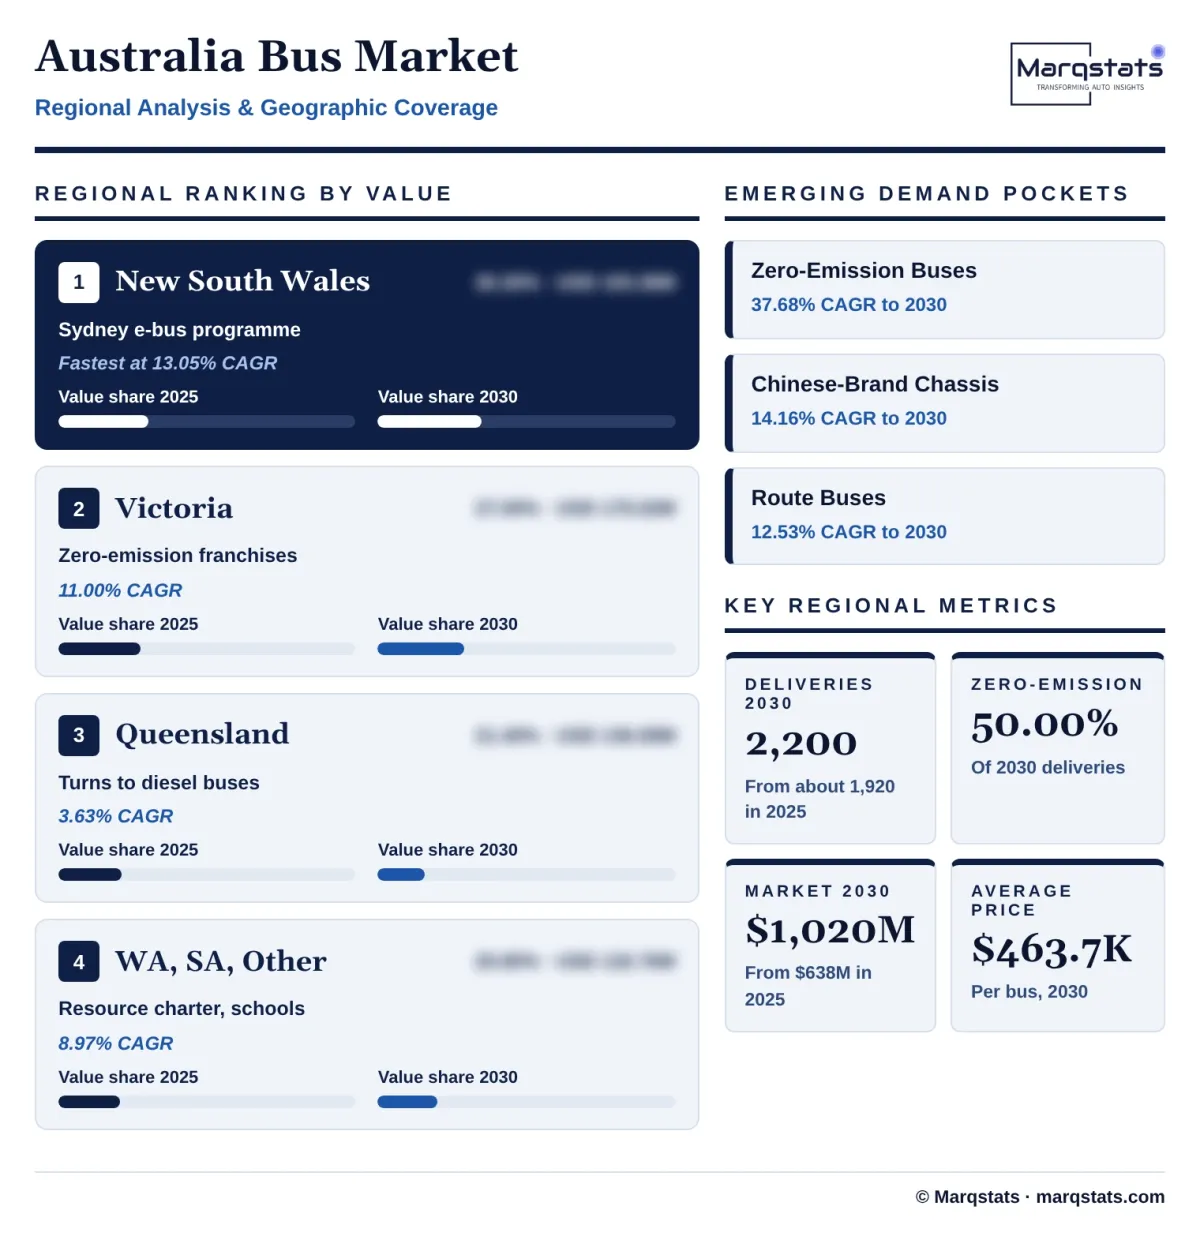
The Australia bus market size is estimated at USD 638.25 million in 2025 and is projected to reach USD 1,020.08 million by 2030, growing at a CAGR of 9.83% over 2026 – 2030. Deliveries rise from about 1,920 to 2,200 buses and coaches, a 2.76% annual rate, while the average value per bus climbs from about USD 332,422 to USD 463,673 as zero-emission buses move from 10.42% to 50.00% of deliveries.
Marqstats defines the market as the value of new buses and coaches delivered in Australia, counted as complete vehicles with chassis, body and Australian Design Rules compliance, in Australian dollars before goods and services tax and converted to US dollars at USD 0.6451 per Australian dollar. It covers heavy route buses, school and regional buses, coaches and bus-type light buses from the Yutong, I-Bus and Challenger ranges, and it excludes van-derived minibuses, used buses, trucks, charging equipment and bus operations.
Route buses account for 59.09% of 2025 value, diesel buses for 76.28% and European chassis for 50.70%. New South Wales accounts for 30.30% of value and also grows fastest, at 13.05% a year, while zero-emission buses grow from USD 134.93 million to USD 667.60 million, a 37.68% CAGR.
Key Takeaways
Market Overview & Analysis
Report Summary
Marqstats sizes the Australia bus market as the value of new buses and coaches delivered to Australian operators each year. It counts heavy route buses, school and regional buses, coaches for touring, charter and resource-sector work, and bus-type light buses, whether the vehicle is a complete bus from one maker or a chassis from Volvo, Scania or MAN bodied by Volgren, BCI Bus or Irizar. Van-derived minibuses, used buses and trucks are excluded.
The fleet is large, ageing and renewed slowly. The Bureau of Infrastructure and Transport Research Economics (BITRE) counted 104,632 registered buses on 31 January 2025, up 2.91% from 101,670 a year earlier. Of these, 55,716 were light buses with a gross vehicle mass of 4.5 tonnes or less and 48,916 were heavy buses above 4.5 tonnes, which grew by only 1,096 vehicles, or 2.29%. The heavy fleet averages 13.13 years of age, and at the 2025 pace of about 1,730 heavy deliveries a year it would take about 28 years to renew.
Deliveries are steady and tracked monthly. Australasian Bus & Coach recorded 1,907 deliveries in 2024, an average of about 159 a month, and Marqstats estimates 1,920 for 2025, in line with the 1,907 of 2024. Monthly deliveries in 2026 were 155 in January, 147 in February, 199 in March, 158 in April, 153 in May and 152 in June, 964 in the half year, and the January, May and June counts were 3.18% to 5.49% below the same months of 2025.
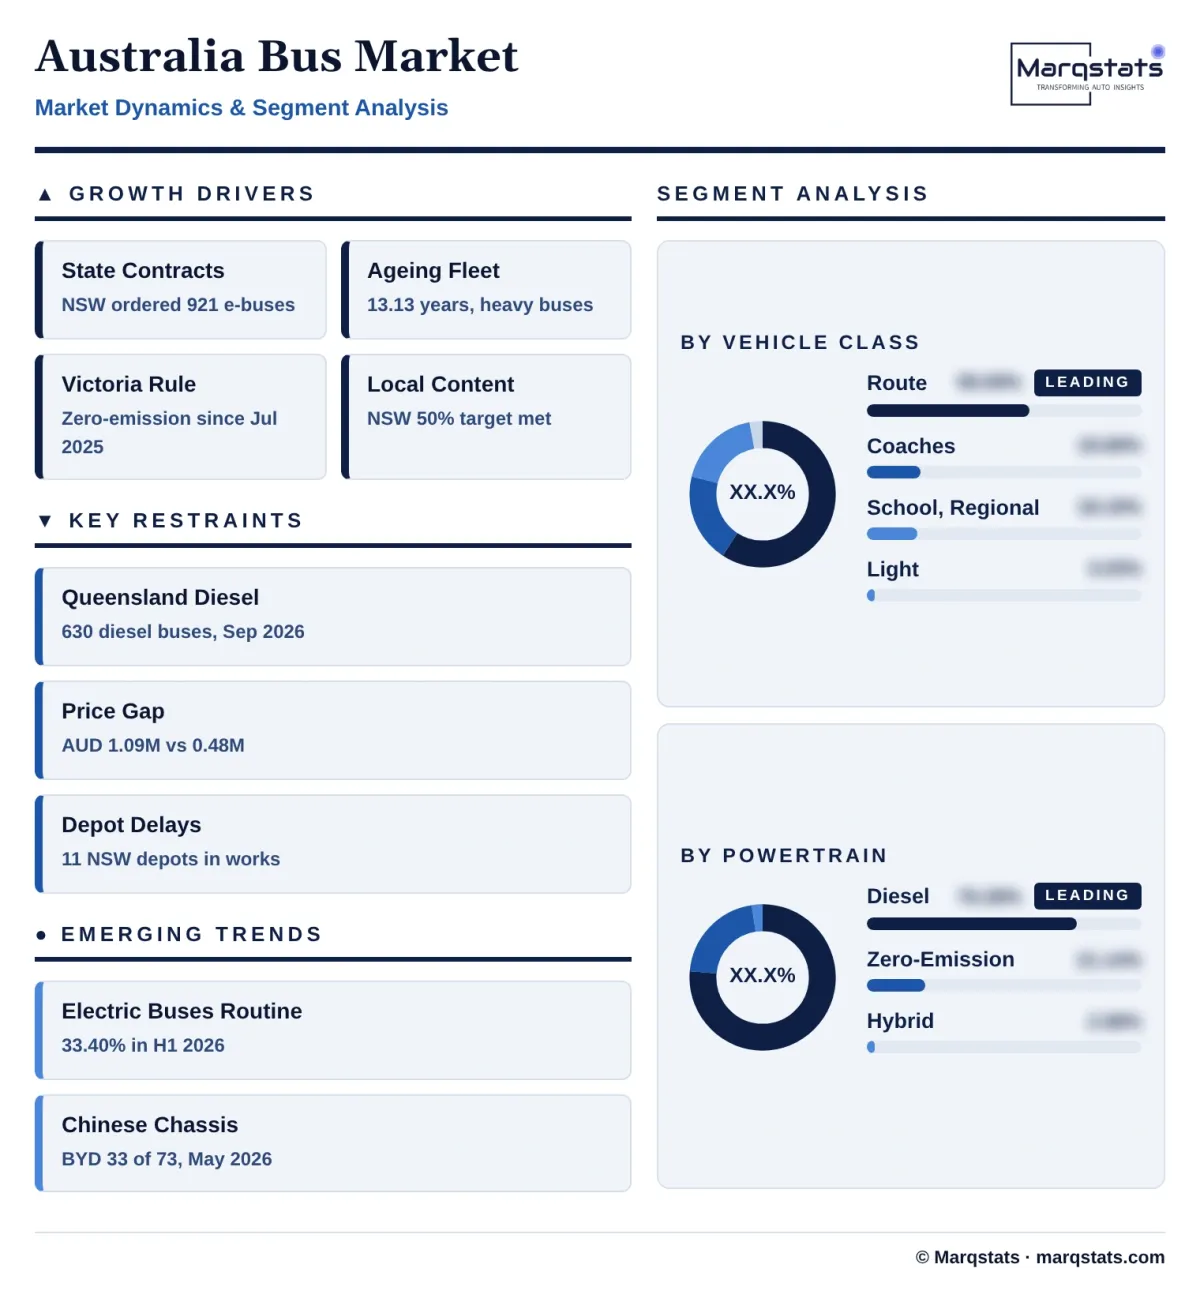
The mix is changing faster than the volume. Marqstats estimates 200 zero-emission buses in 2025, 10.42% of deliveries, against 322 of 964, or 33.40%, in the first half of 2026. Policy is the cause: New South Wales had ordered 921 electric buses since March 2023, Victoria has required all new public transport buses to be zero-emission since 1 July 2025, and Queensland reversed course in September 2026 with an order for 630 diesel buses.
The market is valued at USD 638.25 million in 2025, equal to AUD 989.38 million at USD 0.6451 per Australian dollar, and Marqstats expects 1,920 buses at an average of about AUD 515 thousand each. Diesel buses supplied 87.50% of units and 76.28% of value in 2025, hybrids 2.08% of units and zero-emission buses 10.42% of units and 21.14% of value.
Australia Bus Market Size and Forecast
The Australia bus market grows from USD 638.25 million in 2025 to USD 1,020.08 million in 2030, a CAGR of 9.83%. Price and mix contribute most of the growth: deliveries rise at 2.76% a year, from about 1,920 to 2,200 buses, while the average value per bus rises at 6.88% a year, from about USD 332,422 to USD 463,673, as electric route buses replace diesel ones. The year 2026 is the steepest, with value up 19.06% to USD 759.92 million on 1,840 buses and 590 zero-emission buses.
The 2025 value is built bottom-up from classes, powertrains and prices. Marqstats estimates about 990 route buses, 440 school and regional buses, 300 coaches and 190 light buses. Diesel route buses are priced at about AUD 480,000, school and regional buses at AUD 400,000, coaches at AUD 640,000 and light buses at AUD 150,000, all before goods and services tax. A zero-emission route bus is priced at about AUD 1,085,100, or USD 700,000, which values the 180 route buses at USD 126.00 million, the figure used in the live Marqstats Australia Electric Bus report.
The base is checked against fleet and delivery records. BITRE counts 48,916 heavy buses and 55,716 light buses on 31 January 2025, and the heavy fleet grew by 1,096 buses in the year to that date. About 1,730 heavy deliveries in 2025 equal 3.54% of the heavy fleet, which fits a fleet that averages 13.13 years of age. The 55,716 light buses on the register are mostly van-derived minibuses, which this market excludes, so the 190 bus-type light buses delivered in 2025 are measured against the delivery register and not against that fleet.
Zero-emission buses add value faster than volume. Marqstats expects zero-emission deliveries to rise from 200 in 2025 to 590 in 2026 and 1,100 in 2030, a 40.63% annual rate, so their share of units grows from 10.42% to 50.00%. A zero-emission route bus costs about 2.26 times a diesel route bus, so zero-emission buses reach 65.44% of value in 2030 while diesel buses fall to 32.51%. Prices of zero-emission buses are assumed to fall 1.78% a year, in line with the 8.6% fall over the forecast period used in the live Marqstats report, while diesel prices rise 2.00% a year.
Marqstats tracks four indicators to monitor the forecast: monthly deliveries and the zero-emission count reported by Australasian Bus & Coach, awards under the Victorian Metropolitan Zero Emission Bus Franchise 2 tender, the New South Wales delivery pace against its target of about 1,700 electric buses in service by 2028, and the pace at which Queensland converts its 630-bus diesel order into deliveries.
Market Dynamics
Key Drivers
Five forces are lifting demand for new buses and coaches in Australia even as state policy pulls in different directions.
- State contracts set the market. Buses in Australia are bought mainly to fulfil state franchises, so New South Wales, Victoria, Queensland and Western Australia decide volumes and powertrains. New South Wales alone has ordered 921 electric buses since March 2023, including 151 announced on 28 August 2025, and plans about 1,700 electric buses in service in Greater Sydney by 2028.
- An old fleet needs replacing. The Bureau of Infrastructure and Transport Research Economics (BITRE) put the average age of heavy buses at 13.13 years in January 2025, and 48,916 heavy buses are on the register. Renewal at the 2025 pace takes about 28 years, so every year of delay widens the replacement backlog and sustains deliveries near 2,000 a year.
- Victoria has made every new public bus zero-emission. Under its roadmap, all new public transport buses bought from 1 July 2025 are zero-emission, and the first third of the Melbourne network was awarded in September 2024 with 131 public routes and more than 230 school services. The second tender, covering about 800 buses, opened in late September 2026.
- Local content rules favour Australian bodybuilders. New South Wales said its 151-bus order would surpass its 50% local manufacturing target, which keeps Custom Denning in St Marys and Volgren in Victoria busy and gives imported chassis from Volvo, Scania and Yutong a route into state contracts through local bodies.
- Chinese makers have widened supply. BYD delivered 33 of the 73 zero-emission buses in May 2026 and 21 of the 72 in April, and Yutong supplied 57 chassis in January 2026, so state tenders now draw bids from several makers, which supports volume and price competition.
Key Restraints
Four constraints hold deliveries near 2,000 a year and slow the move to zero-emission buses outside two states.
- Queensland has reversed its electric plans. The Queensland Government announced at the start of September 2026 that it would buy 630 new diesel buses, and the Transport and Main Roads Minister, Brent Mickelberg, dismissed electric buses as a big paperweight. That removes one of the three large states from the zero-emission path and puts about a third of a year of national deliveries into diesel.
- Electric buses cost about twice as much. Marqstats estimates a zero-emission route bus at about AUD 1,085,100 against AUD 480,000 for a diesel route bus, so budgets that fund 100 diesel buses fund about 44 electric ones. Operators in states without a mandate, and school and charter buyers, therefore keep buying diesel.
- Depots and grid connections lag vehicle deliveries. New South Wales is converting 11 existing depots, including Leichhardt and Kingsgrove for the 151-bus order, and is building a Macquarie Park facility for about 165 buses with construction running from late 2025 to 2027. A bus that arrives before its depot sits idle, which makes operators cautious about order timing. Battery weight adds a second constraint, because heavier electric buses depend on mass exemption notices issued by the National Heavy Vehicle Regulator (NHVR), such as the Victoria Class 3 2-Axle Bus Mass Exemption Notice.
- Delivery volumes are flat. Deliveries were 155 in January 2026 against 164 a year earlier, 153 in May against 160 and 152 in June against about 157, so the market is running 3.18% to 5.49% below 2025 in the months reported. Growth comes from price and mix, not from more buses.
Key Trends
Four shifts are changing who builds, bodies, powers and buys buses in Australia.
- Zero-emission buses are moving from trial to routine. Monthly zero-emission deliveries rose from 9 of 155 in January 2026 to 45 in February, 72 in April and 73 in May, and the first half of 2026 reached 322 of 964 deliveries, or 33.40%, against 10.42% in 2025.
- Local bodies on imported electric chassis are becoming the standard. Volgren launched the Optimus body on the Yutong E12 electric chassis in October 2024 with a 350 kilowatt-hour battery, a range of up to 360 kilometres and room for up to 71 passengers, using an aluminium body built in Victoria.
- Chinese brands are entering every class. Yutong, BYD, King Long, Zhongtong, Odin and BLK all appeared in the 2026 delivery tables, and Marqstats expects Chinese-brand chassis to rise from 33.33% to 40.00% of units by 2030, helped by lower prices and fast delivery.
- Policy is diverging by state. Victoria and New South Wales commit to electric fleets while Queensland returns to diesel, so route bus buyers face three different rule sets and manufacturers plan production by state, not by national average.
Strategic Implications
- For chassis makers, state alignment matters more than national share. Volvo and Scania hold the largest positions in diesel and in contracted route work, but BYD and Yutong won most of the electric deliveries named in the May 2026 table, so European makers need electric platforms priced to compete in New South Wales and Victoria while keeping diesel supply for Queensland.
- For bodybuilders, local content is the moat. Volgren built 567 bodies in 2024, 29.73% of deliveries, and New South Wales is counting local content in its 50% target, so bodybuilders that can fit electric chassis from several makers keep their share as chassis imports grow.
- For operators, the first decision is the depot. A bus order should follow a grid connection plan, and operators in Victoria and New South Wales that book connections early avoid the idle time that depot delays cause on 151-bus orders.
- For financiers and lessors, the residual value of electric buses is the open question. A bus that costs about AUD 1,085,100 against AUD 480,000 for diesel needs a clear second-life market, and the 13.13-year age of the heavy fleet shows that buyers expect long service lives.
- For energy and infrastructure providers, the depot is the product. About 1,700 electric buses planned in Sydney by 2028 and about 800 buses in the Victorian tender require charging, grid upgrades and energy management on contract timelines, which creates demand for depot-as-a-service offers.
Market Segmentation
Route buses are heavy low-floor buses for urban and outer-urban timetabled services, including articulated models, and they account for 59.09% of 2025 value, USD 377.13 million. Value grows at 12.53% a year to USD 680.45 million as 180 zero-emission route buses in 2025 become 900 in 2030, supplied mainly by Volgren-bodied Volvo, Yutong and BYD chassis and by Custom Denning.
School and regional buses are high-floor rigid buses built to the occupant protection requirements of Australian Design Rule 68, and they account for 18.19% of 2025 value, USD 116.12 million. Value grows at 5.98% a year to USD 155.24 million. Marqstats estimates about 440 units a year, mostly diesel, because route lengths and charging access in regional areas limit electric adoption until the late forecast years.
Coaches for interstate touring, charter and resource-sector work account for 19.69% of 2025 value, USD 125.69 million, and grow at 4.55% a year to USD 157.03 million. About 300 units were delivered in 2025, led by Irizar, Scania, Volvo and MAN-based coaches, and diesel and hybrid powertrains stay dominant because long ranges outrun current charging networks.
Bus-type light buses from Yutong, I-Bus and Challenger account for 3.03% of 2025 value, USD 19.31 million, and grow at 7.22% a year to USD 27.36 million. About 190 units were delivered in 2025 to school, community and airport shuttle operators, and electric light buses rise from 8 to 50 units by 2030.
Diesel buses account for 76.28% of 2025 value, USD 486.83 million, and shrink at 7.39% a year to USD 331.58 million, with their share of value falling to 32.51%. Deliveries fall from 1,680 to 1,055 units because Victoria and New South Wales stop buying them, but the segment remains the base for school, regional, coach and Queensland route buying.
Hybrid buses account for 2.58% of 2025 value, USD 16.49 million, and grow at 4.85% a year to USD 20.90 million. About 40 units were delivered in 2025, mainly Scania hybrid models, a niche that serves operators who want lower fuel use without depot charging.
Zero-emission buses, which combine battery-electric and fuel cell buses, account for 21.14% of 2025 value, USD 134.93 million, and grow fastest, at 37.68% a year, to USD 667.60 million and 65.44% of the market. Deliveries rise from 200 to 1,100 units, of which fuel cell buses are 5 in 2025 and 25 in 2030, and the route bus class takes about 81.82% of the 2030 volume.
European chassis from Volvo, Scania, MAN and similar makers account for 50.70% of 2025 value, USD 323.59 million, and grow at 9.89% a year to USD 518.56 million. Volvo and Scania delivered 934 of the 1,907 buses recorded in 2024, 48.98%, and they supply the chassis for most Volgren-bodied route buses and for premium coaches.
Chinese-brand chassis from Yutong, BYD, King Long, Zhongtong, Odin and BLK account for 28.31% of 2025 value, USD 180.71 million, and grow fastest, at 14.16% a year, to USD 350.40 million and 34.35% of the market. Yutong alone supplied 326 chassis in 2024, 17.09% of deliveries, and BYD supplied 33 of the 73 zero-emission buses in May 2026.
Buses built in Australia or by other makers, including Custom Denning, BCI Bus, Challenger and I-Bus, account for 20.99% of 2025 value, USD 133.95 million, and grow at 2.44% a year to USD 151.12 million. BCI Bus delivered 142 chassis and 203 bodies in 2024, and Custom Denning builds electric buses in St Marys, New South Wales, which supports the state local content target.
By Geography
New South Wales
New South Wales accounts for 30.30% of 2025 value, USD 193.38 million, and grows fastest, at 13.05% a year, to USD 357.03 million and 35.00% by 2030. The state holds 14,507 of the 48,916 heavy buses, 29.66%, has ordered 921 electric buses since March 2023 and plans about 1,700 in service by 2028 and replacement of more than 8,000 diesel and gas buses by 2047. Marqstats estimates about 520 deliveries in 2025.
Victoria
Victoria accounts for 27.50% of 2025 value, USD 175.52 million, and grows at 11.00% a year to USD 295.82 million and 29.00% by 2030. It was the largest delivery state in 2024 with 547 buses, 28.68%, holds 10,345 heavy buses and requires all new public transport buses to be zero-emission. Its Metropolitan Zero Emission Bus Franchise 2 tender covers about 800 buses, equal to 41.67% of national deliveries in 2025.
Queensland
Queensland accounts for 21.40% of 2025 value, USD 136.59 million, and grows slowest, at 3.63% a year, to USD 163.21 million and 16.00% by 2030. It took 503 buses in 2024, 26.38%, and holds 10,141 heavy buses. The September 2026 decision to buy 630 diesel buses lowers value per bus and shifts the state from an electric to a diesel buyer, although volume stays steady.
Western Australia, South Australia and Other
Western Australia, South Australia and the smaller jurisdictions account for 20.80% of 2025 value, USD 132.76 million, and grow at 8.97% a year to USD 204.02 million. In 2024 Western Australia took 327 buses, South Australia 68, the Australian Capital Territory 29, the Northern Territory 9 and Tasmania 7. Together the five hold 13,923 heavy buses, 28.46% of the fleet, and resource-sector charter work in Western Australia supports coach demand.
How Competition Is Evolving
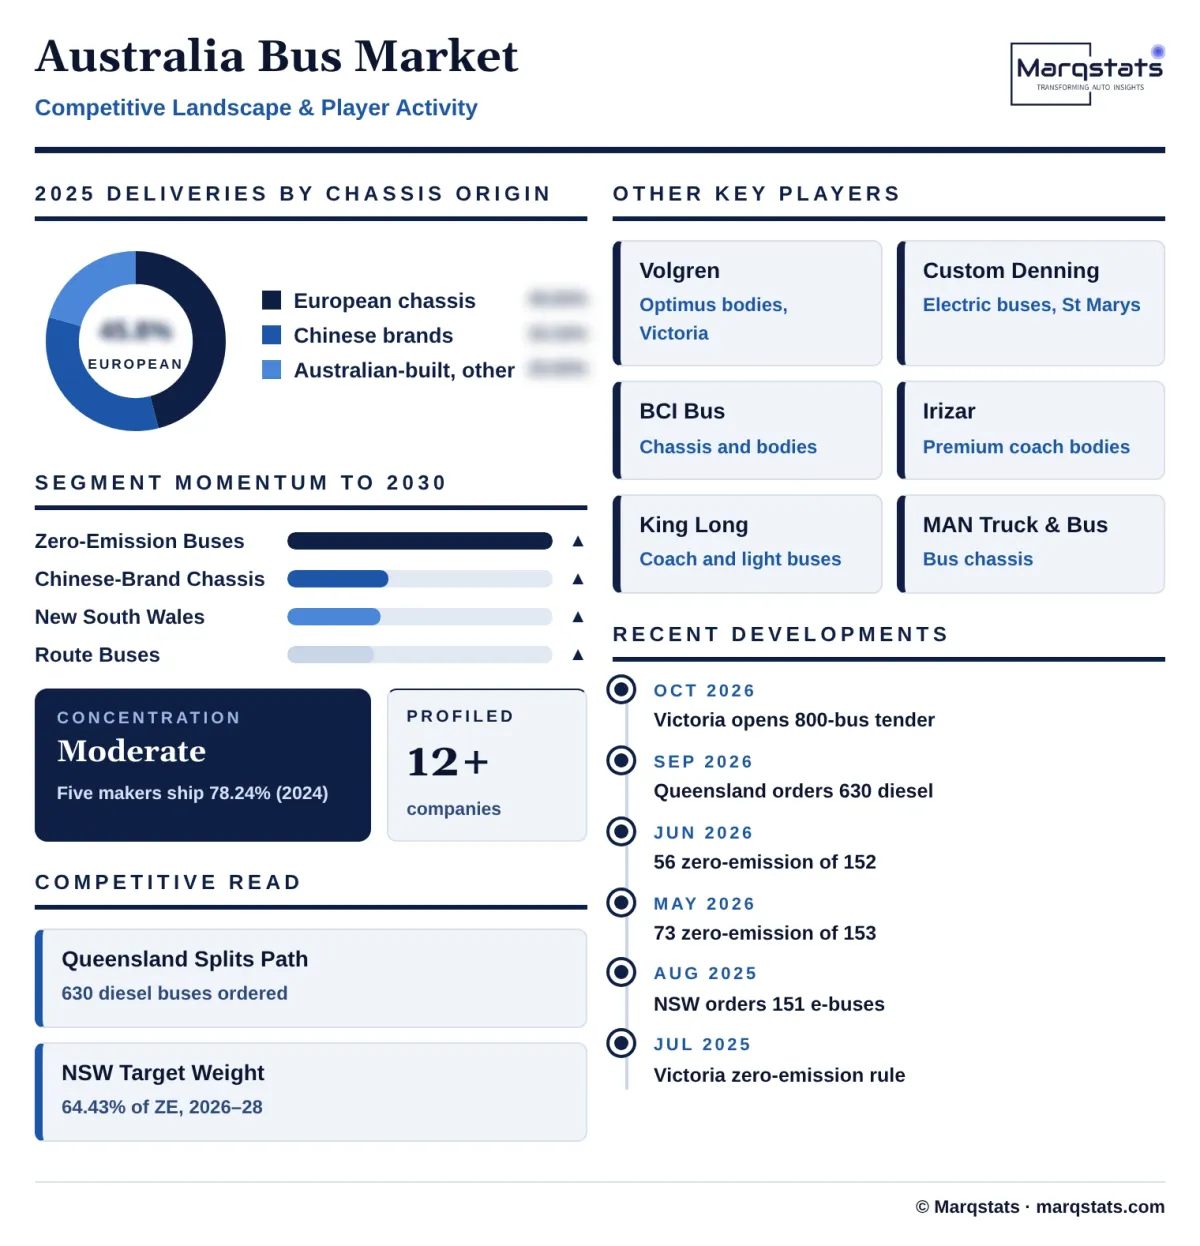
The market is moderately concentrated and built in two layers, chassis and body. Volvo, Yutong, Scania, BCI Bus and I-Bus supplied 1,492 of the 1,907 chassis recorded in 2024, 78.24%, with Volvo at 33.51%, Yutong at 17.09%, Scania at 15.47%, BCI Bus at 7.45% and I-Bus at 4.72%. Volgren built 567 bodies, 29.73%, followed by Yutong with 325, BCI Bus with 203, Irizar with 183 and Custom Denning with 108.
Chinese makers are gaining share in the electric segment. BYD delivered 21 of the 72 zero-emission buses in April 2026 and 33 of the 73 in May 2026, Yutong delivered 11 and Volvo 9 in May, and Scania, Custom Denning and Odin completed the list. Marqstats estimates Chinese-brand chassis at 33.33% of 2025 deliveries and 40.00% in 2030, with European chassis falling from 45.83% to 45.45%.
Local bodybuilders protect their position through state rules. Volgren, a division of Marcopolo S.A., bodies Volvo and Yutong chassis and launched the Optimus body on the Yutong E12 in October 2024, while Custom Denning in St Marys was named by the New South Wales Government as an Australian manufacturer in the 151-bus order of 28 August 2025. Irizar delivers premium coach bodies and BCI Bus supplies both chassis and bodies.
Competition is shifting from product to delivery and depot readiness. With deliveries flat at about 150 to 160 a month, makers win share by committing electric chassis to state tenders, by matching the New South Wales 50% local content target and by helping operators with charging, so the Victorian Franchise 2 tender and the Queensland diesel order will show which makers can serve both policy tracks.
Companies Covered
Companies covered in the report include:
Recent Market Activity
Table of Contents
Coverage & Segmentation
The study covers the Australia bus market, with 2025 as the base year, 2021 – 2025 as the historical period and 2026 – 2030 as the forecast period. It covers new buses and coaches delivered in Australia, imported complete or built from imported chassis with Australian bodies, segmented by vehicle class, powertrain, chassis origin and state. Values are the value of complete vehicles in Australian dollars before goods and services tax, converted at USD 0.6451 per Australian dollar, the 2025 average.
Vehicles must meet the Australian Design Rules for omnibuses, including Australian Design Rule 68 on occupant protection, and the Euro VI emissions standard under Australian Design Rule 80/04, which applied to new heavy vehicle models from 1 November 2024 and to all new vehicles from 1 November 2025. Van-derived minibuses, used buses, trucks, trailers, charging equipment, depot works and bus operations are excluded. The live Marqstats Australia Electric Bus report counts only transit-specification zero-emission buses, 180 in 2025 at USD 126.00 million, and those buses sit inside the route bus and zero-emission segments of this market, so the two figures should not be added. Australian heavy truck markets are a separate study and are disjoint from this one.