Market Snapshot
Key Takeaways
Market Overview & Analysis
Report Summary
West Africa has an industrial policy problem rather than an industrial capacity problem, and the two figures that prove it sit beside each other in the same regional report. More than 100,000 units of assembly capacity exist. Fewer than 10,000 vehicles are built. More than 450,000 are imported, predominantly used. Every strategic question in this market follows from that arrangement.
The measure is the cross-border vehicle import flow into the Economic Community of West African States, predominantly used and grey-market vehicles, treated as a floor rather than as a complete retail volume. Locally assembled output is carried alongside it as the substitute the regional framework is built to grow, because an import series without an assembly series has no policy context and an assembly series without an import denominator has no scale.
The analysis is written for importers and logistics operators assessing port and corridor flows, assemblers and manufacturers evaluating whether utilisation can be improved before capacity is added, component suppliers screening a localisation opportunity that barely exists today, and policymakers measuring the regional framework against its own targets. It treats utilisation rather than nameplate as the variable that matters.
West Africa Used Vehicle Market Size and Forecast
Regional vehicle imports are estimated at 430,000 units in 2025, rising to approximately 455,000 in 2026 and 535,000 by 2031. The 2026 figure is anchored directly to regional trade body reporting of more than 450,000 vehicles imported annually, predominantly used and grey, with 2025 back-cast modestly against trade conditions.
Two growth rates apply and both are published. The six-year rate connecting 2025 and 2031 is 3.71%. The five-year rate connecting 2026 and 2031 is 3.29%, and the 0.42-point gap is among the narrowest in this research programme, because a regional import flow is a slow function of population, replacement need and affordability rather than of any policy or capacity event.
The figure should be read as a minimum import-flow anchor rather than as a complete retail market volume. It counts cross-border arrivals and excludes repeat domestic transactions entirely, which means the number of used vehicle sales actually occurring across the region is materially higher than 430,000 and is not observable from any regional source.
The 2031 forecast assumes continued demand growth with partial substitution by local assembly. That substitution is modelled conservatively: even at a 44.22% compound rate for assembly output, imports still supply the substantial majority of regional vehicle supply in 2031, because the starting positions differ by a factor of more than fifty.
Import value moves from approximately USD 2,795 million to USD 3,852 million across the forecast, on a disclosed per-vehicle convention rising from about USD 6,500 to USD 7,200. Value compounds at 5.49% against 3.71% for units, because age and quality mix improves as duty structures fall and financing gradually reaches a market that has been almost entirely cash-based.
Capacity Exists, Utilisation Does Not
The regional trade body reported in August 2026 that West Africa has seven semi knocked-down vehicle assembly plants with combined installed capacity above 100,000 units a year while actual regional output remains below 10,000 units. That is an implied utilisation of approximately 8%, and it is the single most important structural fact about vehicle manufacturing in this region.
Set against the import flow, locally assembled output of about 8,000 units is 1.86% of the 430,000 vehicles arriving from outside the region. The substitute exists, is licensed, is built and is idle, which makes this a commercial and policy failure rather than an industrial capability gap.
The largest national instance is more extreme still. Nigeria's automotive council reports 40 licensed assembly plants with installed capacity above 600,000 vehicles a year operating at about 5% utilisation, which means national capacity alone exceeds the entire regional import flow while producing roughly 30,000 vehicles.
The two capacity figures are not the same measure and should not be reconciled carelessly. The regional count of seven plants above 100,000 units refers to semi knocked-down assembly operations recognised in the regional framework; the national count of 40 plants above 600,000 units refers to licensed facilities regardless of operating status. Both are reported by their own institutions and both describe idle capacity at roughly a tenth or less of nameplate.
The 2028 Target and What the Forecast Implies
The Regional Automotive Policy Framework sets a target of 50,000 locally assembled vehicles annually by 2028. Against output below 10,000 units today, that requires a 6.25-fold increase within roughly two years from a base that has not moved materially in several.
Assembly output is forecast at approximately 8,000 units in 2025 rising to 72,000 by 2031, a compound rate of 44.22%. On that path output reaches about 24,000 units in 2028, which is roughly 48% of the regional target. The forecast therefore assumes the 2028 objective is missed by approximately half and achieved about three years late.
Publishing a forecast that falls short of a published policy target is more useful than adopting the target as a forecast. The target describes an intention supported by a framework whose implementation remains uneven across member states; the forecast describes what utilisation improvement, announced projects and demand growth plausibly deliver.
Even on the optimistic path, assembly reaches 13.46% of regional vehicle flow by 2031 against 1.86% today. That is a genuine transformation of a manufacturing base and still leaves imported vehicles supplying more than six in seven of the vehicles West Africa acquires.
Announced Projects and the Scale Problem
Nigeria signed a memorandum of understanding in February 2026 with a South Korean economic development body for a phased electric vehicle manufacturing plant and nationwide charging infrastructure, designed to progress from assembly to full in-house production with planned capacity of approximately 300,000 vehicles and around 10,000 jobs.
The scale of that single announcement relative to everything that exists is the point. At 300,000 units of planned capacity it would be three times the region's entire existing installed capacity of more than 100,000 units and 37.5 times current regional output of about 8,000 vehicles. It would also be six times the regional framework's own 2028 target.
Announcements of that magnitude are why the forecast here is built on output rather than on capacity. A region that already holds more than 100,000 units of idle nameplate does not have a capacity problem that a 300,000-unit project solves, and treating announced capacity as future output would produce a forecast several times larger than any plausible demand.
Ghana's Foreign Minister announced in June 2026 that the country would host a Hyundai automotive production facility following discussions at a Korea-Africa ministerial meeting, adding a second national assembly anchor alongside Nigeria. Ghana, Côte d'Ivoire and Senegal show measurable policy progress, and a second credible hub changes the regional distribution of assembly even if it does not change the aggregate quickly.
Utilisation Is Already Improving Where Products Exist
Dangote Peugeot Automobiles Nigeria began local production of the Peugeot 3008 and 5008 at its Kaduna plant in April 2026, expanding the number of locally assembled models. It is a small volume against a 430,000-unit import flow and it is the most meaningful kind of development in this market, because it demonstrates active utilisation of existing industrial capacity rather than the announcement of new capacity.
The consulting implication follows directly from the arithmetic. The biggest opportunity in West African vehicle manufacturing is utilisation rather than greenfield nameplate, because more than 100,000 units of installed capacity already exists against below 10,000 units of output, and filling existing lines requires product programmes, supplier access and demand rather than land and construction.
Supplier localisation remains limited across the region, which means component and import logistics opportunities accompany assembly growth rather than following it. A plant raising utilisation immediately raises kit import volumes, and the logistics and clearance capability serving that flow is available before any local component manufacturing becomes viable.
Why Used Imports Keep Winning
The used vehicle price advantage is the principal risk to every assembly forecast in this region, and Nigerian fiscal policy has just widened the affordability of imports rather than narrowing it. Nigeria announced duty reductions in April 2026 effective from July, cutting passenger vehicle duty from 70% to 40%, eliminating the 5% import duty on buses and reducing the duty on electric vehicles from 5% to zero.
Nigeria Customs separately reduced import adjustment levies from 20% to 10% on new vehicles and from 15% to 5% on used vehicles alongside a Green Tax Surcharge. Because Nigeria is the region's largest demand centre, its landed-cost structure has spillover effects on cross-border pricing, sourcing and the direction of regional flows.
National duties, age limits, roadworthiness rules and customs practices remain decisive and differ by member state, which means country-level import policy can redirect flows between ports and neighbouring markets rapidly. A regional framework promoting local assembly coexists with national fiscal measures making imports cheaper, and that tension is the structural reason utilisation has not improved.
For an investor the conclusion is uncomfortable and worth stating plainly. Plant feasibility in this region should be tested against country-specific demand, export access and used-vehicle competition rather than against regional population, because the competing product is a functioning vehicle landed at a fraction of an assembled one's cost.
Where the Investable Opportunity Sits
Inspection, certification, spare parts, logistics and finance can be more investable than direct used vehicle retail in several countries across this region. Those pools attach to a 430,000-unit annual arrival flow and to the far larger domestic transaction volume that flow feeds, and they do not require competing on the vehicle margin that fragmentation has already compressed.
Port and corridor positions are the most defensible of these. Used vehicle flows are fragmented across ports, importers and informal networks, with Nigeria, Ghana, Côte d'Ivoire and Senegal operating as the principal gateways and demand centres, and a clearance, inspection or logistics capability at a major gateway serves flows that policy can redirect but not eliminate.
Financing is the pool with the most structural headroom and the clearest policy alignment. It is the constraint that national automotive authorities identify as critical, it would shift buyers toward newer used or locally assembled vehicles more effectively than tariff measures have, and it is the only intervention that helps assemblers and importers simultaneously.
Market Dynamics
Key Drivers
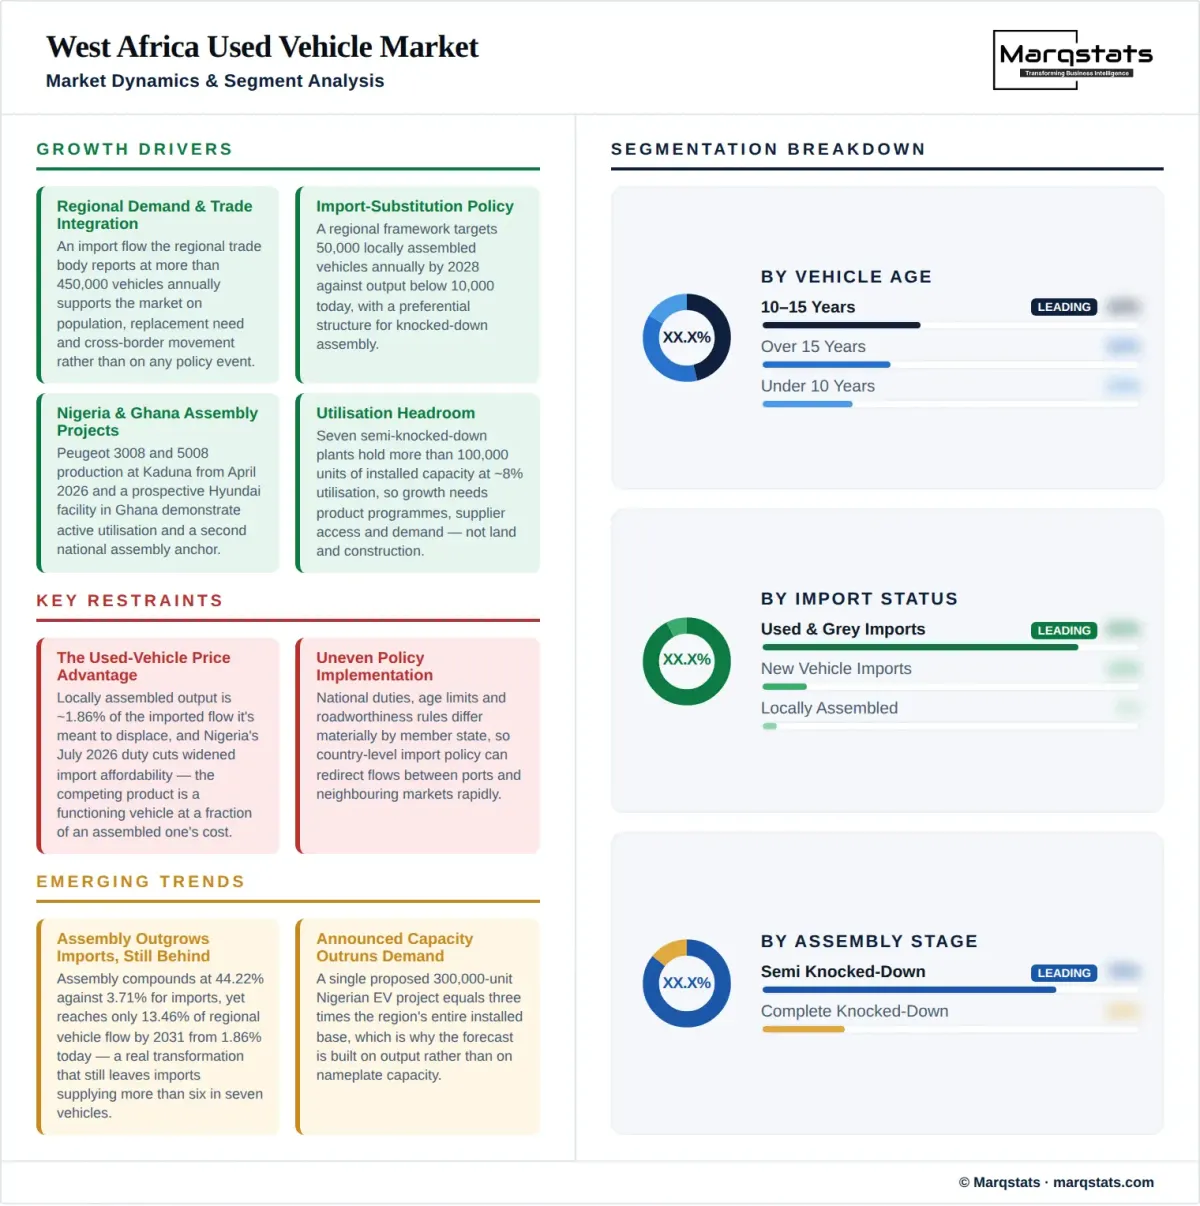
- Regional demand growth and trade integration supporting an import flow the regional trade body reports at more than 450,000 vehicles annually.
- Import-substitution policy under a regional framework targeting 50,000 locally assembled vehicles annually by 2028 against output below 10,000 today.
- Nigeria and Ghana assembly projects, including Peugeot 3008 and 5008 production at Kaduna from April 2026 and a prospective Hyundai facility in Ghana.
- Utilisation improvement across seven semi knocked-down plants holding more than 100,000 units of installed capacity at approximately 8% utilisation.
- Falling landed costs in the largest demand centre, with Nigerian passenger vehicle duty cut from 70% to 40% and bus duty eliminated from July 2026.
Key Restraints
- The used vehicle price advantage, with locally assembled output at about 1.86% of the imported flow it is intended to displace.
- Uneven policy implementation across member states, with national duties, age limits and roadworthiness rules differing materially.
- Low plant utilisation, with regional output below 10,000 units against installed capacity above 100,000.
- Limited local supplier depth and financing, which keeps assembled vehicles dependent on imported kits and therefore on the same foreign exchange exposure as imports.
Key Trends
- Assembly outgrowing imports at 44.22% against 3.71% while still reaching only 13.46% of regional vehicle flow by 2031.
- Announced capacity outrunning plausible demand, with one proposed 300,000-unit project equal to three times the region's entire installed base.
- A second assembly hub emerging in Ghana alongside Nigeria, with Côte d'Ivoire and Senegal showing measurable policy progress.
- Value outpacing volume at 5.49% against 3.71% as duty reductions and gradual financing access improve the age and quality mix.
Market Segmentation
The dominant category within a 430,000-unit annual import flow and the one most affected by Nigerian duty reductions that cut passenger vehicle duty from 70% to 40% from July 2026. Passenger vehicles are also where locally assembled models compete most directly, including the Peugeot 3008 and 5008 programmes started at Kaduna in April 2026.
Vans, pickups and light trucks serving distribution and small business use across a region importing more than 450,000 vehicles a year. These buyers weigh running cost and parts availability above age, which makes them the group most reachable by assembly programmes competing on parts network rather than on price.
Heavy vehicles and passenger transport, where Nigeria eliminated the 5% import duty on buses entirely from July 2026. Bus procurement is frequently institutional and grant-linked rather than retail, which makes it the category where policy can move volumes fastest in either direction.
The predominant component of the more than 450,000 vehicles the regional trade body reports arriving annually, and the reason the regional framework exists. Grey channels operate alongside formal importers across fragmented port and informal networks, and neither is separately quantified in any regional source.
A minority of the import flow, concentrated in institutional, corporate and government purchasing. Nigerian levy reductions from 20% to 10% on new vehicles improved this channel's landed cost, though the parallel cut from 15% to 5% on used vehicles preserved the relative advantage used imports already held.
Approximately 8,000 units in 2025, or about 1.86% of the imported flow, produced across seven semi knocked-down plants at roughly 8% of installed capacity. This segment grows at 44.22% to reach 72,000 units and 13.46% of regional vehicle flow by 2031, which is transformative for the manufacturing base and still leaves imports dominant.
The youngest and smallest band of an import flow historically shaped by landed costs that put newer vehicles out of reach. Nigerian duty moving from 70% to 40% and the used levy from 15% to 5% from July 2026 brings this band within reach of buyers in the region's largest demand centre for the first time.
The volume core of the West African import flow, balancing purchase price against remaining service life across a 430,000-unit annual arrival. It is the band where national age limits bite most variably, because member states set different thresholds and a vehicle admissible in one market is excluded from its neighbour.
The oldest cohort, sustained by the lowest landed costs and an extensive informal repair economy, and the band most exposed to tightening roadworthiness and emissions rules. It is also the cohort that locally assembled output at about 1.86% of regional flow cannot compete against on price under any plausible cost structure.
The largest gateway serving the region's largest demand centre, where national vehicle demand is reported near 800,000 units with 85% to 90% met by used imports. Nigerian customs policy therefore sets landed-cost expectations that propagate across neighbouring markets regardless of their own tariff schedules.
A significant gateway and increasingly an assembly destination, with a prospective Hyundai production facility announced in June 2026 adding to an existing vehicle assembly presence. Ghana's dual role as import gateway and manufacturing hub makes its policy choices unusually informative for the region.
Important entry points and demand centres within a regional flow exceeding 450,000 vehicles annually, both showing measurable progress under the regional automotive framework. Their tariff and age-limit decisions determine how much traffic diverts toward or away from the larger Nigerian and Ghanaian gateways.
Cross-border movement of vehicles cleared at one port and registered in another, which is why country-level import policy can redirect flows between ports and neighbouring markets rapidly. This channel is the reason the regional figure of more than 450,000 is a flow floor rather than a sum of national retail markets.
The stage describing all seven recognised regional plants, with combined installed capacity above 100,000 units producing below 10,000. It requires the least local capability and delivers the least local value addition, which is why raising utilisation at this stage is achievable long before deeper localisation is.
A deeper stage requiring more local operations and tooling, exemplified by model programmes such as the Peugeot 3008 and 5008 started at Kaduna in April 2026. It carries higher local content and higher fixed cost, which makes it viable only where a product programme can secure sustained volume.
The stage the regional framework is designed to reach, in which component manufacturing follows vehicle assembly. Supplier depth across the region is currently limited, so a proposed project such as the 300,000-unit Nigerian electric vehicle programme progressing from assembly to full in-house production would require a supplier base that does not yet exist.
By Geography
Nigeria
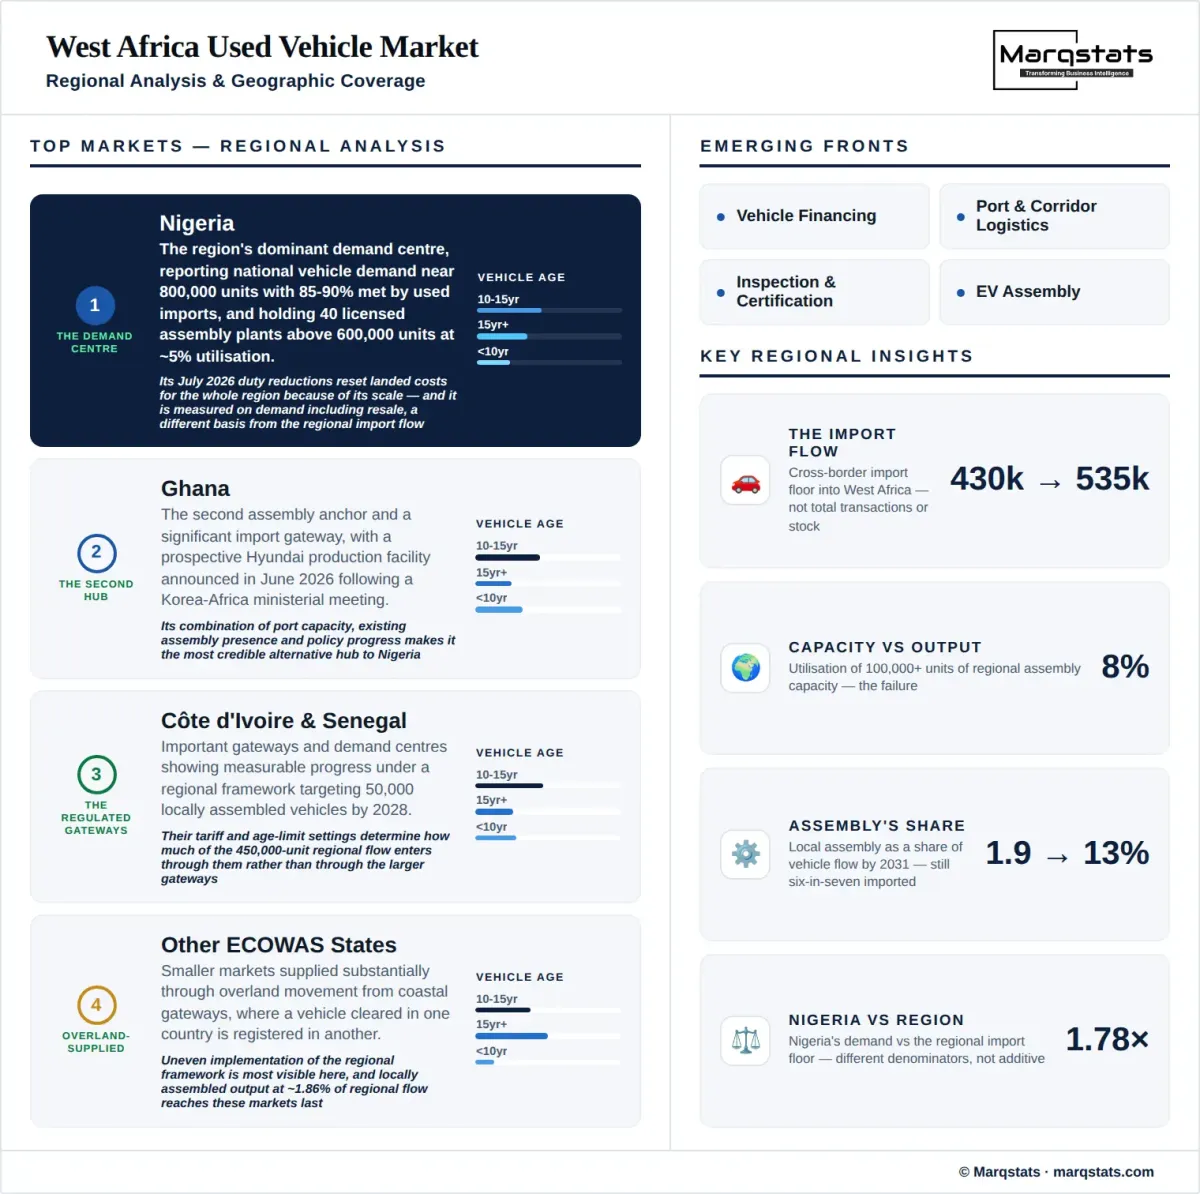
The region's dominant demand centre, reporting national vehicle demand near 800,000 units with 85% to 90% met by used imports, and holding 40 licensed assembly plants above 600,000 units of capacity at about 5% utilisation. Its July 2026 duty reductions reset landed costs for the whole region because of its scale.
Ghana
The second assembly anchor and a significant import gateway, with a prospective Hyundai production facility announced in June 2026 following a Korea-Africa ministerial meeting. Ghana's combination of port capacity, existing assembly presence and policy progress makes it the most credible alternative hub to Nigeria.
Côte d'Ivoire and Senegal
Important gateways and demand centres showing measurable progress under a regional framework targeting 50,000 locally assembled vehicles by 2028. Their tariff and age-limit settings determine how much of the more than 450,000-unit regional flow enters through them rather than through the larger gateways.
Other ECOWAS Member States
Smaller markets supplied substantially through overland movement from coastal gateways, where a vehicle cleared in one country is registered in another. Uneven implementation of the regional framework is most visible here, and locally assembled output at about 1.86% of regional flow reaches these markets last.
How Competition Is Evolving
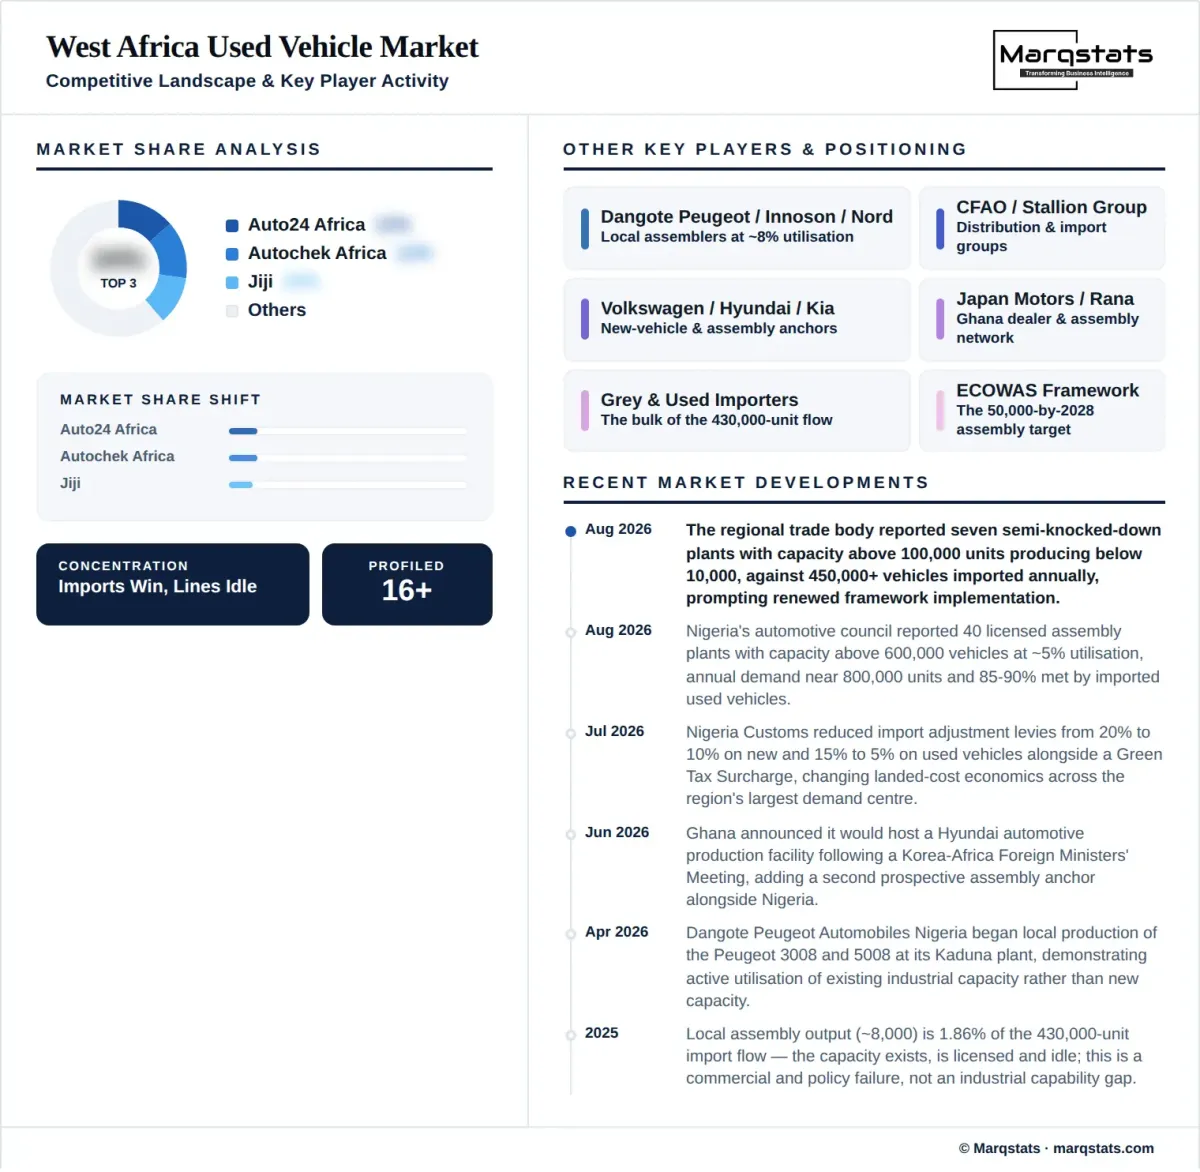
The used vehicle side of this market is fragmented across ports, importers, dealers and informal networks with no participant large enough to influence regional pricing, and the assembly side is concentrated in a handful of licensed operators running below 10,000 units combined. Those are two entirely different competitive structures sharing one demand base.
Nigerian assemblers hold the largest share of a small output, including Dangote Peugeot Automobiles Nigeria producing the 3008 and 5008 at Kaduna from April 2026, alongside Innoson, Nord and Stallion-linked operations. Their competition is not each other but the 430,000 imported vehicles arriving annually at a fraction of assembled cost.
International manufacturers are positioning through partnerships rather than through wholly owned capacity. A prospective Hyundai facility in Ghana, Peugeot programmes in Nigeria and Chinese, European and Korean manufacturers evaluating regional footprints all reflect a judgement that the regional framework will eventually raise the cost of importing relative to assembling.
Digital used vehicle marketplaces operating across multiple West African markets have changed price discovery without consolidating the trade, which compresses dealer margin and shifts advantage toward inspection, certification, warranty and financing capability rather than toward inventory access.
For an investor the defensible positions are the ones policy cannot eliminate. Port and corridor logistics, inspection and certification, parts distribution and vehicle finance all attach to a flow that tariff changes redirect rather than remove, while assembly economics depend entirely on whether the regional framework is implemented at a pace its own 2028 target already suggests it will miss.
Companies Covered
The report profiles 15+ companies with full strategy and financials analysis, including:
Recent Market Activity
Table of Contents
Coverage & Segmentation
This study measures the annual cross-border vehicle import flow into West Africa from 2021 to 2031, with 2025 as the base year and 2026 to 2031 as the forecast period, predominantly used and grey-market vehicles. It is an import-flow floor and not total used vehicle transactions or installed stock, so repeat domestic resales are excluded and the number of used vehicle sales occurring across the region is materially higher.
Locally assembled output is carried alongside the import series as the substitute the regional framework exists to grow, and it absorbs the separate West Africa Automotive Assembly title from the research pack. Coverage spans three vehicle types, three import statuses, three vehicle age bands, four entry gateways and three assembly stages, alongside four country clusters. Import value is carried as a reference series in USD on a disclosed per-vehicle convention. Fifteen entities are profiled across assemblers, distributors and marketplaces.