Market Snapshot
Key Takeaways
Market Overview & Analysis
Report Summary
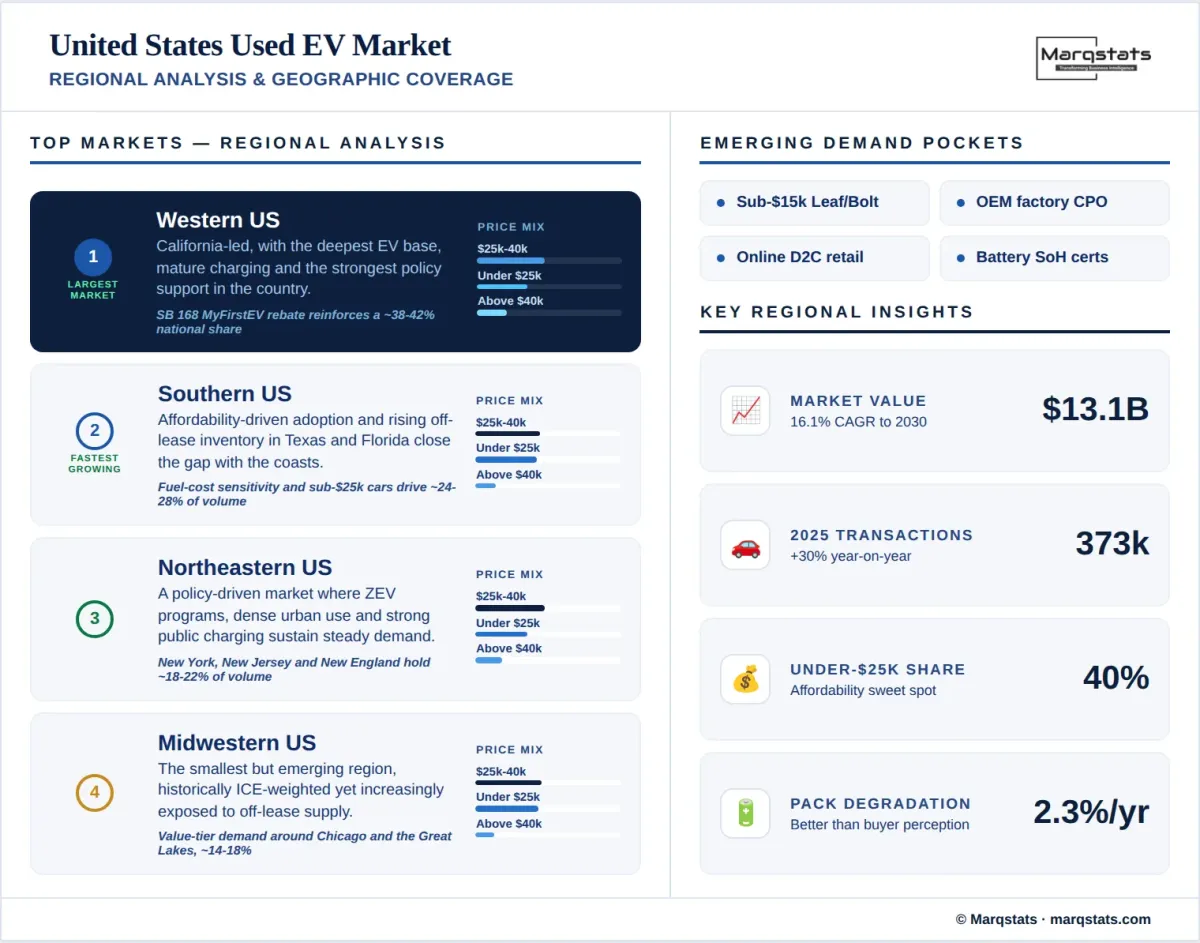
The United States used EV market comprises second-hand passenger vehicles powered by battery-electric or plug-in hybrid drivetrains and resold through franchised dealers, original-equipment certified pre-owned (CPO) programs, independent used-car dealers, and online retail platforms. Valued at an estimated USD 13.10 billion in gross transaction value in 2025 on roughly 373,000 units, the market has grown from a niche of about 65,000 transactions in 2020 into a structured, inventory-led segment. The defining change is not consumer awareness—it is the arrival of predictable, professionally sourced supply.
The market’s current state is best described as supply-led and affordability-driven. Cheaper than comparable new electric vehicles and increasingly competitive with used internal-combustion cars on total cost of ownership, late-model used EVs are turning quickly on dealer lots. The most strategically important price band remained under USD 25,000 through September 2025 because that was the threshold for the federal used-EV tax credit; roughly 40% of used EVs sold beneath it. Although that federal incentive has since lapsed, state programs such as California’s newly enacted SB 168 "MyFirstEV" continue to subsidize sub-USD 25,000 used electric cars.
Pricing has been the market’s most volatile variable. Average used-EV listing prices moved from about USD 35,400 in January 2026 to a spring low near USD 34,700 before rebounding above USD 38,000 by June 2026 as affordable inventory turned faster and fuel-cost pressure improved EV consideration. The lesson for operators is that U.S. used-EV depreciation is no longer only a technology story; it is a pricing-discipline story in which used values react almost immediately to new-vehicle incentives, fuel prices, and battery-confidence signals.
The supply picture is the market’s most structural feature. Because leasing became the dominant acquisition method for new EVs—more than 50% in late 2024 and over 56% by the third quarter of 2025—used-EV inventory growth is effectively pre-programmed three to four years in advance. EVs represented only about 5% of U.S. lease maturities in 2025 but are expected to more than double in 2026 and could approach 23% of maturities by 2028. This converts the used-EV market from ad-hoc trade-ins into a structured off-lease pipeline with more consistent condition, mileage, title quality, and financing eligibility—precisely the attributes that make an inventory class financeable and scalable. The counterweight is residual-value risk: lessors and captive finance arms now shoulder greater exposure if used-EV supply outruns demand, which is why remarketing sophistication and battery certification have moved to the center of the market’s economics.
Trust infrastructure is the market’s emerging differentiator. Battery state-of-health is now the decisive variable in used-EV valuation because it determines both functional range and financing confidence. The underlying durability news is encouraging—large-scale telematics analysis of more than 22,000 electric vehicles found average pack degradation of only about 2.3% per year—yet buyer perception still lags the data. In response, battery scores have begun appearing on major U.S. vehicle listings, and independent state-of-health certificates can now be produced in minutes, turning battery condition into a merchandised, priced attribute rather than a hidden risk. Repairability and insurance remain frictions, with EV repair costs running about 25% higher and repair times about 14% longer than for comparable gasoline vehicles, though both are improving as workshops gain EV familiarity. For operators, battery diagnostics, transferable warranties, and insurer-approved repair pathways are shifting from optional add-ons to baseline requirements.
Market Dynamics
Key Drivers
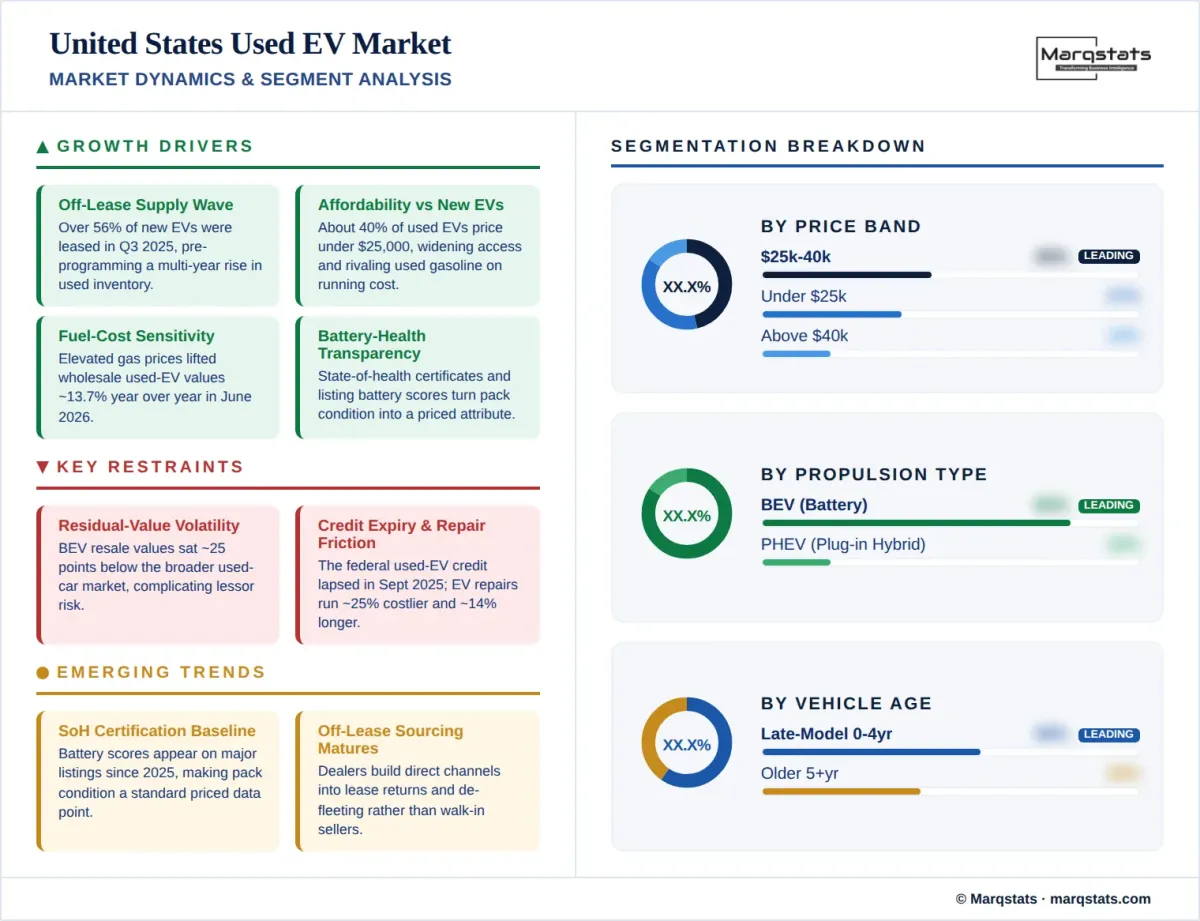
Off-lease supply wave: more than 50% of new U.S. EVs were leased in late 2024 and over 56% in Q3 2025, pre-programming a multi-year rise in late-model used-EV inventory as leases mature between 2026 and 2028.
Affordability versus new EVs: with about 40% of used EVs priced under USD 25,000, used electric cars widen access to households priced out of new EVs and increasingly rival used gasoline models on running costs.
Fuel-cost sensitivity: elevated retail gasoline prices through the first half of 2026 lifted used-EV consideration and value retention, with wholesale used-EV prices up about 13.7% year over year in June 2026.
Widening model choice and OEM-backed CPO: a deeper roster of used nameplates—Tesla Model 3 and Model Y, Nissan Leaf, Chevrolet Bolt, Ford Mustang Mach-E—plus expanding factory-certified programs improves buyer trust and financing eligibility.
Battery-health transparency: independent state-of-health certificates and battery scores on vehicle listings convert battery condition from a hidden risk into a priced, merchandised attribute that speeds transactions.
Key Restraints
Residual-value volatility: used-EV values fell sharply after 2023 new-vehicle price cuts and, by late 2025, battery-electric resale values sat roughly 25 percentage points below the broader used-car market, complicating lessor and dealer risk management.
Expiry of the federal used-EV tax credit in September 2025 removed a direct affordability subsidy, leaving demand more exposed to sticker price, interest rates, and fuel costs.
Battery-health anxiety: despite average pack degradation of only about 2.3% per year, buyer uncertainty over range loss and out-of-warranty replacement cost still suppresses demand for older, higher-mileage electric vehicles.
Higher insurance and repair friction: EV repair costs have run about 25% higher and repair times about 14% longer than for comparable gasoline vehicles, raising total-cost-of-ownership perceptions and write-off risk on damaged units.
Key Trends
Battery state-of-health certification is becoming baseline merchandising: SoH scores began appearing on major U.S. used-vehicle listings in 2025, making pack condition a standard, priced data point.
The off-lease pipeline is professionalizing sourcing: dealers and remarketers are building direct channels into lease returns, rental de-fleeting, and franchised trade-ins rather than relying on walk-in sellers.
Online and direct-to-consumer used-EV retail continues to gain share, though battery and warranty complexity still favor professional sellers over pure peer-to-peer transactions.
State-level incentives and fuel-price hedging are replacing federal subsidies as swing demand factors, with programs such as California’s SB 168 and gas-price spikes steering buyers toward pre-owned electric cars.
Market Segmentation
Battery-electric vehicles are the volume center of gravity of the United States used EV market, reflecting Tesla, Inc.’s dominance of the U.S. installed EV base and the prominence of affordable used nameplates such as the Nissan Leaf, Chevrolet Bolt, Tesla Model 3, and Tesla Model Y. BEVs also drive the segment’s pricing signals, since Tesla’s new-vehicle price moves cascade quickly into used values. Battery state-of-health and transferable warranties are the decisive trust variables within this segment.
Plug-in hybrids form a meaningful but secondary share of used-EV inventory. They appeal to buyers in regions with weaker charging access and to those seeking a transitional electrified option without range anxiety. PHEV used values tend to be steadier than BEVs because they are less exposed to fast-charging and battery-degradation concerns, but the volume opportunity remains smaller than the BEV pool.
The sub-USD 25,000 band is the most strategically important affordability tier and accounts for roughly 40% of used-EV sales. It anchors first-time EV ownership, led by used Nissan Leafs near USD 12,000 and older Chevrolet Bolts, and remains the primary target of state incentives such as California’s SB 168. Supply below USD 15,000 is still thin, leaving the lower-income household segment only partly electrified.
The USD 25,000–40,000 band is the largest transactional tier by value and captures the bulk of late-model off-lease inventory—two-to-four-year-old Tesla Model 3 and Model Y, Ford Mustang Mach-E, and similar vehicles. These units carry the best combination of remaining battery warranty, condition, and financing eligibility, and they turn fastest on dealer lots.
The above-USD 40,000 band covers premium and large-format used electric vehicles, including luxury sedans and electric trucks and SUVs. Demand is thinner and more discretionary, and this tier has absorbed some of the steepest depreciation, with certain premium and luxury EVs shedding more than 60% of value over five years.
Zero-to-four-year-old vehicles are the fastest-growing and most liquid age cohort, fed directly by the off-lease wave. These late-model electric cars typically retain the bulk of their original battery warranty—often structured around eight years and roughly 70% capacity retention—so a certified four-year-old used EV can behave commercially more like a nearly-new vehicle than a conventional used car. This cohort commands the strongest financing terms and the fastest lot turn.
Vehicles aged five years and older are more price-sensitive and more exposed to battery-health scrutiny, since remaining warranty coverage shortens and range loss becomes a sharper concern. This cohort anchors the sub-USD 25,000 affordability tier—epitomized by used Nissan Leafs—but depends heavily on independent battery certification to convert value-focused buyers who lack manufacturer-backed reassurance.
Franchised dealers and manufacturer-backed CPO programs command the trust-sensitive end of the market, bundling inspection, transferable battery warranty, and financing. Original-equipment manufacturers are actively expanding factory-certified used channels to retain buyers and defend residual values, making this the fastest-professionalizing channel for late-model electric vehicles.
Independent dealers move a large share of value-tier and older used EVs, competing on price and inventory breadth. Battery-health certification and warranty wraps are increasingly essential for this channel to convert price-sensitive buyers who lack OEM-certified reassurance.
Online-first retailers continue to gain share by pooling national demand and simplifying the purchase, delivery, and financing experience. Electric and plug-in hybrid vehicles have grown as a share of these retailers’ unit sales, though battery and warranty complexity still favors professional, inspection-backed sellers over pure peer-to-peer transactions.
By Geography
While this report scopes the national United States used EV market, demand and supply are unevenly distributed across the four U.S. census regions. The shares below are Marqstats directional estimates based on EV registration density, charging-infrastructure maturity, and state policy.
Western United States
The West—led by California—is the largest regional used-EV market, reflecting the deepest EV installed base, mature charging infrastructure, and the strongest policy support in the country. California’s SB 168 "MyFirstEV" rebate, offering up to USD 1,750 off used EVs priced under USD 25,000, reinforces the region’s lead. Marqstats estimates the West accounts for roughly 38–42% of national used-EV transactions.
Southern United States
The South is the fastest-growing region, propelled by affordability-driven adoption, rising off-lease inventory in large metro markets such as Texas and Florida, and heightened fuel-cost sensitivity. As sub-USD 25,000 electric cars proliferate, the region is closing the adoption gap with the coasts and is estimated to contribute around 24–28% of national volume.
Northeastern United States
The Northeast is a policy-driven market where state zero-emission programs, dense urban usage, and strong public-charging access support steady used-EV demand across New York, New Jersey, and the New England states. Marqstats estimates the region represents roughly 18–22% of national used-EV transactions.
Midwestern United States
The Midwest is the smallest but emerging regional market, historically weighted toward internal-combustion vehicles yet increasingly exposed to off-lease EV supply and value-tier demand around metros such as Chicago and the Great Lakes corridor. The region is estimated at about 14–18% of national volume, with growth tracking charging build-out.
How Competition Is Evolving
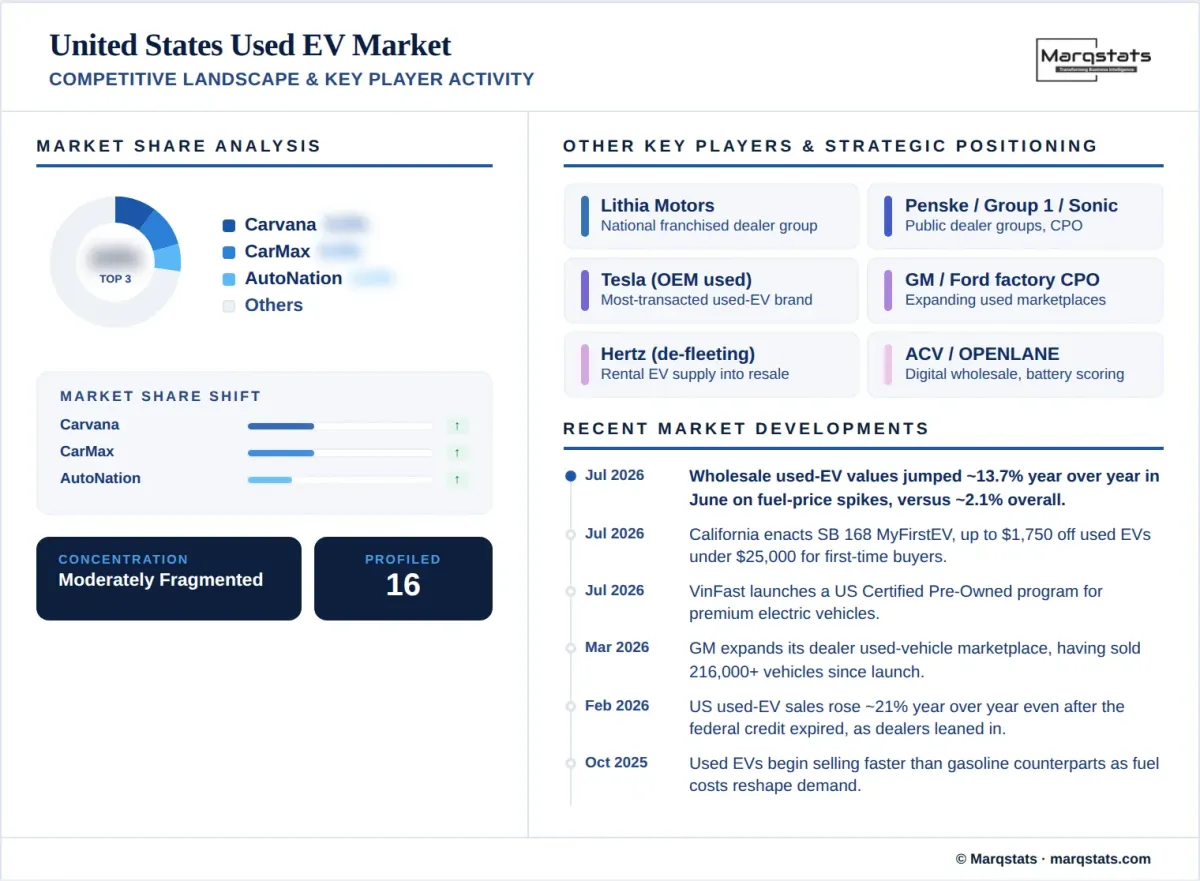
The United States used EV market is moderately fragmented, spanning national online-first retailers, publicly traded franchised dealer groups, original-equipment certified pre-owned programs, and digital wholesale marketplaces. No single retailer controls the electrified used segment; instead, competitive advantage is shifting toward operators that combine sourcing scale, battery diagnostics, reconditioning depth, financing, and multi-channel disposal. Scale without battery transparency is becoming less defensible as state-of-health certification turns pack condition into a priced attribute.
Competitive strategies cluster around three moves. First, securing off-lease and fleet-return supply through direct pipelines with lessors, rental operators, and franchised dealers—the structural source of future inventory. Second, differentiating on trust by standardizing battery state-of-health certificates, transferable warranties, and minimum-capacity guarantees. Third, channel optimization: routing younger, certified vehicles into CPO and dealer retail, highly liquid value cars into online retail, and weaker residual-risk stock into wholesale channels.
On scale, the market’s largest omnichannel and online-first used-vehicle retailers each move on the order of 600,000 to 780,000 units annually across all powertrains, with electrified vehicles estimated in the low-to-mid teens as a share of unit sales for the most digitally native players. Because manufacturer-specific and channel-specific used-EV shares are rarely disclosed, competitive position is best read through vehicle throughput, used-car market share, and electrified mix rather than published EV-only rankings. The practical implication is that leadership in the U.S. used EV market will be won less on raw inventory scale and more on the ability to source off-lease supply reliably, certify battery condition credibly, and match each vehicle to its highest-return exit channel.
Recent activity underscores the shift. Original-equipment manufacturers are expanding factory-backed used-vehicle marketplaces to capture more of the resale margin and defend residuals, while newer entrants are launching certified pre-owned programs specifically for premium electric vehicles. Digital wholesale auction platforms are deepening EV-specific inspection and battery-scoring capabilities, and captive lenders are recalibrating residual-value assumptions as used-EV volumes rise. The durable winners are increasingly hybrid operators: digital demand generation on the front end, inspection, reconditioning, and finance in the middle, and multi-channel remarketing on the back end.
Companies Covered
The report profiles 16++ companies with full strategy and financials analysis, including:
Recent Market Activity
Table of Contents
Coverage & Segmentation
This report provides a comprehensive analysis of the United States used EV market for the historical period 2021–2025, with 2025 as the base year and a 2026–2030 forecast period. The study defines a used EV as a second-hand passenger vehicle powered by a battery-electric or plug-in hybrid drivetrain and quantifies the market in both gross transaction value (USD billion) and unit volume. Coverage spans market sizing and forecasts, segmentation by propulsion type, price band, and sales channel, regional demand across the four U.S. census regions, competitive structure, and the policy, battery-health, financing, and insurance factors shaping residual values.
The analysis integrates supply-side drivers—lease maturities, fleet de-fleeting, and franchised trade-ins—with demand-side drivers such as affordability, fuel-cost sensitivity, and battery transparency. It examines the transition from a federal-incentive-led market to one shaped by state programs, financing conditions, and merchandised battery state-of-health, and it provides an actionable operating framework for sourcing, pricing, certification, channel strategy, reconditioning, and finance.