Market Snapshot
The US EV charging station market is valued at USD 2.78 billion in 2025 and is forecast to reach USD 4.38 billion by 2030, a CAGR of 9.52%. Marqstats sizes public Level 2 and DC fast stations bottom-up, and DC fast charging already absorbs 89.93% of the spend.
The confidence statement is simple. The port count is published and the dollar value is built. The Alternative Fuels Data Center (AFDC) of the US Department of Energy listed 236,407 public charging ports on 1 February 2026, of which 67,948 were DC fast, and Marqstats uses that snapshot as the year-end 2025 installed base. The Alliance for Automotive Innovation put the Q4 2025 count at 236,945. Marqstats then values the year: 18,041 new public DC fast ports at an estimated USD 125,000 installed per port, an estimated 22,000 new public Level 2 ports at USD 9,000 each, and network software and maintenance on the installed base. The panel is most sensitive to the DC fast installed cost: every USD 10,000 per port moves the 2025 value by about USD 0.18 billion.
Port growth and value growth run at different speeds, and the gap is the story. The public port base rises from 236,407 to an estimated 402,707 by 2030, an 11.24% unit CAGR, while value grows at 9.52%. Most of the new ports are cheap Level 2 units; most of the money goes into a smaller number of 150 kW to 400 kW DC fast stalls whose installed cost barely falls, because the electrical and civil work is the larger half of the bill.
Federal money is a small part of the build. The National Electric Vehicle Infrastructure (NEVI) Formula Program was suspended by the Federal Highway Administration (FHWA) in February 2025, restarted under guidance dated 11 August 2025, and lost roughly USD 503 million to a rescission in January 2026. Private balance sheets, led by Tesla, Inc., automaker joint ventures and large retailers, paid for almost all of the 2025 fast-charging build.
The near-term path is uneven. The Section 30C refueling property credit stopped for equipment placed in service after 30 June 2026 under Public Law 119-21, and DC fast port additions slowed in 2026. Marqstats estimates a dip to USD 2.58 billion in 2026 before installation spend recovers from 2027 as automaker and retailer networks convert contracted sites into energized stalls.
Key Takeaways
Market Overview & Analysis
Report Summary
Public charging in the United States has stopped being a coverage problem and become a cost-and-capacity problem. The national DC fast base passed 67,000 ports in early 2026, the federal corridor program is a minor funder, and the 30% Section 30C credit closed on 30 June 2026. What decides the next five years is how many 150 kW to 400 kW stalls private owners can energize per year against utility interconnection queues, and what each one costs.
Marqstats measures annual spend on public-access, light-duty charging stations: installed capital for new public Level 2 and DC fast ports (hardware plus behind-the-meter installation, site electrical and civil works), plus network software and maintenance on the installed public base. Electricity and session revenue, utility front-of-meter make-ready, home chargers, private workplace and fleet depot charging, medium and heavy-duty truck hubs and megawatt charging, and battery storage are excluded. Several of those adjacent markets carry their own Marqstats sizes, stated in the scope section with do-not-add notes.
Four groups use the analysis. Charge point operators deciding where to commit the next tranche of stalls need the installed-cost and gross-addition series. Equipment makers and their suppliers sizing US production need the split by power class and component. Utilities and state energy offices need the gap between modeled need and the built trajectory. Investors and lenders comparing operator plans need a market total that separates one-off capital from recurring service revenue.
US EV Charging Station Market Size and Forecast
The value series is a Marqstats construction from two published anchors and three estimated unit costs. Annual value equals gross public DC fast port additions times installed cost per port, plus gross public Level 2 additions times installed cost, plus a service charge per installed port per year. The history runs USD 0.97 billion (2021), USD 1.12 billion (2022), USD 1.94 billion (2023), USD 2.23 billion (2024) and USD 2.78 billion (2025). The forecast runs USD 2.58 billion (2026), USD 3.06 billion (2027), USD 3.50 billion (2028), USD 3.96 billion (2029) and USD 4.38 billion (2030), giving a 9.52% CAGR on the rounded 2025 and 2030 anchors.
The primary series is ports, because ports are counted by a federal agency and values are not. The AFDC base of 236,407 public ports in early 2026 splits into 67,948 DC fast and 168,459 Level 2 ports, the latter including a few hundred Level 1 and legacy outlets. Gross additions in 2025 were 18,041 public DC fast ports, as reported by Electrek on 29 January 2026 from operator-level tallies, of which Tesla, Inc. built 6,786. Marqstats estimates about 22,000 gross public Level 2 additions in 2025, offset by roughly 8,500 retirements of older non-networked units, which reconciles to the net change in the AFDC count.
The 2025 build values as follows. DC fast capital: 18,041 ports at an estimated USD 125,000 average installed cost, or USD 2.26 billion, blending Tesla stalls at an estimated cost well under USD 60,000 with 250 kW to 400 kW merchant stalls above USD 160,000. Level 2 capital: 22,000 ports at USD 9,000, or USD 0.20 billion. Network software and maintenance: an estimated USD 4,000 per DC fast port and USD 500 per Level 2 port per year across the average installed base, or USD 0.32 billion. These are Marqstats estimates built from operator disclosures and the cost ranges utilities file with state regulators.
Value grows more slowly than ports, at 9.52% against 11.24%, for a mix reason. Level 2 additions rise from 19,000 in 2026 to 28,000 in 2030 but each adds under USD 10,000. DC fast gross additions climb from 16,000 in 2026 to 26,000 in 2030 at an installed cost Marqstats holds near USD 125,000 to USD 130,000, because hardware price declines are offset by higher power per stall and Build America, Buy America content rules. The 2026 dip to USD 2.58 billion is a timing effect: the Energy Information Administration (EIA) Monthly Energy Review shows the DC fast count, public and private combined, rising only 6,628 ports between December 2025 and August 2026, against 14,549 in calendar 2025, and industry tallies reported on 14 October 2026 put third-quarter 2026 public DC fast additions at 4,106, down 12% year on year.
The fast-charging gap is closing; the Level 2 gap is not
The Joint Office of Energy and Transportation, drawing on National Renewable Energy Laboratory modeling published on 27 June 2023, put the 2030 requirement at about 1.2 million public ports: 182,000 DC fast ports and roughly one million Level 2 ports, alongside 26.8 million private ports for 30 to 42 million light-duty EVs. That benchmark is a need estimate, not a forecast, and Marqstats uses it only as a yardstick.
Against it, the two halves of the network diverge. The DC fast base grows from 67,948 to an estimated 157,748, or 86.67% of the modeled need, because operators with their own capital (Tesla, Inc., IONNA LLC, Walmart Inc., Rivian Automotive, Inc. and EVgo Inc.) are building to meet driver demand that they can monetize at USD 0.40 to USD 0.60 per kWh. The Level 2 base grows from 168,459 to an estimated 244,959, about 24.50% of the need, because a Level 2 port earns little per session and the host typically has to pay for it.
The implication runs against much public commentary. The United States is on track for a fast-charging network that is close to adequate for corridor and urban fast charging by 2030, but not for the slow, overnight public charging that renters and multifamily residents depend on. The money that would close that gap is small in market terms: roughly 755,000 additional Level 2 ports at USD 9,500 would cost about USD 7.17 billion, spread over years, and the funding mechanism is the missing piece.
Federal funding sets rules more than it builds stations
NEVI matters for its standards rather than its volume. The program authorized USD 5.0 billion over fiscal years 2022 to 2026 and set the 23 CFR Part 680 rules: four 150 kW ports per site, 97% annual uptime per port, open payment and data reporting. Yet NEVI-funded sites contributed 99 stations and 497 ports in 2025, under 3% of that year's 18,041 DC fast additions.
Policy then shrank the federal role further. The FHWA suspended state plans in February 2025, issued new guidance on 11 August 2025, saw about USD 503 million rescinded across 30 states and territories in January 2026, and in February 2026 removed the 50-mile spacing and one-mile corridor rules while proposing a Build America, Buy America revision for EV charging equipment. By May 2026, 42 state and territory plans had been approved and 12 states certified as fully built out. Roughly USD 739 million had been awarded by July 2026, as compiled by Atlas Public Policy.
Marqstats therefore treats NEVI as a modest add-on to private build rates rather than a driver of them. The program could still fund up to about 22,200 DC fast ports from remaining balances, but disbursement depends on state procurement cycles that have run longer than 24 months. Any NEVI-funded stall that does open is counted inside the gross additions above, so federal money is part of the market, not a layer on top of it.
Installed cost is an electrical problem, so it will not fall quickly
Hardware is less than half of a public charging station. Marqstats estimates installation, site electrical and civil work at USD 1.35 billion in 2025, or 48.56% of value, against USD 1.11 billion for chargers and dispensers. At a high-power site the pad-mounted transformer, switchgear, conduit and trenching can add USD 50,000 to USD 250,000 per installation before the first dispenser is set.
That cost structure explains why Marqstats holds the DC fast installed cost near flat, rising from USD 125,000 to USD 130,000 per port by 2030. Power electronics are getting cheaper per kW, but new stalls are moving to 250 kW to 400 kW, sites are larger (Walmart Inc. builds 8 to 16 stalls per store), and dual CCS1 and SAE J3400 cabling adds cost to each dispenser. The operators that lower cost per stall do it by standardizing site design and building in volume, which is the strategy Tesla, Inc. and EVgo Inc. have both described.
The conclusion for suppliers is that the addressable pool for electrical contractors and switchgear makers grows faster than the pool for charger cabinets. Installation and site electrical value rises from USD 1.35 billion to USD 2.08 billion by 2030, while hardware rises from USD 1.11 billion to USD 1.57 billion.
Market Dynamics
Key Drivers
Four forces carry the build-out through 2030, and none depends on new federal grants.
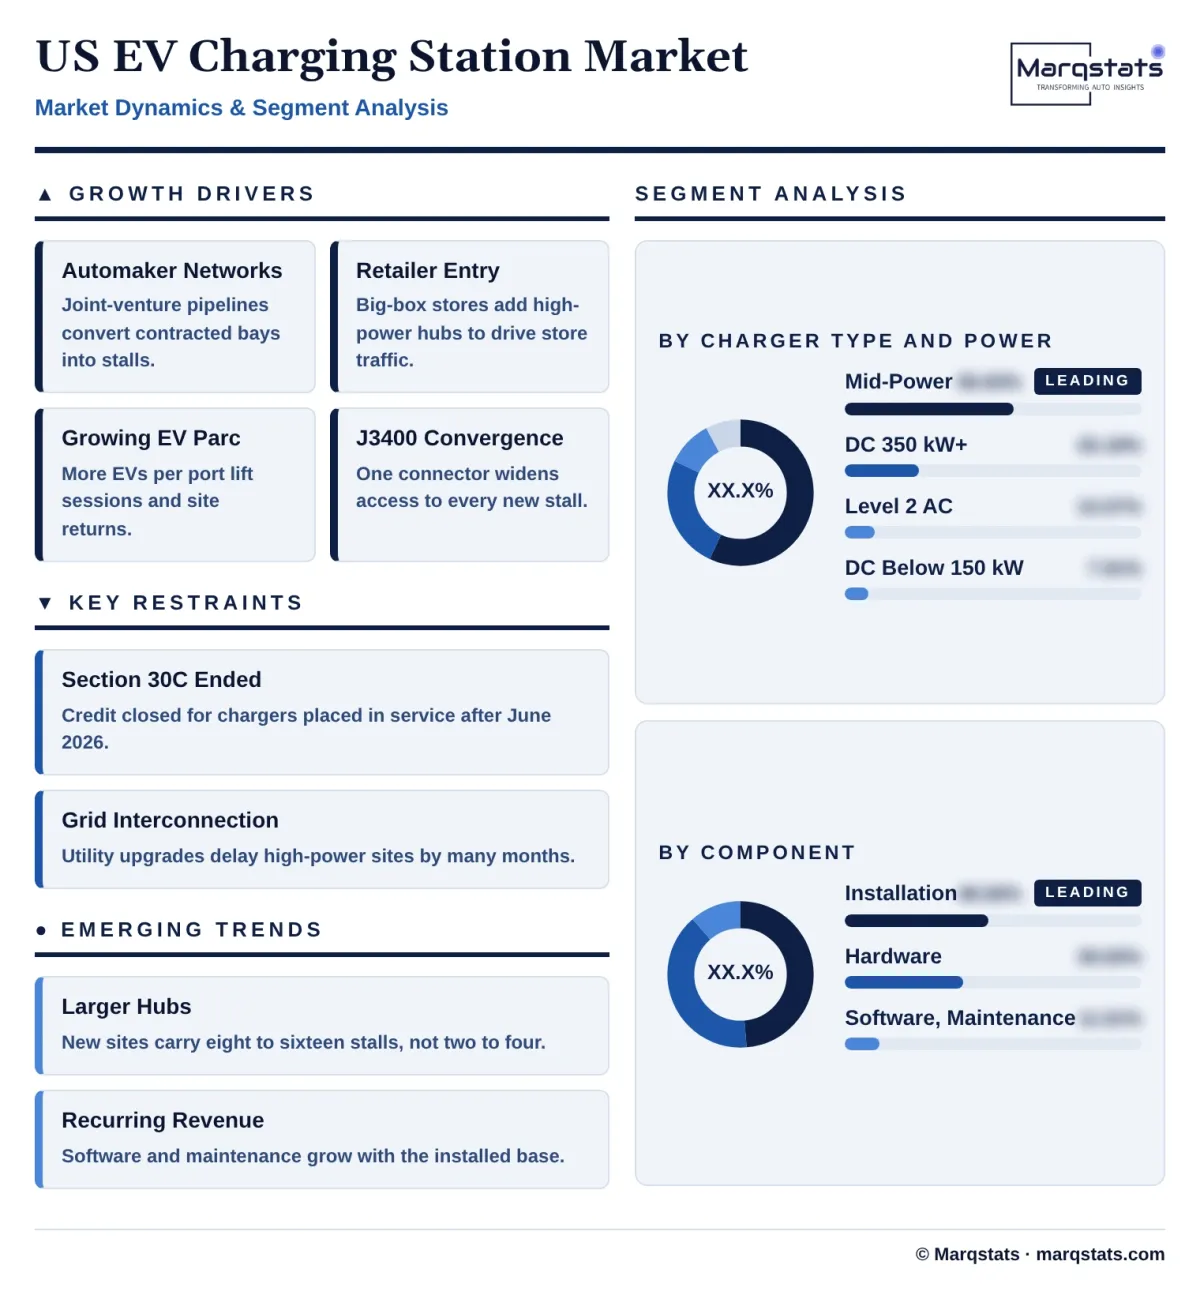
- Automaker-backed networks: IONNA LLC, the joint venture of eight automakers, had more than 100 live sites, nearly 1,000 bays and over 4,700 contracted bays on 17 March 2026, so a large pipeline of high-power stalls is already committed and moves into the market as sites energize.
- Retailer entry: Walmart Inc. opened its 100th company-owned fast-charging store in Monument, Colorado on 21 August 2026, with 100 stores across 20 states, 8 to 16 stalls at most sites and up to 400 kW output; retailers treat charging as a traffic tool and can fund it from property budgets.
- A larger EV parc on the road: the Alliance for Automotive Innovation counted 7.3 million EVs in operation at the end of 2025, about 31 EVs per public port, and 141 million public fast-charging sessions were reported for 2025, up about 30%, so utilization supports more stalls even while new EV sales slowed.
- Connector convergence on SAE J3400: automakers shipping native J3400 ports from model year 2025 opened the 6,786 Superchargers Tesla, Inc. added in 2025 to most new EVs, raising usable capacity per port and lowering the risk that a stall is stranded by connector choice.
Key Restraints
Three restraints bind on cost and timing rather than on demand.
- Loss of Section 30C: the 30% alternative fuel refueling property credit, capped at USD 100,000 per item, is not allowed for property placed in service after 30 June 2026 under Public Law 119-21, raising the net cost of every site that was not energized by that date.
- Utility interconnection: high-power sites wait an estimated 12 to 36 months for service upgrades at many investor-owned utilities, against weeks for Level 2, so a stall pipeline converts to revenue slowly and capital sits idle.
- Demand charges: at USD 15 to USD 45 per kW of monthly peak, a site with two coincident 350 kW sessions can owe about USD 17,500 a month at USD 25 per kW regardless of energy sold, which keeps operators away from low-utilization rural locations.
Key Trends
Three shifts change what a public station looks like.
- Larger sites: new hubs are built with 8 to 16 stalls rather than two to four, and the EIA reports DC fast ports per location rising from 4.20 in December 2024 to 4.91 in August 2026.
- Recurring revenue: ChargePoint Holdings, Inc. reported USD 43.7 million of subscription revenue in its fiscal second quarter of 2027, up 10%, as host-owned networks shift earnings from hardware sales to software and service.
- Equipment renewal: EVgo Inc. added 280 stalls in Q2 2026 while removing 175 legacy stalls under its Renew program, a sign that replacement of first-generation 50 kW hardware is becoming a regular spend line.
Strategic Implications
- For entrants: fast charging on interstate corridors is crowded by operators with their own capital; the open opportunity is managed public Level 2 for multifamily neighborhoods and curbside, where the base reaches only about a quarter of modeled need and a host-funded model can work if utilities cover make-ready.
- For incumbents: with installed cost near USD 125,000 per DC fast port and demand charges unchanged, returns depend on sessions per stall, so siting discipline and uptime matter more than port count; the 97% uptime rule for NEVI sites is becoming a commercial expectation everywhere.
- For suppliers and investors: the growing pools are installation and site electrical work (USD 2.08 billion by 2030) and software and maintenance (USD 0.73 billion), not charger cabinets alone; domestic content rules favor suppliers with US assembly, and recurring service contracts are the line least exposed to the end of Section 30C.
Market Segmentation
Level 2 is most of the ports and a small share of the money: USD 0.28 billion in 2025, 10.07% of value, rising to USD 0.38 billion (8.68%) in 2030. The public Level 2 base of 168,459 ports grows to an estimated 244,959, but each port adds only about USD 9,000 to USD 9,500 installed. The segment includes network software and maintenance on the Level 2 base, roughly USD 500 per port per year. The constraint is economics, not equipment: a Level 2 session earns little, so growth depends on hosts, municipalities and utility programs paying for ports.
This is a shrinking segment, from USD 0.22 billion (7.91%) in 2025 to USD 0.18 billion (4.11%) in 2030. Much of the value is maintenance on the legacy 50 kW and 62.5 kW base built before 2022, plus a small number of urban retail installations where dwell time suits slower charging. Operators such as EVgo Inc. are retiring older units, so new 50 kW sales decline steadily.
This mid-power DC class is the core of the market at USD 1.58 billion in 2025, 56.83% of value, rising to USD 2.20 billion (50.23%) in 2030. It holds Tesla Supercharger V3 and V4 stalls and most 150 kW to 300 kW merchant dispensers, the configuration the NEVI minimum of 150 kW per port has made standard. Its share falls because new hubs increasingly specify higher-power cabinets.
The fastest-growing class, from USD 0.70 billion (25.18%) to USD 1.62 billion (36.99%), an 18.27% CAGR. IONNA LLC and Walmart Inc. specify 400 kW dispensers, and newer 800-volt vehicles reward them. Per-port cost is highest here, and so is the transformer and switchgear content, which makes this class the main source of growth in installation value.
Chargers, dispensers, power cabinets and cables are an estimated USD 1.11 billion in 2025 (39.93%) and USD 1.57 billion in 2030 (35.84%). Hardware share declines because per-kW prices fall faster than site works, even after dual CCS1 and SAE J3400 cabling and domestic content requirements add cost.
The largest component: USD 1.35 billion in 2025 (48.56%) and USD 2.08 billion in 2030 (47.49%). It covers behind-the-meter transformers where the site owner pays, switchgear, trenching, foundations, canopies and commissioning. Utility-side make-ready paid through rate base sits outside the market.
Software subscriptions, payment processing platforms, remote monitoring and field maintenance on the installed public base total USD 0.32 billion in 2025 (11.51%) and USD 0.73 billion in 2030 (16.67%), a 17.93% CAGR. Growth follows the installed base, not new additions, so this is the most predictable line in the market.
Corridor and travel-center sites account for USD 1.20 billion in 2025 (43.17%) and USD 1.80 billion in 2030 (41.10%). Pilot Travel Centers LLC, Electrify America, LLC and Tesla, Inc. dominate the corridor build, and the FHWA has certified 12 states as fully built out, so corridor share eases as gaps close.
Retail and destination sites are the largest segment: USD 1.25 billion in 2025 (44.96%) and USD 1.98 billion in 2030 (45.21%). Walmart Inc., grocery-anchored plazas and IONNA LLC sites with amenities place chargers where drivers already stop for 20 to 60 minutes.
Municipal lots, curbside poles, public-access workplace lots and multifamily-adjacent charging account for USD 0.33 billion in 2025 (11.87%) and USD 0.60 billion in 2030 (13.70%), a 12.70% CAGR. NEVI flexibility for fully built-out states, plus state programs, moves money into this segment, though per-port value is low.
Networks owned by automakers or their joint ventures (Tesla, Inc., IONNA LLC, Rivian Automotive, Inc. and Mercedes-Benz Group AG) account for USD 1.15 billion in 2025 (41.37%) and USD 1.80 billion in 2030 (41.10%). Tesla share of new fast-charging installations fell from 55% in 2023 to 39% in 2025 by the Alliance for Automotive Innovation count, while IONNA LLC has the largest contracted pipeline.
Owner-operators that are neither automakers nor site hosts selling to themselves (EVgo Inc., Electrify America, LLC, bp pulse US, Walmart Inc. and Pilot Travel Centers LLC) account for USD 1.15 billion in 2025 (41.37%) and USD 1.95 billion in 2030 (44.52%), the fastest-growing model at 11.14%.
Chargers sold to property owners and run on a network platform, the model of ChargePoint Holdings, Inc. and Blink Charging Co., account for USD 0.48 billion in 2025 (17.27%) and USD 0.63 billion in 2030 (14.38%). The segment is Level 2-heavy and the most exposed to the end of Section 30C, which subsidized host purchases.
By Geography
West
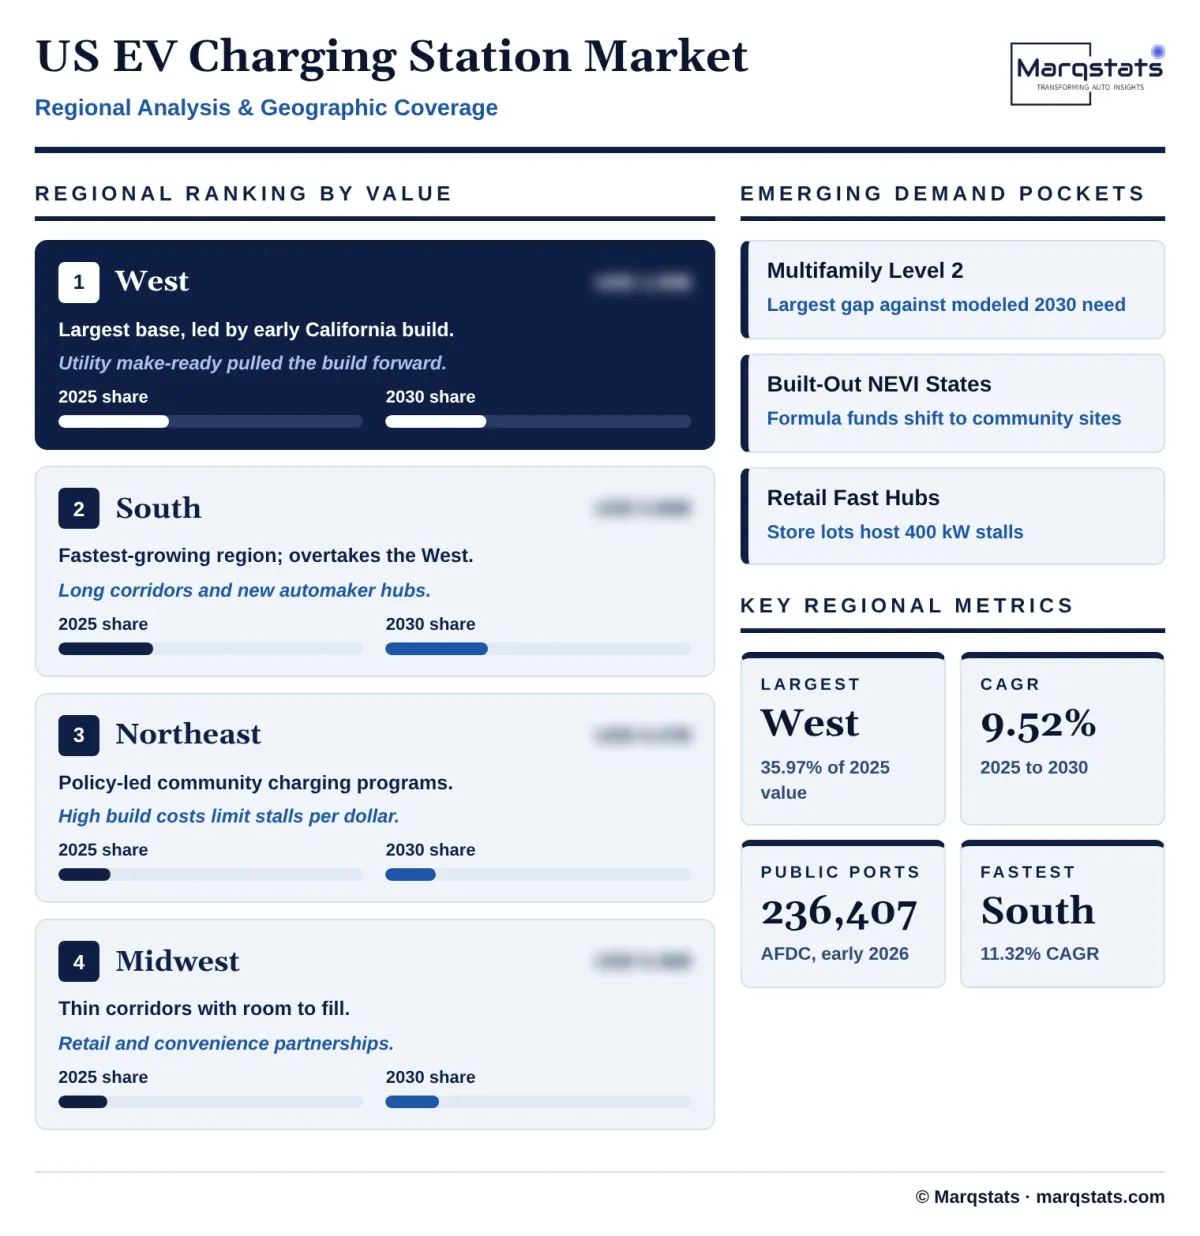
The West is the largest region because California built early and still builds more than any other state. Marqstats estimates West spend at USD 1.00 billion in 2025 (35.97%) and USD 1.43 billion in 2030 (32.65%), a 7.42% CAGR. Share falls because the region already has a dense base and California utility make-ready programs have pulled forward much of the build, while Walmart Inc. sites such as its 100th store in Monument, Colorado extend high-power charging into the interior West.
South
The South is the fastest-growing region and overtakes the West by 2030. Marqstats estimates USD 0.86 billion in 2025 (30.94%) rising to USD 1.47 billion (33.56%), an 11.32% CAGR. Texas, Florida, Georgia and North Carolina combine rising EV registrations with long interstate corridors and lower land costs; IONNA LLC opened its first site in Apex, North Carolina in February 2025 and has concentrated early sites in the region.
Northeast
The Northeast is mid-sized and policy-led. Marqstats estimates USD 0.47 billion in 2025 (16.91%) and USD 0.72 billion in 2030 (16.44%), an 8.90% CAGR. New York and Massachusetts programs fund community charging, and the New York State Energy Research and Development Authority is moving NEVI money into community fast charging, but high construction costs limit stall counts per dollar.
Midwest
The Midwest starts smallest and grows quickly because its corridors are still thin. Marqstats estimates USD 0.45 billion in 2025 (16.19%) and USD 0.76 billion in 2030 (17.35%), an 11.05% CAGR. Long distances between metro areas, retailer and convenience-store partnerships, and spare grid capacity at some rural substations support new corridor hubs, although low utilization at rural sites remains the risk.
How Competition Is Evolving
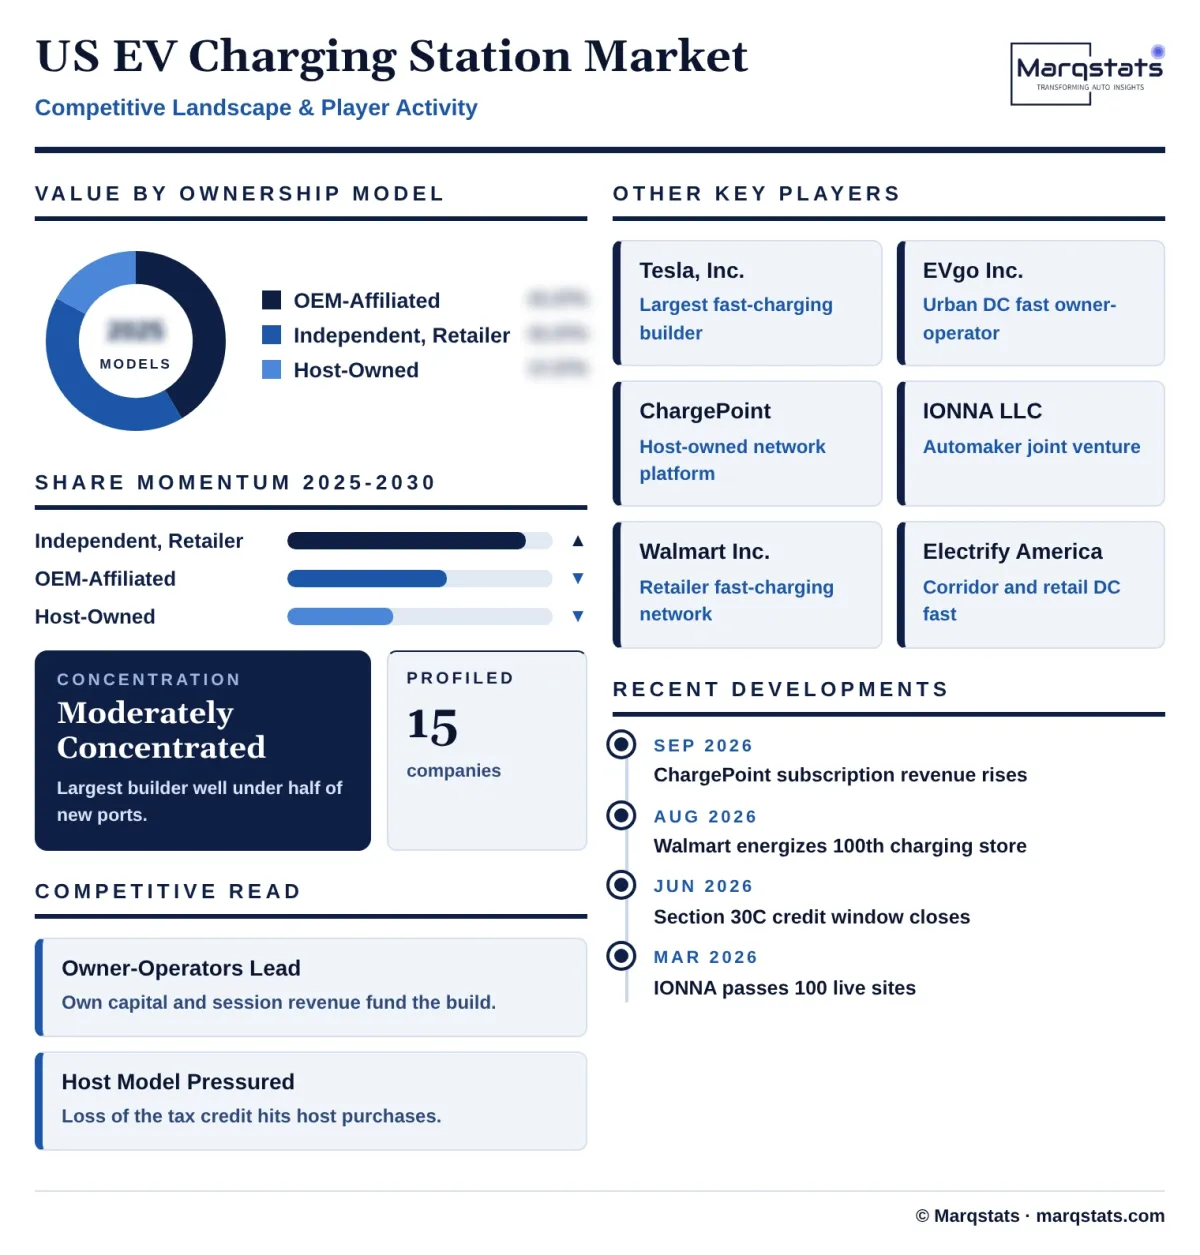
Competition sorts by business model rather than by product. Owner-operators that capture session revenue (Tesla, Inc., EVgo Inc., Electrify America, LLC, IONNA LLC, Walmart Inc.) compete for sites and grid capacity. Platform vendors that sell hardware and software to hosts (ChargePoint Holdings, Inc., Blink Charging Co.) compete on network fees and uptime. Equipment makers (ABB E-mobility, Alpitronic GmbH, SK Signet, Wallbox N.V.) supply both groups. More than 120 networks were active in public fast charging in 2025, but the build is concentrated: Tesla, Inc. added 6,786 of 18,041 DC fast ports and the next nine operators combined added 6,126.
Marqstats rates the market Moderately Concentrated in value terms and does not publish company market shares for 2025, because no registry reports operator revenue on a common basis. What the dated evidence shows is the shift in who builds. Tesla share of new fast-charging installations fell from 55% in 2023 to 39% in 2025 by the Alliance for Automotive Innovation measure. EVgo Inc. reached 5,380 stalls in operation at 30 June 2026, up 24% year on year, and guided 2026 revenue of USD 400 million to USD 430 million. IONNA LLC had over 4,700 bays contracted in March 2026.
The host-owned model is under the most pressure. ChargePoint Holdings, Inc. grew revenue 18% to USD 116.1 million in its fiscal second quarter of 2027 and narrowed its GAAP net loss to USD 35.6 million, but its customers lost the Section 30C credit on 30 June 2026. Operators with their own capital and high-utilization sites are best placed through 2030.
Companies Covered
Companies covered in the report include:
Recent Market Activity
Table of Contents
Coverage & Segmentation
Coverage spans public-access, light-duty electric vehicle charging stations in the 50 US states and the District of Columbia: Level 2 AC ports and DC fast ports listed as publicly accessible. Value equals installed capital for new public ports (hardware plus behind-the-meter installation, site electrical and civil works) plus network software and maintenance on the installed public base, in current US dollars. Base year 2025, history 2021 to 2025, forecast 2026 to 2030.
Excluded: electricity and charging-session revenue; utility front-of-meter make-ready recovered through rate base; residential chargers (sized separately in the US Residential EV Charger page); private workplace and fleet depot charging; medium and heavy-duty truck hubs and megawatt charging; battery storage, solar and microgrids; Canada and Mexico.
Do-not-add notes. The live US Commercial EV Charging Infrastructure page sizes USD 7.84 billion in 2025 and USD 24.67 billion in 2030 across public and private commercial charging, including depots, workplace, truck hubs and the storage and energy-management layer. Public-access stations sit inside that total, so the USD 2.78 billion here is a deep-dive into part of it and must not be added to it; the remaining USD 5.06 billion is depots, private workplace, truck hubs and the storage layer. Depot charging is excluded here entirely, so the Marqstats US depot core of USD 1.60 billion (2025) and the live US Fleet Depot page (USD 2.87 billion, which adds utility make-ready, solar and charging-as-a-service) do not overlap with this market.