Statistics & Highlights

Market Snapshot

Market size in Thousand Units
41K Units
2025
Base year
44K Units
2026
Estimated
  
58K Units
2030
Forecast
Largest market
Kampala Metropolitan
Fastest growing
Electric (Fuel Type)
Dominant segment
Passenger Carrier
Concentration
Fragmented
CAGR
7.00%
2026 – 2030
GROWTH
+17K Units
Absolute
STUDY PARAMETERS
Base year2025
Historical period2021 – 2025
Forecast period2026 – 2030
Units consideredVolume (Thousand Units)
REPORT COVERAGE
Segments covered4
Regions covered1
Companies profiled16+
Report pages250+
DeliverablesPDF, Excel, PPT
Executive Summary

Key Takeaways

Uganda three wheeler market recorded 41.08 thousand units in 2025, projected to reach 58.42 thousand units by 2030 at 7.00% CAGR.
Market value stood at USD 179.99 million in 2025 and is forecast to reach USD 273.65 million by 2030 at 8.43% CAGR.
Load carriers held 28.00% of 2025 volume, the highest cargo share in East Africa, driven by agricultural haulage between farms and district markets.
Electric three wheelers are the fastest growing segment at 35.36% CAGR, rising from 2.50% to 10.50% of volume by 2030 on local assembly incentives.
Chinese brands led by Zongshen dominate Kampala retail on landed cost, while Piaggio, Bajaj, and TVS hold established franchise positions.
Manufacturing-led policy: a 10-year tax holiday, VAT exemption on local EVs, and 25% duty on built-up imports steer the electric transition toward Ugandan assembly.
Market Insights

Market Overview & Analysis

Report Summary

The Uganda three wheeler market covers passenger-carrier and load-carrier three wheeled vehicles sold nationally, spanning petrol, diesel, CNG/LPG, and electric powertrains. The study quantifies the market in volume (thousand units) and value (USD million) across 2021-2025 historical and 2026-2030 forecast horizons, with 2025 as the base year. Uganda is an import-dependent market supplied through Mombasa port and the Northern Corridor, with Chinese manufacturers commanding the retail volume base and Indian franchises anchoring the established passenger taxi segment through regional distributors.

Demand contracted to 32.99 thousand units in 2022 as shilling weakness and elevated freight costs squeezed import affordability, before recovering to 41.08 thousand units in 2025 on currency stabilization and restocking through Kampala dealer channels. Registration and trade series compiled by the Uganda Bureau of Statistics corroborate the recovery, and Marqstats reconciles these records against Indian export dispatches, Chinese shipment flows, and distributor channel checks to produce the volume series underlying this report. Blended average selling prices sit near USD 4,380 per unit in 2025, with value growth outpacing volume growth as electric and heavier cargo variants enrich the mix.

The defining forecast dynamic is a policy-engineered pivot from import dependence toward local assembly. The Kiira Motors Vehicle Plant in Jinja anchors an emerging manufacturing ecosystem that already produces the Bingwa multi-functional cargo trike with majority-local content, while retrofit ventures convert combustion tricycles to battery power using locally assembled packs. The market adds 17.34 thousand annual units between 2025 and 2030, with locally built and converted electric platforms contributing a rising share of incremental demand.

Financing determines effective demand across the ownership base. New petrol tricycles retail from roughly UGX 5-9 million in Kampala, cargo platforms command premiums for payload, and hire-purchase arrangements through dealers and asset financiers such as Watu extend purchase capacity to owner-drivers with thin formal credit histories. Battery-financing and swap-linked models emerging from the electric motorcycle ecosystem are beginning to migrate to three wheelers, compressing the upfront-cost gap that has historically slowed electric adoption.

Market Dynamics

Key Drivers

  • Agricultural haulage demand: cargo tricycles move produce between farm gates, trading centres, and district markets across a predominantly rural economy, sustaining the region's highest load-carrier share at 28.00% of volume.
  • Manufacturing incentives: a 10-year income tax holiday for EV and battery manufacturers, VAT exemption on locally made electric vehicles and charging services, and zero-rated production materials anchor an assembly-led growth model targeting 500,000 units of combined vehicle capacity by 2030.
  • Import affordability recovery: shilling stabilization from 2023 restored dealer restocking through the Northern Corridor, lifting volumes 11.3% in 2025 alongside strong Indian export dispatches to East Africa.
  • Charging corridor rollout: 28 e-mobility charging stations along the Kampala-Masaka corridor and a 140,000 e-bike target by 2027 build shared infrastructure that lowers barriers for electric tricycle deployment.
  • Urban service demand: Kampala's periphery, Jinja, Mbale, and Gulu sustain passenger tuk tuk routes and municipal service applications where minibus taxis and boda bodas leave coverage gaps.

Key Restraints

  • Import duty on built-up electric vehicles: the 25% duty on fully built electric three wheelers raises landed costs for imported EV product, slowing adoption until local assembly volumes scale.
  • Financing gaps: elevated interest rates and informal incomes keep much purchase activity in cash or dealer hire-purchase channels, constraining fleet renewal among owner-drivers.
  • Grid reliability and charging concentration: charging infrastructure remains concentrated along the Kampala-Masaka corridor, and rural grid coverage limits electric cargo use cases in the deep countryside.
  • Regulatory friction in Kampala: periodic enforcement drives and route restrictions in the central business district cap passenger tricycle penetration in the capital's core.

Key Trends

  • Local assembly momentum: the Bingwa cargo trike, built at the Kiira Motors Vehicle Plant with 55% local content and initial capacity of 1,000 units per year, demonstrates the domestic manufacturing pathway the incentive framework is designed to scale.
  • Retrofit electrification: ventures such as GOGO convert cargo tricycles to battery power using locally assembled smart batteries, pairing vehicles with financing through partners such as Watu.
  • Government fleet electrification: the 2026 directive that government vehicles be electric and locally made creates institutional demand anchored to domestic assembly lines.
  • Chinese cargo platform proliferation: Zongshen, Loncin, and Dayang cargo trikes expand through Kampala dealer networks such as Dura Motors, deepening price competition in the load-carrier segment.
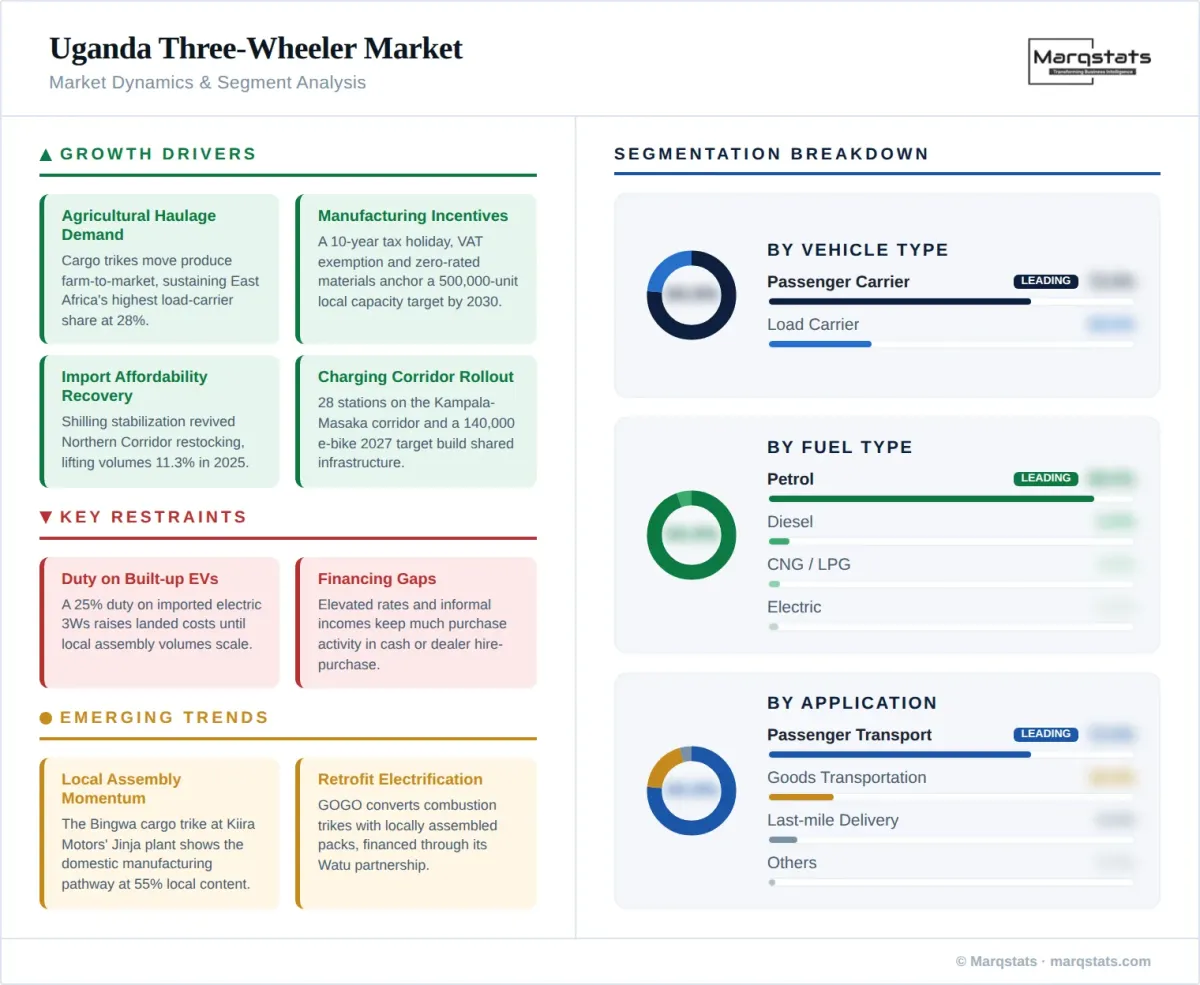
Uganda Three Wheeler Market Market Dynamics Segment Analysis Infographic
Segment Analysis

Market Segmentation

Passenger Carrier
Leading

Passenger carriers accounted for 72.00% of 2025 volume at 29.58 thousand units and are projected to reach 40.89 thousand units by 2030 at a 6.40% CAGR. Demand concentrates in Kampala's peri-urban corridors, Jinja, Mbale, and northern towns, where tuk tuk taxis serve estate-level routes and feeder connections that minibus taxis leave uncovered.

Load Carrier

Load carriers held 28.00% of 2025 volume at 11.50 thousand units, the highest cargo proportion in East Africa, and grow faster at a 8.48% CAGR to 17.53 thousand units by 2030. Chinese flatbed and box-body platforms dominate the segment, hauling agricultural produce, construction materials, and trade goods, with multi-functional local designs adding water pumping and power generation capability for rural buyers.

Petrol
Leading

Petrol remained dominant at 89.00% of 2025 volume, or 36.56 thousand units, yet grows slowest at a 5.35% CAGR as electric alternatives scale; its share declines to 82.40% of volume by 2030 while remaining the workhorse powertrain in rural and long-route applications.

Diesel

Diesel held a 5.50% share in 2025, concentrated in heavier cargo applications, and contracts at a -2.02% CAGR through 2030 as fuel costs and the availability of electric cargo alternatives erode its position among high-utilization operators.

CNG/LPG

CNG/LPG variants held a marginal 3.00% of 2025 volume. Without a national gas-mobility programme or refuelling infrastructure, adoption rests on scattered LPG conversions, and the segment holds a broadly flat 3.50% share by 2030, expanding modestly from a small base at a 10.30% CAGR.

Electric

Electric three wheelers are the fastest growing segment, expanding from 1.03 thousand units in 2025 to 6.13 thousand units by 2030 at a 35.36% CAGR. The National E-Mobility Strategy framework coordinated with the Ministry of Works and Transport steers adoption toward locally assembled and retrofitted platforms through the tax holiday, VAT exemption, and zero-rated production materials, while the 25% duty on built-up imports keeps the transition anchored to Ugandan factory floors and conversion workshops.

Passenger Transport
Leading

Passenger transport represented 72.00% of 2025 volume, mirroring the passenger-carrier base, and grows at a 6.40% CAGR on peri-urban and secondary-town route demand across the country.

Last-mile Delivery/Logistics

Last-mile delivery is the fastest growing application at a 12.80% CAGR, rising from 3.29 thousand units in 2025 to 6.13 thousand units by 2030 as Kampala's e-commerce, courier, and institutional supply operations, including hospital logistics served by electric tuk tuks, contract dedicated tricycle fleets.

Goods Transportation

General goods transportation accounted for 18.00% of 2025 volume at 7.39 thousand units, the largest cargo application, growing at a 6.40% CAGR on agricultural evacuation, market-trader haulage, and construction supply movement across district economies.

Others

Other applications, including municipal services, waste collection, water pumping, and mobile vending, held 2.00% of 2025 volume and grow at a 7.00% CAGR, supported by multi-functional trike designs aimed at rural households.

Individual Owner/Drivers
Leading

Individual owner-drivers purchased 71.00% of 2025 volume at 29.17 thousand units, growing at a 6.08% CAGR. Ownership remains the dominant livelihood model, financed through dealer hire-purchase schemes, savings groups, and asset financiers.

Fleet Operators

Fleet operators accounted for 27.00% of 2025 volume and outpace the market at a 8.89% CAGR to 17.23 thousand units by 2030, as delivery aggregators, agro-processing supply chains, and battery-financing platforms build managed tricycle fleets.

Government/Institutional Purchases

Government and institutional purchases held 2.00% of 2025 volume and grow at a 11.77% CAGR, lifted by the electric-and-locally-made government fleet directive and municipal service procurement.

Regional Analysis

By Geography

Kampala Metropolitan

Greater Kampala, including Wakiso and Mukono, is the largest demand pool, combining peri-urban passenger routes with the country's densest cargo and delivery activity. Central business district restrictions push passenger tricycles toward estate feeder routes, so the capital's growth skews to load carriers and fleet applications. Kampala also hosts the retrofit and battery ecosystem, the Kampala-Masaka charging corridor's northern anchor, and the dealer networks through which Chinese platforms reach the national market.

Operator economics in the capital favour cargo work: a tricycle hauling building materials or market produce typically earns more per day than estate passenger service, and used Zongshen platforms trading between UGX 2.8 million and 5.5 million keep entry costs within reach of first-time operators. This liquid second-hand market, visible across Kampala's dealer yards and classifieds channels, extends effective vehicle lives to a decade or more and anchors replacement demand for the new-unit market upstream.

Eastern Uganda

Jinja, Mbale, and the eastern trade corridor toward the Kenyan border form the second demand pole. Jinja hosts the Kiira Motors Vehicle Plant and the emerging assembly ecosystem, while dense smallholder agriculture across Busoga and Bugisu sustains strong cargo tricycle demand for produce evacuation and market-day haulage.

The region also illustrates the boda boda upgrade pathway that feeds national demand: motorcycle taxi operators graduating to three wheelers gain payload capacity, weather protection, and family-transport capability for a manageable financing step-up, and dealers report that a meaningful share of first-time tricycle buyers arrive from the boda economy. With an estimated 200,000 boda riders in Kampala alone and hundreds of thousands more nationally, this conversion funnel represents the deepest long-run demand reservoir for the market.

Northern Uganda and West Nile

Gulu, Lira, and Arua anchor a recovering regional economy where tricycles fill wide public transport gaps. Passenger tuk tuks operate as town taxis and cargo trikes serve agricultural trade toward South Sudan and DRC border markets, with price-led Chinese platforms dominating a cash-purchase buyer base.

Cross-border trade gives the north a distinct demand rhythm: consignment volumes into South Sudan and eastern DRC pull cargo tricycles onto border-feeder routes, and dealers in Gulu and Arua report purchase cycles tracking harvest income and trade seasons rather than urban credit availability. Electrification arrives last here in the base case, contingent on grid extension and the spread of battery-financing models beyond the central corridor.

Western and Central Uganda

Mbarara, Fort Portal, Masaka, and the central cattle-and-banana belt combine passenger operations in growing secondary cities with agricultural haulage demand. The Kampala-Masaka e-mobility charging corridor extends electric feasibility into the region, positioning it as the first rural-facing electric tricycle testbed as local assembly volumes build.
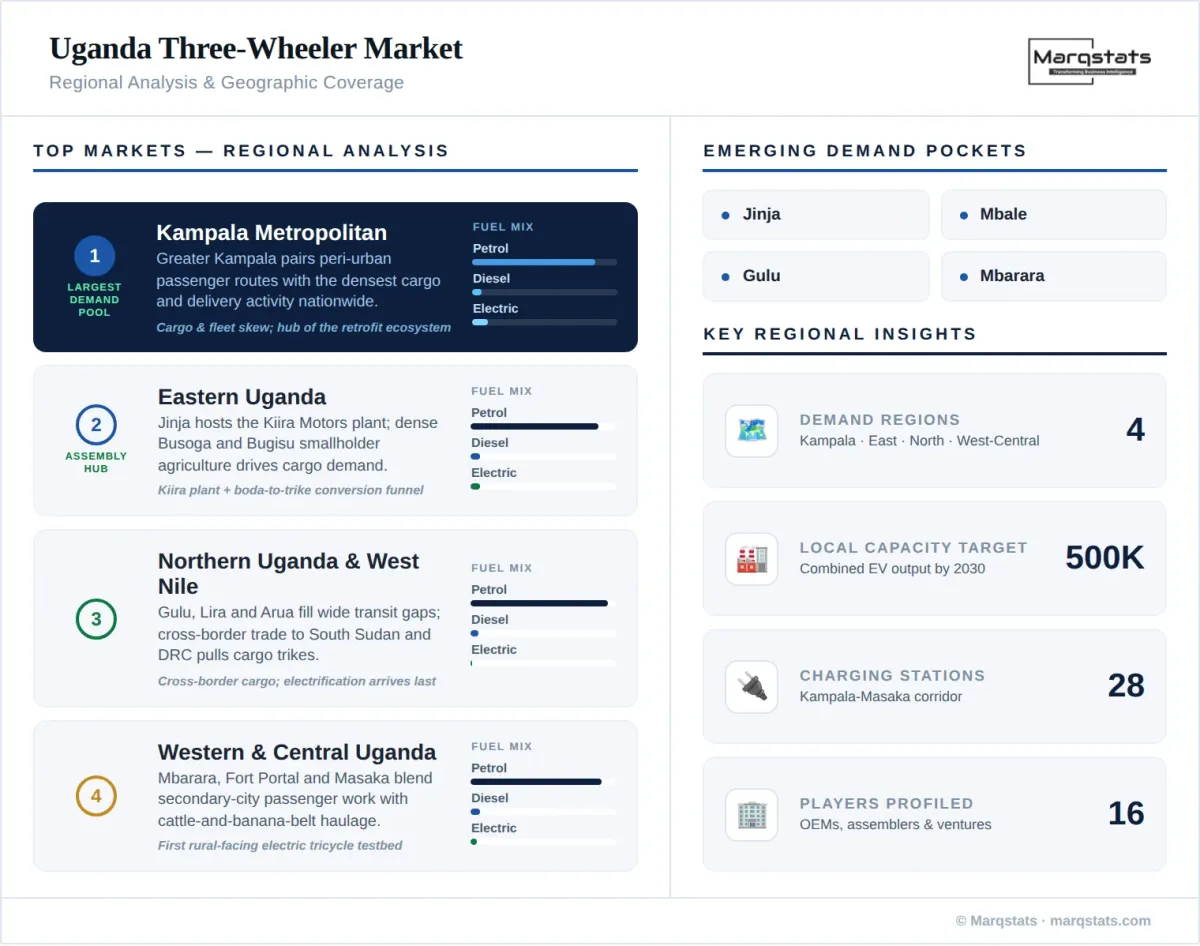
Uganda Three Wheeler Market Regional Analysis Geographic Coverage Infographic
Competitive Landscape

How Competition Is Evolving

The market is fragmented with a price-led Chinese volume base and established Indian franchises. Zongshen holds the most visible retail position in Kampala through dealer networks such as Dura Motors, with Loncin, Lifan, Dayang, and Jinpeng platforms competing on landed cost across passenger and cargo configurations. Piaggio, Bajaj, and TVS anchor the established passenger taxi segment through regional distribution structures, competing on durability, parts availability, and financing access rather than sticker price.

A domestic manufacturing tier is forming around the incentive framework. Kiira Motors Corporation provides the industrial anchor at its Jinja plant, where Kevoton Motions Engineering builds the Bingwa multi-functional cargo trike with majority-local content, and GOGO converts combustion tricycles to battery power using locally assembled packs, financed through its Watu partnership. The 10-year tax holiday, VAT exemption on local product, and zero-rated materials tilt the economics decisively toward this tier over the forecast period, while the 25% duty prices imported electric product at a structural disadvantage.

Competition over the forecast period will centre on financing reach and local-content positioning. Dealer hire-purchase capacity determines addressable demand among owner-drivers, and qualification for manufacturing incentives requires local employment and materials thresholds that favour committed assemblers over kit importers. Distribution and after-sales depth remain the incumbents' moat; the emerging local tier's counter is policy-backed cost advantage and institutional procurement anchored to the government's electric fleet directive.
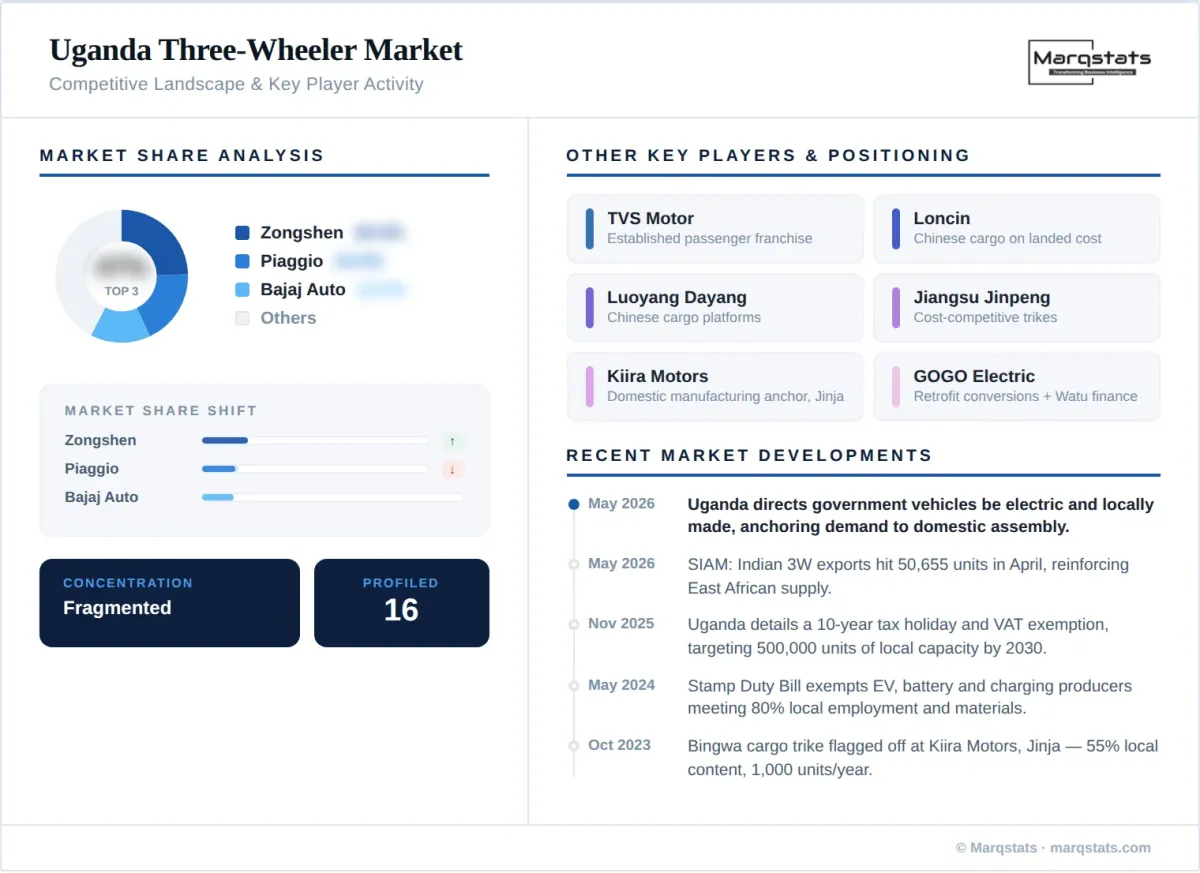
Uganda Three Wheeler Market Competitive Landscape Key Player Activity Infographic
Major Players

Companies Covered

The report profiles 16+ companies with full strategy and financials analysis, including:

Chongqing Zongshen Automobile Industry Co., Ltd.
Piaggio & C. S.p.A.
Bajaj Auto Limited
TVS Motor Company Limited
Loncin Motor Co., Ltd.
Lifan Technology (Group) Co., Ltd.
Jiangsu Jinpeng Group Co., Ltd.
Luoyang Dayang Trike Locomotive Co., Ltd.
Atul Auto Limited
Greaves Cotton Limited
Mahindra Last Mile Mobility Limited
Kiira Motors Corporation
Kevoton Motions Engineering Ltd.
GOGO Electric Limited
Watu Credit Limited
Dura Motors Uganda Limited
Note: Full company profiles include revenue analysis, product portfolio, SWOT, and recent strategic developments.
Latest Developments

Recent Market Activity

May 2026
Uganda directed that government vehicles be electric and locally made under the national e-mobility strategy, creating institutional demand anchored to domestic assembly lines including three wheeler platforms.
May 2026
SIAM data showed Indian three wheeler exports of 50,655 units in April 2026, nearly double the prior-year month, reinforcing supply availability for East Africa's import-dependent markets.
Nov 2025
Uganda detailed a 10-year income tax holiday for electric vehicle and battery manufacturers, VAT exemption on locally manufactured EVs and charging services, and zero-rated production materials, targeting 500,000 units of combined local production capacity by 2030 at 65% local content.
May 2024
The Stamp Duty (Amendment) Bill exempted producers of electric vehicles, batteries, and charging equipment employing at least 80% Ugandans and using 80% local raw materials, extending the localization incentive stack.
Oct 2023
The Bingwa multi-functional cargo trike, built by Kevoton Motions Engineering at the Kiira Motors Vehicle Plant in Jinja with 55% local content, was flagged off with initial capacity of 1,000 units per year and Uganda Development Bank project-preparation funding.
Report Structure

Table of Contents

1. Introduction
1.1 Study Assumptions & Definitions
1.2 Research Scope
1.3 Market Definition — Passenger & Load Carrier Three-Wheelers
1.4 Currency, Units & Conversion Basis
1.5 Years Considered — Historical 2021–2025, Forecast 2026–2030
2. Research Methodology
2.1 Research Framework
2.2 Secondary Research — Registration, Corridor Freight & Export Dispatch Data
2.3 Primary Research — 40+ Stakeholder Interviews
2.4 Market Estimation — Bottom-Up Volume Model
2.5 Segment Derivation — Marqstats-Reconciled Share Basis
2.6 Data Triangulation & Validation
2.7 Assumptions & Limitations
3. Executive Summary
3.1 Market Snapshot — Volume & Value
3.2 Key Findings by Segment
3.3 Key Findings by Region
3.4 CXO Perspective — A Cargo-Led, Assembly-Bound Market
3.5 Analyst Recommendations
4. Market Dynamics
4.1 Market Drivers
4.1.1 Agricultural Haulage & Rural Trade Demand
4.1.2 Manufacturing Incentives — Tax Holiday, VAT Exemption & Zero-Rated Materials
4.1.3 Import Affordability Recovery via the Northern Corridor
4.1.4 Charging Corridor Rollout & E-Bike Target
4.1.5 Urban & Secondary-Town Passenger Service Demand
4.2 Market Restraints
4.2.1 25% Import Duty on Built-Up Electric Vehicles
4.2.2 Financing Gaps for Owner-Drivers
4.2.3 Grid Reliability & Charging Concentration
4.2.4 Regulatory Friction in Kampala CBD
4.3 Market Trends
4.3.1 Local Assembly Momentum — Bingwa & the Kiira Ecosystem
4.3.2 Retrofit Electrification & Locally Assembled Batteries
4.3.3 Government Fleet Electrification Directive
4.3.4 Chinese Cargo Platform Proliferation
4.4 Market Opportunities
4.4.1 Boda-Boda Upgrade Conversion Funnel
4.4.2 Multi-Functional Rural Trike Applications
4.4.3 Institutional & Government Procurement
4.5 Industry Value Chain Analysis
4.6 Porter's Five Forces Analysis
4.6.1 Bargaining Power of Suppliers
4.6.2 Bargaining Power of Buyers
4.6.3 Threat of New Entrants
4.6.4 Threat of Substitutes
4.6.5 Intensity of Competitive Rivalry
5. Uganda Three-Wheeler Market Size & Growth Analysis
5.1 Market Size in Volume, Thousand Units (2021–2030)
5.2 Market Size in Value, USD Million (2021–2030)
5.3 Volume vs Value Growth Decomposition
5.4 Average Selling Price Analysis by Powertrain
5.5 Growth — Absolute & CAGR Bridge (2026–2030)
6. Uganda Three-Wheeler Market, By Vehicle Type
6.1 Segment Overview & Share Analysis (2025 vs 2030)
6.2 Passenger Carrier
6.2.1 Market Size in Volume, Thousand Units (2021–2030)
6.2.2 Market Size in Value, USD Million (2021–2030)
6.2.3 Peri-Urban & Secondary-Town Taxi Models
6.3 Load Carrier
6.3.1 Market Size in Volume, Thousand Units (2021–2030)
6.3.2 Market Size in Value, USD Million (2021–2030)
6.3.3 Cargo Configurations — Flatbed, Box Body & Multi-Functional Trikes
7. Uganda Three-Wheeler Market, By Fuel Type
7.1 Segment Overview & Share Analysis (2025 vs 2030)
7.2 Petrol
7.2.1 Market Size in Volume, Thousand Units (2021–2030)
7.2.2 Market Size in Value, USD Million (2021–2030)
7.2.3 Rural & Long-Route Workhorse Economics
7.3 Diesel
7.3.1 Market Size in Volume, Thousand Units (2021–2030)
7.3.2 Market Size in Value, USD Million (2021–2030)
7.3.3 Heavy-Cargo Niche & Contraction Drivers
7.4 CNG/LPG
7.4.1 Market Size in Volume, Thousand Units (2021–2030)
7.4.2 Market Size in Value, USD Million (2021–2030)
7.4.3 Conversion Activity Without a National Programme
7.5 Electric
7.5.1 Market Size in Volume, Thousand Units (2021–2030)
7.5.2 Market Size in Value, USD Million (2021–2030)
7.5.3 Local Assembly & Retrofit Pathways
7.5.4 Total Cost of Ownership vs Petrol Under the Duty Regime
8. Uganda Three-Wheeler Market, By Application Type
8.1 Segment Overview & Share Analysis (2025 vs 2030)
8.2 Passenger Transport
8.2.1 Market Size in Volume, Thousand Units (2021–2030)
8.2.2 Market Size in Value, USD Million (2021–2030)
8.2.3 Peri-Urban & Secondary-Town Route Structures
8.3 Last-mile Delivery/Logistics
8.3.1 Market Size in Volume, Thousand Units (2021–2030)
8.3.2 Market Size in Value, USD Million (2021–2030)
8.3.3 Kampala Courier & Hospital-Logistics Fleets
8.4 Goods Transportation
8.4.1 Market Size in Volume, Thousand Units (2021–2030)
8.4.2 Market Size in Value, USD Million (2021–2030)
8.4.3 Agricultural Evacuation & Market-Trader Haulage
8.5 Others (Municipal, Water, Vending)
8.5.1 Market Size in Volume, Thousand Units (2021–2030)
8.5.2 Market Size in Value, USD Million (2021–2030)
8.5.3 Multi-Functional & County Service Use Cases
9. Uganda Three-Wheeler Market, By End-User Ownership Model
9.1 Segment Overview & Share Analysis (2025 vs 2030)
9.2 Individual Owner/Drivers
9.2.1 Market Size in Volume, Thousand Units (2021–2030)
9.2.2 Market Size in Value, USD Million (2021–2030)
9.2.3 Hire-Purchase, Savings-Group & Asset-Finance Channels
9.3 Fleet Operators
9.3.1 Market Size in Volume, Thousand Units (2021–2030)
9.3.2 Market Size in Value, USD Million (2021–2030)
9.3.3 Delivery Aggregators & Agro-Processing Supply Chains
9.3.4 Battery-Financing Fleet Models
9.4 Government/Institutional Purchases
9.4.1 Market Size in Volume, Thousand Units (2021–2030)
9.4.2 Market Size in Value, USD Million (2021–2030)
9.4.3 Electric-and-Local Fleet Directive & Municipal Procurement
10. Uganda Three-Wheeler Market, By Region
10.1 Regional Share Analysis — Volume (2025 vs 2030)
10.2 Regional Growth Matrix — CAGR vs Fleet Size
10.3 Import Routing — Northern Corridor & Kampala Distribution
11. Kampala Metropolitan Deep Dive
11.1 Market Context — Cargo & Delivery Demand Core
11.1.1 Fleet Size & Renewal Estimates (2021–2030)
11.1.2 CBD Restrictions & Estate Feeder Routes
11.2 Operator Economics & the Second-Hand Market
11.2.1 Cargo vs Passenger Daily-Earnings Comparison
11.2.1.1 Used-Platform Price Bands & Vehicle Longevity
11.2.1.2 Replacement-Demand Linkage to the New-Unit Market
11.3 Retrofit & Battery Ecosystem
12. Eastern Uganda Deep Dive
12.1 Jinja — Kiira Vehicle Plant & Assembly Ecosystem
12.2 Busoga & Bugisu — Smallholder Cargo Demand
12.3 Boda-Boda Upgrade Pathway & First-Time Buyer Funnel
12.3.1 Conversion Economics — Two-Wheeler to Three-Wheeler Step-Up
12.3.2 Financing Availability & Dealer Channels
13. Northern Uganda, West Nile, Western & Central Regions
13.1 Gulu, Lira & Arua — Cross-Border Trade Demand
13.1.1 South Sudan & DRC Corridor Cargo Flows
13.1.2 Harvest-Linked Purchase Cycles
13.2 Mbarara, Fort Portal & Masaka — Secondary-City Growth
13.3 Kampala-Masaka E-Mobility Corridor — Rural Electric Testbed
14. Policy & Regulatory Environment
14.1 National E-Mobility Strategy — Net-Source Ambition & 2030 Targets
14.1.1 Local Manufacturing & Local-Content Targets
14.1.2 Public Transport & Motorcycle Electrification Goals
14.2 Fiscal Incentive Stack
14.2.1 10-Year Income Tax Holiday for EV & Battery Manufacturers
14.2.2 VAT Exemption on Local EVs & Charging Services
14.2.3 Zero-Rated Production Materials vs 25% Built-Up Import Duty
14.3 Investment Thresholds & Localization Qualification
14.4 Charging Infrastructure Rollout & Grid Considerations
14.5 Kampala Operating Regulations & Route Restrictions
15. Powertrain & Localization Economics
15.1 Total Cost of Ownership — Petrol vs Diesel vs Electric
15.1.1 Acquisition Cost & Financing Comparison
15.1.2 Running Cost per Kilometre by Powertrain
15.1.3 Payback Analysis for Cargo Operators
15.1.3.1 Rural Agricultural Haulage Duty Cycle Scenario
15.1.3.2 Kampala Delivery Duty Cycle Scenario
15.2 Local Assembly Cost Structure & Incentive Sensitivity
15.2.1 Incentive-Adjusted Landed vs Local-Build Cost Comparison
15.2.2 Local-Content Ramp & Break-Even Volume
15.3 Retrofit Conversion Economics
15.4 Powertrain Mix Forecast Scenarios to 2030
16. Import & Supply Chain Analysis
16.1 Chinese Shipment Flows & Landed Cost Structure
16.1.1 Northern Corridor Freight & Duty Build-Up
16.1.2 Exchange-Rate Pass-Through Sensitivity
16.2 Indian Export Dispatch Flows
16.3 Distributor & Dealer Network Structure
16.3.1 Kampala Dealer Yards & Regional Reach
16.3.2 Second-Hand Import & Refurbishment Channel
16.4 Local Assembly Supply Chain & Component Localization
17. Competitive Landscape
17.1 Market Share Analysis — National & Regional (2025)
17.2 Competitive Positioning Matrix
17.3 Chinese vs Indian vs Local Assembler Benchmarking
17.4 Pricing & Financing Strategy Comparison
17.5 Strategic Developments — Launches, Policy & Partnerships (2023–2026)
18. Company Profiles
18.1 Chongqing Zongshen Automobile Industry Co., Ltd.
18.1.1 Company Overview & Uganda Footprint
18.1.2 Product Portfolio — Three-Wheeler Platforms
18.1.3 Recent Developments & Strategy
18.2 Piaggio & C. S.p.A.
18.2.1 Company Overview & Uganda Footprint
18.2.2 Product Portfolio — Three-Wheeler Platforms
18.2.3 Recent Developments & Strategy
18.3 Bajaj Auto Limited
18.3.1 Company Overview & Uganda Footprint
18.3.2 Product Portfolio — Three-Wheeler Platforms
18.3.3 Recent Developments & Strategy
18.4 TVS Motor Company Limited
18.4.1 Company Overview & Uganda Footprint
18.4.2 Product Portfolio — Three-Wheeler Platforms
18.4.3 Recent Developments & Strategy
18.5 Loncin Motor Co., Ltd.
18.5.1 Company Overview & Uganda Footprint
18.5.2 Product Portfolio — Three-Wheeler Platforms
18.5.3 Recent Developments & Strategy
18.6 Lifan Technology (Group) Co., Ltd.
18.6.1 Company Overview & Uganda Footprint
18.6.2 Product Portfolio — Three-Wheeler Platforms
18.6.3 Recent Developments & Strategy
18.7 Jiangsu Jinpeng Group Co., Ltd.
18.7.1 Company Overview & Uganda Footprint
18.7.2 Product Portfolio — Three-Wheeler Platforms
18.7.3 Recent Developments & Strategy
18.8 Luoyang Dayang Trike Locomotive Co., Ltd.
18.8.1 Company Overview & Uganda Footprint
18.8.2 Product Portfolio — Three-Wheeler Platforms
18.8.3 Recent Developments & Strategy
18.9 Atul Auto Limited
18.9.1 Company Overview & Uganda Footprint
18.9.2 Product Portfolio — Three-Wheeler Platforms
18.9.3 Recent Developments & Strategy
18.10 Greaves Cotton Limited
18.10.1 Company Overview & Uganda Footprint
18.10.2 Product Portfolio — Three-Wheeler Platforms
18.10.3 Recent Developments & Strategy
18.11 Mahindra Last Mile Mobility Limited
18.11.1 Company Overview & Uganda Footprint
18.11.2 Product Portfolio — Three-Wheeler Platforms
18.11.3 Recent Developments & Strategy
18.12 Kiira Motors Corporation
18.12.1 Company Overview & Uganda Footprint
18.12.2 Product Portfolio — Three-Wheeler Platforms
18.12.3 Recent Developments & Strategy
18.13 Kevoton Motions Engineering Ltd.
18.13.1 Company Overview & Uganda Footprint
18.13.2 Product Portfolio — Three-Wheeler Platforms
18.13.3 Recent Developments & Strategy
18.14 GOGO Electric Limited
18.14.1 Company Overview & Uganda Footprint
18.14.2 Product Portfolio — Three-Wheeler Platforms
18.14.3 Recent Developments & Strategy
18.15 Watu Credit Limited
18.15.1 Company Overview & Uganda Footprint
18.15.2 Product Portfolio — Three-Wheeler Platforms
18.15.3 Recent Developments & Strategy
18.16 Dura Motors Uganda Limited
18.16.1 Company Overview & Uganda Footprint
18.16.2 Product Portfolio — Three-Wheeler Platforms
18.16.3 Recent Developments & Strategy
19. Appendix
19.1 Abbreviations & Glossary
19.2 List of Tables
19.3 List of Figures
19.4 Sources & References
19.5 Customization Options
19.6 Disclaimer
Study Scope & Focus

Coverage & Segmentation

This report quantifies the Uganda three wheeler market in volume (thousand units) and value (USD million) across a 2021-2025 historical period and a 2026-2030 forecast period, with 2025 as the base year. Segmentation covers vehicle type (passenger carrier, load carrier), fuel type (petrol, diesel, CNG/LPG, electric), application (passenger transport, last-mile delivery/logistics, goods transportation, others), and end-user ownership model (individual owner/drivers, fleet operators, government/institutional purchases), with regional assessment across Kampala Metropolitan, Eastern Uganda, Northern Uganda and West Nile, and Western and Central Uganda. The competitive assessment profiles 16 manufacturers, distributors, and e-mobility ventures. Uganda's demand structure is assessed alongside continental patterns documented in the Africa two wheeler market, whose import, financing, and electrification dynamics closely parallel the tricycle segment.

The study evaluates the manufacturing incentive framework, powertrain transition economics, financing models, and competitive positioning to support market-entry, localization, and procurement decisions by OEMs, assemblers, distributors, financiers, and development institutions. Forecasts incorporate announced policy commitments with funded programmes and published deployment schedules; speculative initiatives without funding are excluded from the base case. The electric adoption path is modelled on local assembly and retrofit capacity ramping against the incentive framework rather than on import-led scenarios, given the 25% duty on built-up units, and the cargo segment forecast is anchored to agricultural output and district-market trade patterns that historically track tricycle demand more closely than urban indicators do.
Frequently Asked Questions

FAQs About the Uganda Three-Wheeler Market

The Uganda three-wheeler market recorded 41.08 thousand units in 2025 and is projected to reach 58.42 thousand units by 2030. In value terms, the market stood at USD 179.99 million in 2025, reaching USD 273.65 million by 2030.
The market expands at a 7.00% volume CAGR during 2026–2030, with value growing faster at 8.43% owing to mix enrichment toward electric and heavier cargo variants.
Passenger carriers dominate with 72.00% of 2025 volume, while load carriers hold 28.00% — the highest cargo share in East Africa — and grow faster at a 8.48% CAGR on agricultural haulage demand.
Chinese brands led by Zongshen dominate Kampala retail on landed cost, supported by Loncin, Lifan, and Dayang, while Piaggio, Bajaj, and TVS anchor the established passenger taxi segment; a local assembly tier around Kiira Motors and GOGO is emerging.
Electric three-wheelers are the fastest growing segment at a 35.36% CAGR, rising from 2.50% of volume in 2025 to 10.50% by 2030, driven by a 10-year manufacturer tax holiday, VAT exemption on local EVs, and a 25% duty on built-up imports that favours local assembly.
Chongqing Zongshen Automobile Industry Co., Ltd., Piaggio & C. S.p.A., Bajaj Auto Limited, TVS Motor Company Limited, Loncin Motor Co., Ltd., Lifan Technology (Group) Co., Ltd., Jiangsu Jinpeng Group Co., Ltd., Luoyang Dayang Trike Locomotive Co., Ltd., Atul Auto Limited, Greaves Cotton Limited, Mahindra Last Mile Mobility Limited, Kiira Motors Corporation, Kevoton Motions Engineering Ltd., GOGO Electric Limited, Watu Credit Limited, and Dura Motors Uganda Limited.
The report is delivered as a PDF (250+ pages), Excel data tables, and a PPT summary deck with analyst email support. Marqstats offers 20% complimentary customization on additional segments, regions, or data.