Market Snapshot
Key Takeaways
Market Overview & Analysis
Report Summary
The Kenya three wheeler market covers passenger-carrier and load-carrier three wheeled vehicles sold nationally, spanning petrol, diesel, CNG/LPG, and electric powertrains. The study quantifies the market in volume (thousand units) and value (USD million) across 2021-2025 historical and 2026-2030 forecast horizons, with 2025 as the base year. Kenya is an import-dependent market supplied principally from India, with Piaggio, Bajaj, and TVS product landed through established distributors; Piaggio's Ape franchise, distributed exclusively by Car & General since 2002, holds the number one position in the tuk tuk segment.
Demand contracted through 2022 as currency weakness and elevated freight costs compressed affordability, with volumes at 38.58 thousand units, before recovering to 48.51 thousand units in 2025 on shilling stabilization and restocking by coastal operators. Registration series compiled by the Kenya National Bureau of Statistics corroborate the recovery, and Marqstats reconciles these records against Indian export dispatches and distributor channel checks to produce the volume series underlying this report. Value growth outpaces volume growth over the forecast period owing to mix enrichment toward electric variants carrying higher average selling prices on a 2025 blended base near USD 4,340 per unit.
The defining forecast-period dynamic is electrification. Kenya's electric vehicle fleet expanded to roughly 35,000 units at the end of 2025 from 5,294 a year earlier according to Kenya Power data, and the February 2026 arrival of battery-swapping tuk tuk platforms in Nairobi extends that momentum from motorcycles into the three wheeler segment. The market adds 21.84 thousand annual units between 2025 and 2030, with electric variants contributing a disproportionate share of incremental demand.
Pricing and financing shape effective demand. New petrol passenger tuk tuks retail from roughly KES 500,000-700,000, diesel cargo platforms command premiums for payload capacity, and factory electric models carry higher sticker prices that are recovered through energy and maintenance savings within the first one to two years of commercial operation. Hire-purchase terms offered through distributor networks and asset financiers determine purchase timing for the owner-driver majority, and the arrival of swap-subscription models decouples battery cost from vehicle acquisition, compressing the electric affordability gap that has historically slowed adoption.
Market Dynamics
Key Drivers
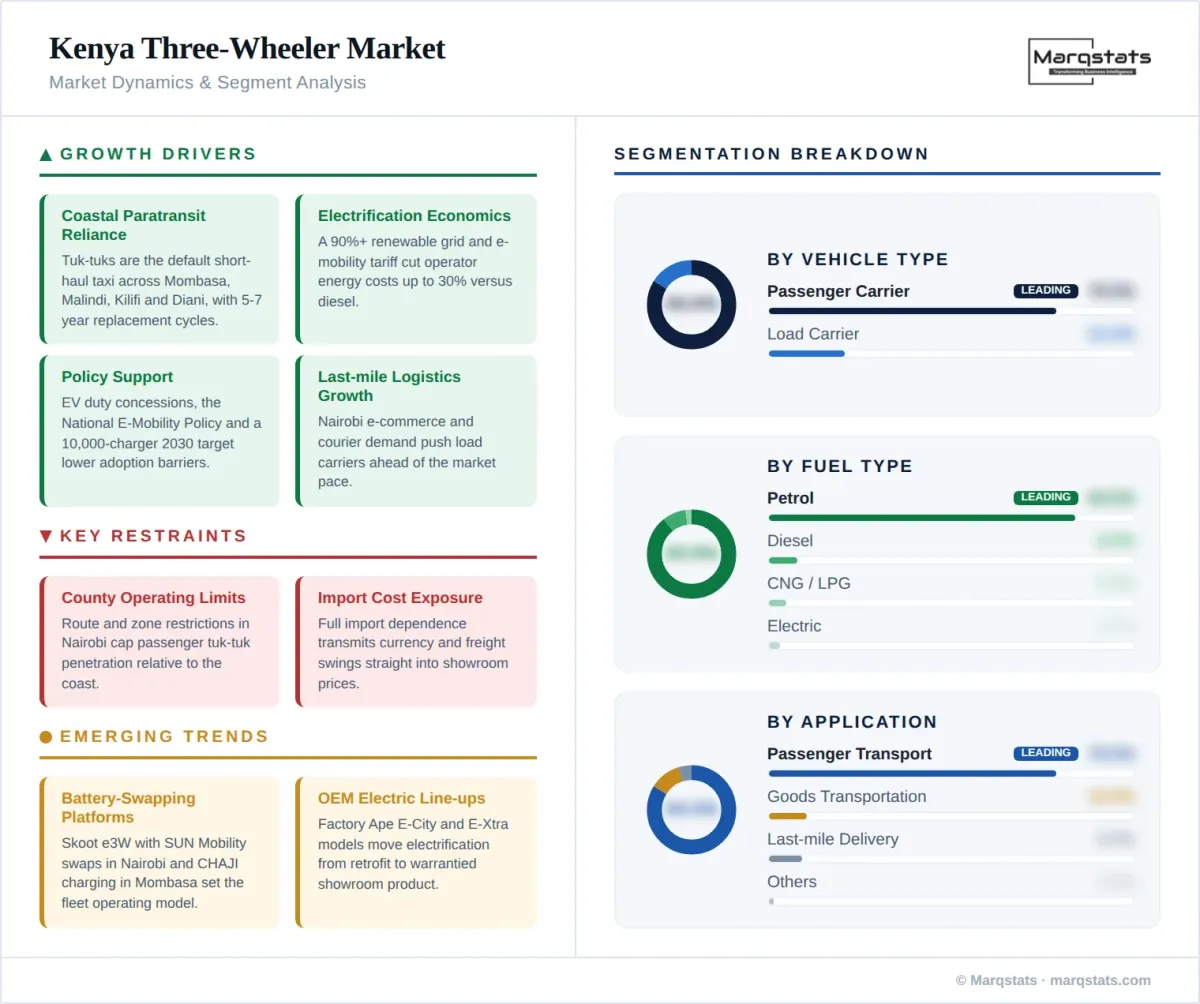
- Coastal paratransit dependence: tuk tuks provide the backbone of short-haul passenger movement across Mombasa, Malindi, Kilifi, Watamu, and Diani, where narrow streets and tourist flows sustain dense taxi fleets and five-to-seven-year replacement cycles.
- Electrification economics: with a grid over 90% renewable and a dedicated e-mobility tariff, electric tuk tuk operators in Nairobi save up to 30% on daily energy costs versus diesel, with battery swaps priced near KES 650 per 150 kilometres against roughly KES 850 for fuel.
- Policy support: duty concessions for electric vehicles, the National E-Mobility Policy framework, and a target of 10,000 public charging stations by 2030 lower adoption barriers across the powertrain transition.
- Distribution depth: dealership expansion into secondary towns such as Kitui extends sales, parts, and service coverage beyond Nairobi and the coast, widening the addressable buyer base.
- Last-mile logistics growth: e-commerce, food delivery, and market-trader distribution in Nairobi and Kisumu push load-carrier demand at a 9.36% CAGR, ahead of the 7.40% market average.
Key Restraints
- County-level operating restrictions: tuk tuks face route and zone limitations in parts of Nairobi and other urban centres, capping addressable passenger demand relative to coastal markets.
- Financing gaps: elevated interest rates and thin credit histories keep much of the owner-driver purchase activity in cash or informal hire-purchase channels, slowing fleet renewal.
- Import cost exposure: full dependence on imported vehicles transmits currency movements and ocean freight costs directly into showroom prices, as the 2022 affordability squeeze demonstrated.
- Charging infrastructure concentration: public charging and swap coverage remains concentrated in Nairobi and Mombasa, constraining electric adoption in secondary towns during the early forecast years.
Key Trends
- Battery-swapping platforms: the Skoot e3W launch in Nairobi with SUN Mobility swap infrastructure, alongside CHAJI charging deployments in Mombasa, establishes the operating model for commercial electric tuk tuk fleets.
- OEM electric line-ups: factory electric models such as the Ape E-City FX Max (passenger) and Ape E-Xtra FX Max (cargo) shift electrification from retrofit experiments to warrantied showroom product.
- Kisumu pilot corridors: 2025 electric tuk tuk pilots with transport authorities extend the powertrain transition to the Lake Region beyond the two primary cities.
- Fleet aggregation: platform operators pairing vehicles with telematics, swap subscriptions, and structured maintenance grow at 8.94% CAGR, professionalizing a historically informal segment.
Market Segmentation
Passenger carriers accounted for 79.00% of 2025 volume at 38.32 thousand units and are projected to reach 54.17 thousand units by 2030 at a 6.85% CAGR. Demand concentrates in coastal taxi fleets and Kisumu, where three-passenger configurations dominate short-haul routes, with petrol 200-230 cc platforms forming the volume core.
Load carriers held 21.00% of 2025 volume at 10.19 thousand units and grow faster at a 9.36% CAGR to 16.18 thousand units by 2030. Heavier 435 cc diesel cargo platforms serve construction material movement and wholesale distribution, while electric cargo variants gain traction in urban delivery applications.
Petrol remained the dominant fuel at 84.00% of 2025 volume, or 40.75 thousand units, yet grows slowest at a 5.89% CAGR as elevated pump prices and electric alternatives erode its position; its share declines to 78.30% of volume by 2030.
Diesel held an 8.00% share in 2025, concentrated in heavier 435 cc cargo tuk tuks serving construction and wholesale haulage, and contracts at a -1.80% CAGR as operators weigh elevated fuel costs against payload advantages and as electric cargo variants with comparable carrying capacity mature. The segment slips to 5.20% of volume by 2030 while retaining its niche among high-utilization cargo operators.
CNG/LPG variants held a marginal 5.00% of 2025 volume. Without a national gas-mobility programme comparable to Nigeria's, and with limited refuelling infrastructure outside pilot activity, adoption rests on scattered LPG conversions; the segment holds a broadly flat 5.50% share by 2030, expanding modestly from a small base at a 9.45% CAGR without gaining structural ground.
Electric three wheelers are the fastest growing segment, expanding from 1.46 thousand units in 2025 to 7.74 thousand units by 2030 at a 33.56% CAGR. Policy direction set out in the National E-Mobility Policy framework published by the Ministry of Roads and Transport, combined with duty concessions, the e-mobility electricity tariff, and battery-swapping networks arriving in Nairobi, moves electric tuk tuks from pilot activity to commercial fleet deployment across the forecast period.
Passenger transport represented 79.00% of 2025 volume, mirroring the passenger-carrier base, and grows at a 6.85% CAGR. Tuk tuk taxis remain the most affordable motorized mode for 2-8 kilometre trips in coastal towns and lakeside urban centres.
Last-mile delivery is the fastest growing application at a 12.66% CAGR, rising from 4.37 thousand units in 2025 to 8.09 thousand units by 2030 as e-commerce platforms and courier networks in Nairobi contract dedicated tricycle fleets, increasingly electric.
General goods transportation accounted for 10.50% of 2025 volume at 5.09 thousand units, growing at a 6.35% CAGR on market-trader haulage, agricultural produce movement, and wholesale distribution in secondary towns.
Other applications, including municipal services, waste collection, and mobile vending, held 1.50% of 2025 volume and grow at a 7.40% CAGR alongside county service contracting.
Individual owner-drivers purchased 67.00% of 2025 volume at 32.50 thousand units, growing at a 6.59% CAGR. Ownership remains the primary livelihood model, financed through distributor hire-purchase schemes and savings groups.
Fleet operators accounted for 31.00% of 2025 volume and outpace the market at a 8.94% CAGR to 23.43 thousand units by 2030, propelled by swap-subscription electric platforms, delivery aggregators, and tourism-sector transport contracts.
Government and institutional purchases held 2.00% of 2025 volume and grow at a 9.45% CAGR, reflecting county service procurement and development-programme pilot deployments such as the Kisumu corridors.
By Geography
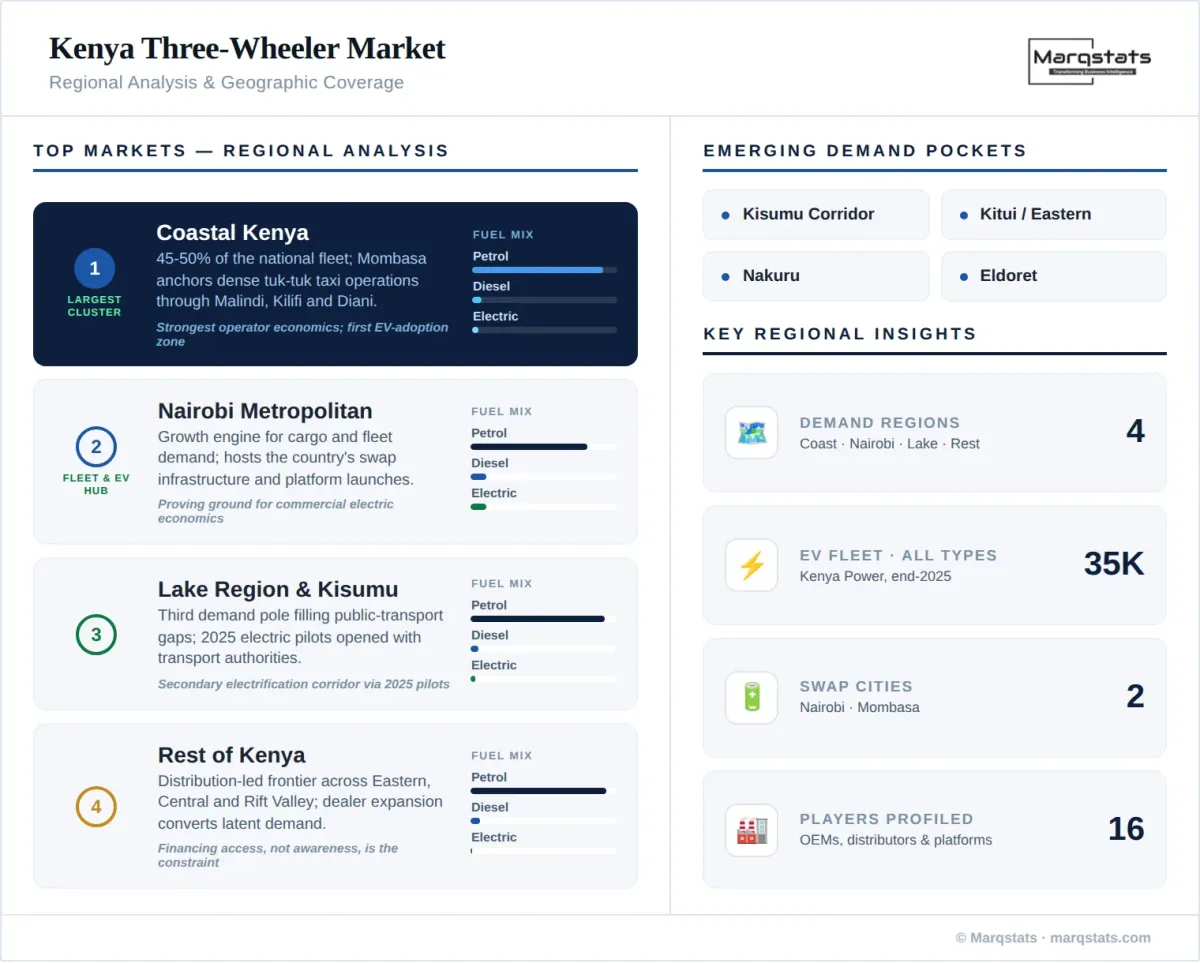
Coastal Kenya
The coastal belt is the heartland of the Kenya three wheeler market, accounting for an estimated 45-50% of the national fleet. Mombasa anchors the region, with dense tuk tuk taxi operations extending through Malindi, Kilifi, Watamu, and Diani, where tourism flows and narrow historic street grids favour tricycles over larger vehicles. Charging deployments in Mombasa, including a 30-station smart-socket network, make the coast an early electric adoption zone alongside its petrol fleet core.
Coastal demand carries a pronounced seasonal rhythm tied to the tourism calendar, with fleet utilization and replacement purchases peaking around high season. Operator economics on the coast are the strongest in the country owing to short average trip lengths, high daily trip counts, and premium tourist fares, which supports faster fleet renewal than the national average and makes coastal operators the first commercial audience for total-cost-of-ownership pitches from electric entrants.
Nairobi Metropolitan
Nairobi is the growth engine for cargo and fleet applications. County route restrictions limit passenger tuk tuk penetration in the central business district, so demand skews toward last-mile delivery, wholesale distribution, and estate-level passenger service in peri-urban corridors. The capital hosts the country's battery-swapping infrastructure and its fleet-platform launches, making it the proving ground for commercial electric three wheeler economics.
Operator arithmetic in the capital illustrates the electric case: a driver covering 150 kilometres daily spends roughly KES 650 on battery swaps against approximately KES 850 on diesel, a saving near 30% on the single largest operating cost line before accounting for lower maintenance on electric drivetrains. Two years of local road testing under varied load and surface conditions preceded the first commercial swap-platform launch, and the resulting cost data now anchors financing conversations between fleet aggregators, asset lenders, and delivery platforms evaluating electric cargo tricycles at scale.
Lake Region and Kisumu
Kisumu and the surrounding Lake Region form the third demand pole, where tuk tuks fill public transport gaps in lakeside towns. Electric tuk tuk pilots launched with transport authorities in 2025 position the region as a secondary electrification corridor, while petrol passenger carriers continue to dominate the installed base.
Rest of Kenya
Secondary towns across Eastern, Central, and Rift Valley counties represent the frontier of distribution-led growth. Dealership expansion into towns such as Kitui extends sales and after-sales coverage, converting latent demand among traders and boda boda operators upgrading to three wheelers for higher payload and weather-protected passenger service. Agricultural produce movement between farm gates and county markets forms the core cargo use case in these regions, and financing availability through dealer hire-purchase programmes, rather than product awareness, is the principal constraint on conversion; each new dealership measurably lifts local registrations within its first operating year.
How Competition Is Evolving
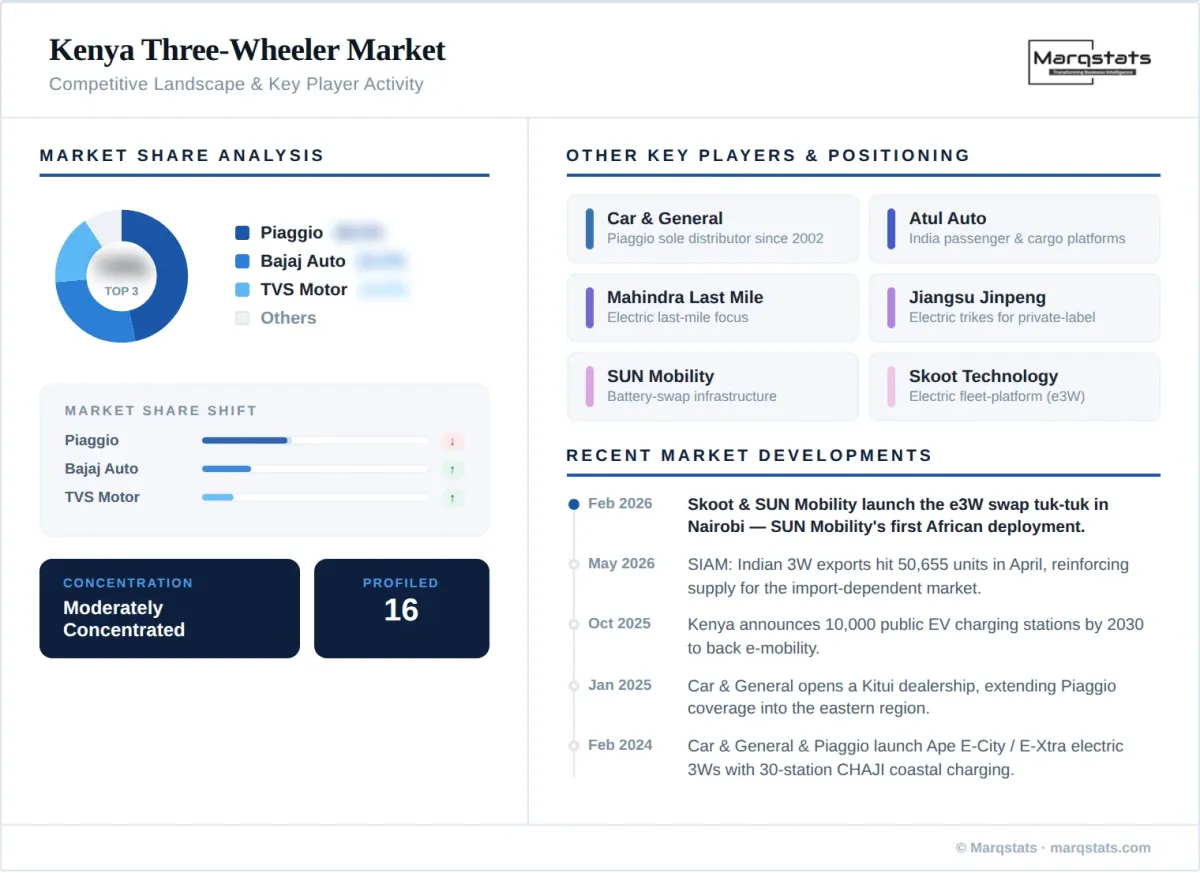
The market is moderately concentrated around three Indian-manufactured franchises. Piaggio & C. S.p.A. holds the number one position in the Kenyan tuk tuk segment through Car & General (Trading) Limited, its sole distributor since 2002, with the Ape range spanning petrol 200-230 cc passenger models, 435 cc diesel cargo platforms, and the factory electric E-City FX Max and E-Xtra FX Max variants. Bajaj Auto Limited and TVS Motor Company Limited compete through their RE and King platforms respectively, supported by established parts and financing channels.
Electrification is opening a second competitive front. Skoot Technology's e3W launch with SUN Mobility battery-swapping infrastructure introduces a fleet-platform model that bundles vehicle, energy subscription, and digital tools, while Kenyan EV ventures and Chinese manufacturers, including Jiangsu Jinpeng, supply electric tricycles to distributors seeking private-label programmes. Incumbents respond with factory electric models and charging partnerships, such as the CHAJI deployment in Mombasa.
Competition centres on total cost of ownership, financing access, and service reach. Distribution networks built over two decades constitute the primary moat: spare-parts pipelines, trained mechanics, and county-level dealer coverage determine operator uptime, and new entrants are pursuing distributor partnerships rather than open retail channels to access the market.
The next competitive phase turns on energy infrastructure control. Whoever owns the swap-station and charging footprint in Nairobi and Mombasa will influence which electric vehicle brands fleet operators standardize on, mirroring the pattern already visible in Kenya's electric motorcycle segment. Incumbent distributors hold the service advantage; energy-platform entrants hold the operating-cost advantage; and partnerships pairing the two, as the Skoot and Car & General arrangement demonstrates, are emerging as the dominant go-to-market structure for the electric transition.
Companies Covered
The report profiles 16+ companies with full strategy and financials analysis, including:
Recent Market Activity
Table of Contents
Coverage & Segmentation
This report quantifies the Kenya three wheeler market in volume (thousand units) and value (USD million) across a 2021-2025 historical period and a 2026-2030 forecast period, with 2025 as the base year. Segmentation covers vehicle type (passenger carrier, load carrier), fuel type (petrol, diesel, CNG/LPG, electric), application (passenger transport, last-mile delivery/logistics, goods transportation, others), and end-user ownership model (individual owner/drivers, fleet operators, government/institutional purchases), with regional assessment across Coastal Kenya, Nairobi Metropolitan, the Lake Region, and the Rest of Kenya. The competitive assessment profiles 16 manufacturers, distributors, and e-mobility platforms. Kenya's demand structure is assessed alongside continental patterns documented in the Africa two wheeler market, whose import, financing, and electrification dynamics closely parallel the tricycle segment.
The study evaluates powertrain transition economics, county regulatory settings, financing models, and competitive positioning to support market-entry, portfolio, and procurement decisions by OEMs, distributors, fleet platforms, financiers, and development institutions. Forecasts incorporate announced policy commitments and infrastructure rollout schedules; speculative programmes without funding are excluded from the base case.