Statistics & Highlights

Market Snapshot

Market size in Thousand Units
36K Units
2025
Base year
38K Units
2026
Estimated
  
51K Units
2030
Forecast
Largest market
Dar es Salaam
Fastest growing
Electric (Fuel Type)
Dominant segment
Passenger Carrier
Concentration
Moderately Concentrated
CAGR
7.00%
2026 – 2030
GROWTH
+15K Units
Absolute
STUDY PARAMETERS
Base year2025
Historical period2021 – 2025
Forecast period2026 – 2030
Units consideredVolume (Thousand Units)
REPORT COVERAGE
Segments covered4
Regions covered1
Companies profiled16+
Report pages250+
DeliverablesPDF, Excel, PPT
Executive Summary

Key Takeaways

Tanzania three wheeler market recorded 35.51 thousand units in 2025, projected to reach 50.51 thousand units by 2030 at 7.00% CAGR.
Market value stood at USD 161.02 million in 2025 and is forecast to reach USD 244.81 million by 2030 at 8.44% CAGR.
Passenger carriers held 80.00% of 2025 volume, with 100,000+ bajaji taxis in Dar es Salaam supporting an estimated 50,000 direct jobs.
Electric three wheelers are the fastest growing segment at 33.45% CAGR, rising from 4.00% to 15.00% of volume by 2030, the highest electric penetration in the pack.
Lease-to-own and battery-swapping models cut energy costs to about one-sixth of petrol, delivering payback within six to eight months.
Fleet operators expand at 9.22% CAGR as electric mobility ventures build managed bajaji fleets with swap and charging infrastructure.
Market Insights

Market Overview & Analysis

Report Summary

The Tanzania three wheeler market covers passenger-carrier and load-carrier three wheeled vehicles sold nationally, spanning petrol, diesel, CNG/LPG, and electric powertrains. The study quantifies the market in volume (thousand units) and value (USD million) across 2021-2025 historical and 2026-2030 forecast horizons, with 2025 as the base year. Tanzania is an import-dependent conventional market supplied principally from India, dominated by the TVS King, Bajaj RE, and Piaggio Ape, with an increasingly significant domestically assembled electric layer supplied by local e-mobility ventures.

Demand contracted to 28.47 thousand units in 2022 as shilling weakness and elevated freight costs compressed import affordability, before recovering to 35.51 thousand units in 2025 on currency stabilization and dealer restocking. The electric transition is coordinated in part through the UNEP Global Electric Mobility Programme, which supports Tanzania's e-mobility policy alongside the SOLUTIONSplus city network in Dar es Salaam. Marqstats reconciles continental demand against Indian export dispatches, national registration records, and distributor channel checks to produce the volume series underlying this report, with value growth outpacing volume growth on mix enrichment toward electric variants.

The forecast period is defined by the maturation of the electric bajaji business model. Local ventures deploying lease-to-own and battery-swapping schemes have moved from pilot fleets to commercial operations, with plans for domestic assembly plants in Dar es Salaam, and international electric mobility companies have entered with battery-swapping networks. The market adds 15.00 thousand annual units between 2025 and 2030, with electric platforms contributing a rising share of incremental demand as swap infrastructure and financing scale.

Driver economics anchor the electric case. A conventional bajaji covers roughly 20 kilometres on a litre of petrol costing about USD 1.20, while the same distance on electricity costs approximately USD 0.20, and drivers on home charging report daily energy spend of only TZS 2,500-5,000. These savings, combined with lower maintenance from fewer moving parts and automatic transmission convenience, offset the electric price premium within six to eight months, making the lease-to-own pathway financially compelling for professional drivers.

The bajaji sector is a significant employer and a carefully balanced ecosystem. The market sustains an estimated 50,000 direct jobs, and business models linking drivers, driver associations, and investors have matured over the past 10-15 years into a stable equilibrium. This social structure shapes the pace of change: the electric transition advances fastest where it improves driver take-home earnings without disrupting association relationships, which is why lease-to-own models that convert drivers into owners have gained traction over approaches that threaten existing livelihoods.

Market Dynamics

Key Drivers

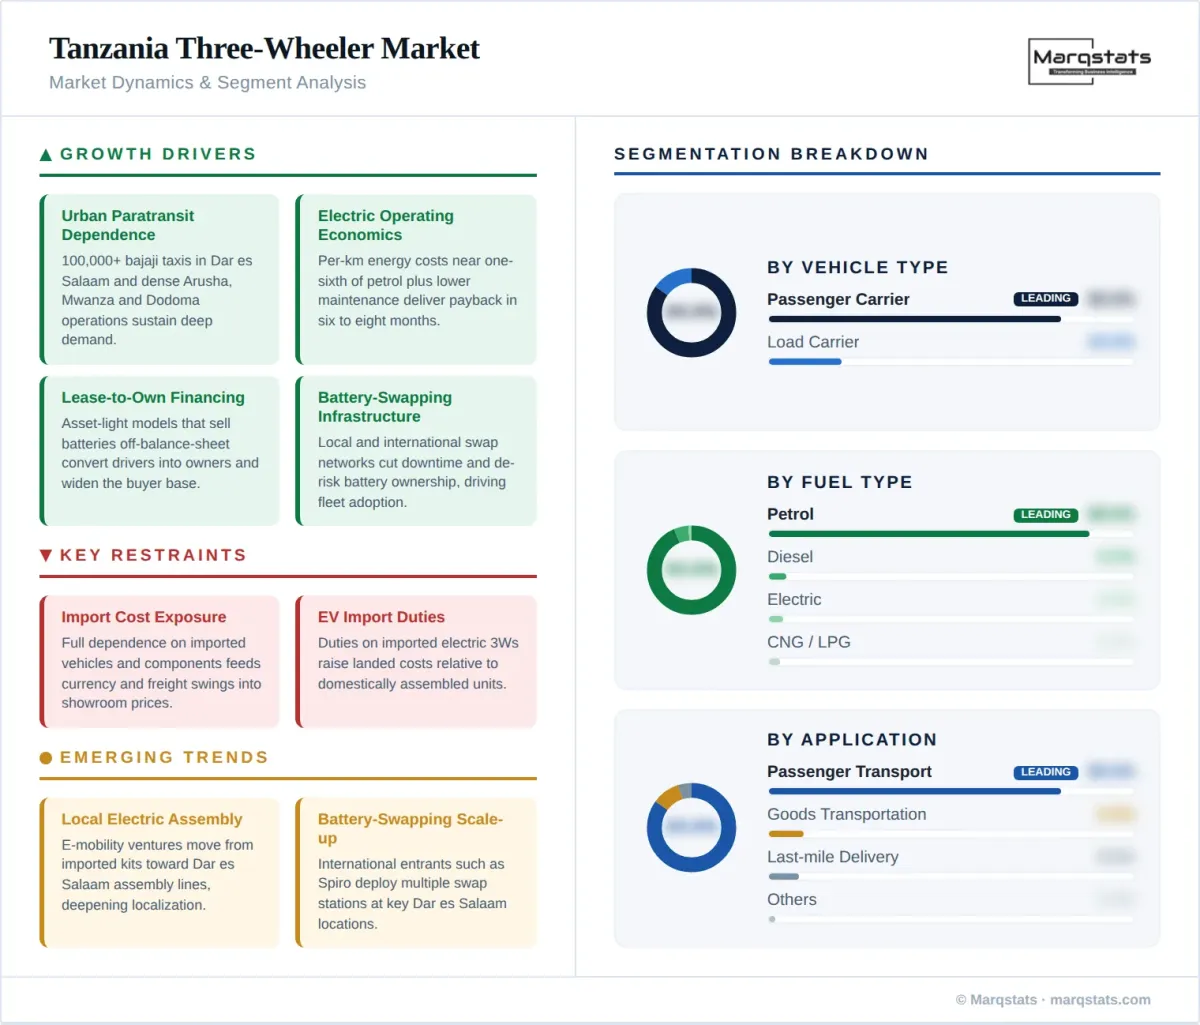
  • Urban paratransit dependence: with over 100,000 bajaji taxis in Dar es Salaam and dense operations in Arusha, Mwanza, and Dodoma, the tricycle carries a large share of short-haul passenger movement, sustaining deep replacement and expansion demand.
  • Electric operating economics: per-kilometre energy costs of roughly one-sixth of petrol, plus lower maintenance and automatic transmission, deliver payback within six to eight months and drive electric adoption.
  • Lease-to-own financing: asset-light models that sell batteries off the balance sheet and lease vehicles to drivers lower upfront barriers and expand the addressable buyer base among professional drivers.
  • Battery-swapping infrastructure: swap networks deployed by local and international ventures cut refuelling downtime and de-risk battery ownership, accelerating fleet-led electric deployment.
  • Policy support: excise duty exemptions for electric vehicles and coordination through the UNEP Global Electric Mobility Programme and SOLUTIONSplus create a conducive environment for e-mobility investment.

Key Restraints

  • Import cost exposure: full dependence on imported conventional vehicles and electric components transmits currency movements and freight costs directly into showroom prices.
  • Import duties on electric vehicles: while excise exemptions apply, import duties on electric three wheelers still raise landed costs relative to domestically assembled units, favouring local production.
  • Financing constraints: elevated interest rates and informal driver incomes limit access to conventional credit, keeping much purchase activity dependent on lease-to-own and hire-purchase structures.
  • Ecosystem preservation: established relationships among drivers, driver associations, and investors require careful handling, as disruptive change risks resistance from operators fearing loss of livelihood.

Key Trends

  • Local electric assembly: e-mobility ventures are moving from imported kits toward domestic assembly lines in Dar es Salaam, deepening localization and shortening supply chains.
  • Battery-swapping scale-up: international electric mobility companies have entered Tanzania with multiple swap stations at key Dar es Salaam locations, complementing home-charging models.
  • Fleet and lease-to-own growth: professionally managed and driver-owned electric fleets expand at 9.22% CAGR as financing structures mature and gross margins improve.
  • Secondary-city expansion: electric bajaji deployment extends beyond Dar es Salaam to Dodoma and Arusha as operating-cost advantages prove out across urban centres.
Tanzania Three Wheeler Market Market Dynamics Segment Analysis Infographic
Segment Analysis

Market Segmentation

Passenger Carrier
Leading

Passenger carriers accounted for 80.00% of 2025 volume at 28.41 thousand units and are projected to reach 39.40 thousand units by 2030 at a 6.46% CAGR. The bajaji anchors the segment as the default urban taxi, carrying three passengers plus driver and providing accessible transport across Dar es Salaam, Arusha, Mwanza, and Dodoma, with electric variants concentrating in this passenger-taxi core.

Load Carrier

Load carriers held 20.00% of 2025 volume at 7.10 thousand units and grow faster at a 9.04% CAGR to 11.11 thousand units by 2030. Cargo tricycles serve market distribution, construction supply, and last-mile delivery in urban centres, with demand rising as e-commerce and structured logistics expand.

Petrol
Leading

Petrol remained dominant at 88.00% of 2025 volume, or 31.25 thousand units, yet grows slowest at a 4.42% CAGR as electric alternatives scale; its share declines to 78.00% of volume by 2030 while remaining the workhorse for operators outside the electric-fleet corridors.

Diesel

Diesel held a 5.00% share in 2025, concentrated in heavier cargo applications, and contracts at a 1.14% CAGR through 2030 as fuel costs and electric cargo alternatives erode its niche.

CNG/LPG

CNG/LPG variants held a marginal 3.00% of 2025 volume. Without a national gas-mobility programme or refuelling infrastructure, adoption rests on scattered LPG conversions, and the segment holds a broadly flat 3.20% share by 2030 at a 8.38% CAGR, overshadowed by the electric transition.

Electric

Electric three wheelers are the fastest growing segment and the market's defining story, expanding from 1.42 thousand units in 2025 to 7.58 thousand units by 2030 at a 33.45% CAGR, the highest electric penetration in the East African pack. Coordinated through the UNEP Global Electric Mobility Programme and the SOLUTIONSplus city network, adoption is driven by lease-to-own economics, battery-swapping infrastructure, and emerging domestic assembly, concentrating in Dar es Salaam before extending to Dodoma and Arusha.

Passenger Transport
Leading

Passenger transport represented 80.00% of 2025 volume, mirroring the passenger-carrier base, and grows at a 6.46% CAGR. The bajaji remains the most affordable motorized mode for short urban trips, and electric passenger taxis lead the powertrain transition within this application.

Last-mile Delivery/Logistics

Last-mile delivery is the fastest growing application at a 12.51% CAGR, rising from 3.02 thousand units in 2025 to 5.56 thousand units by 2030 as e-commerce and courier operations in Dar es Salaam contract dedicated tricycle fleets, increasingly electric.

Goods Transportation

General goods transportation accounted for 9.50% of 2025 volume at 3.37 thousand units, growing at a 5.85% CAGR on market-trader haulage, agricultural produce movement, and construction supply in urban and peri-urban areas.

Others

Other applications, including municipal services, waste collection, and mobile vending, held 2.00% of 2025 volume and grow at a 7.00% CAGR alongside city service contracting.

Individual Owner/Drivers
Leading

Individual owner-drivers purchased 66.00% of 2025 volume at 23.44 thousand units, growing at a 5.66% CAGR. Ownership remains the primary livelihood model, increasingly financed through lease-to-own structures that convert drivers into owners over the contract term.

Fleet Operators

Fleet operators accounted for 32.00% of 2025 volume, the highest fleet share in the pack, and outpace the market at a 9.22% CAGR to 17.93 thousand units by 2030, propelled by electric mobility ventures building managed bajaji fleets with swap and charging infrastructure.

Government/Institutional Purchases

Government and institutional purchases held 2.00% of 2025 volume and grow at a 11.77% CAGR, reflecting municipal service procurement and pilot electric deployments supported by international development programmes.

Regional Analysis

By Geography

Dar es Salaam

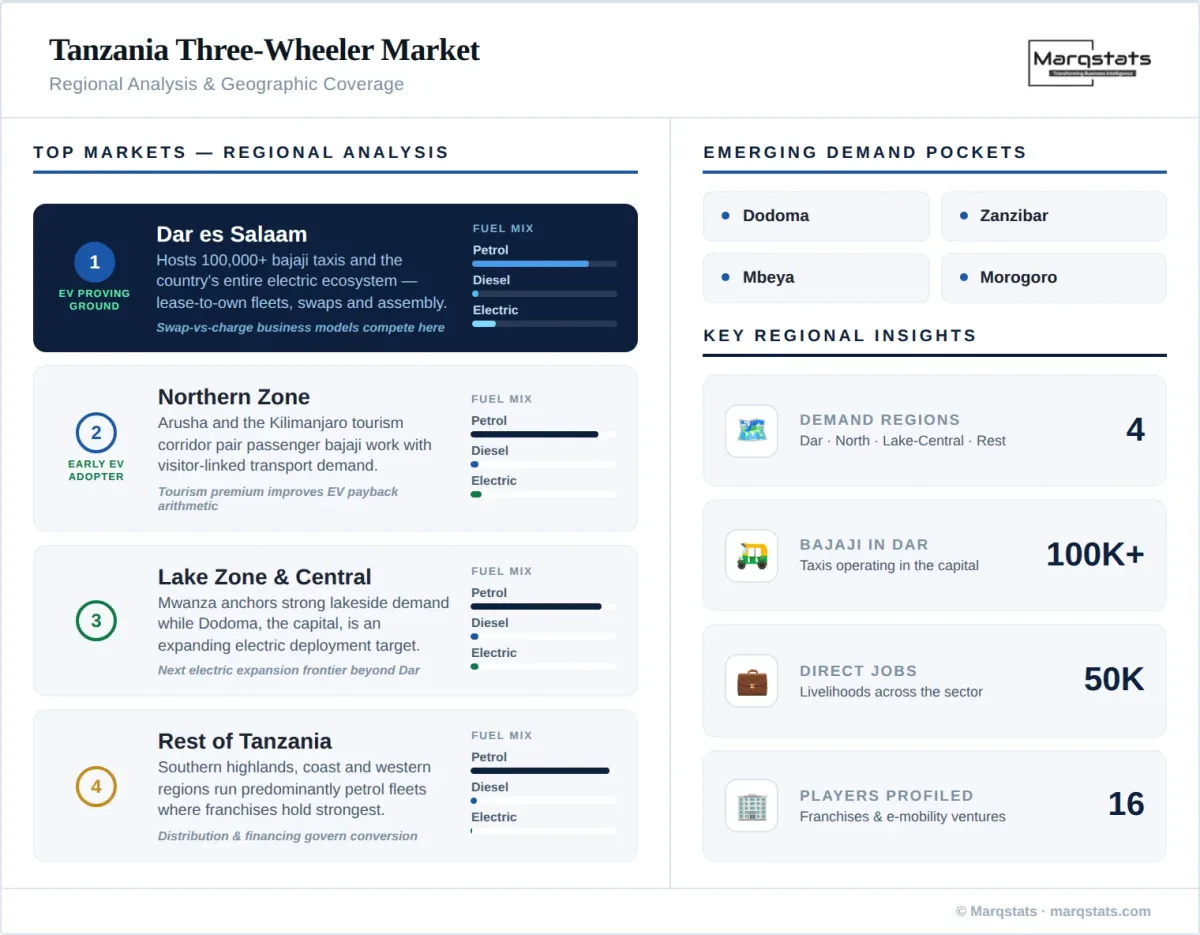
Dar es Salaam is the heart of the market, hosting more than 100,000 bajaji taxis and the country's entire electric bajaji ecosystem. The commercial capital anchors lease-to-own fleets, battery-swapping networks, and planned domestic assembly, making it the proving ground for electric three wheeler economics. Dense passenger operations across Kimara, Mwenge, and the city's arterial corridors sustain the deepest replacement and conversion demand in the country.

The city is also where the swap-versus-charge business models compete directly. Home-charging drivers report daily energy spend of TZS 2,500-5,000, while swap-based operators trade a per-swap fee for zero battery ownership and minimal downtime; ventures selling batteries off their balance sheet favour the swap model to protect gross margins, whereas driver-owners weighing long-run cost lean toward home charging. This live comparison, playing out across thousands of Dar es Salaam bajajis, is generating the operating data that will shape which model scales nationally as the transition extends to Dodoma and Arusha.

Northern Zone (Arusha and Kilimanjaro)

Arusha and the northern tourism corridor combine passenger bajaji operations with visitor-linked transport demand. The region is an early secondary market for electric deployment, with e-mobility ventures citing Arusha alongside Dar es Salaam as a priority city, supported by the area's commercial activity and tourism economy.

Tourism gives the northern zone a demand profile distinct from the coast: safari-gateway traffic and hospitality-linked movement create premium short-haul routes where the bajaji's quiet, emission-free electric operation is a marketable feature rather than merely a cost saving. Operators serving visitor districts can command higher fares, improving the payback arithmetic on electric units and positioning Arusha as a natural early adopter once swap or charging coverage reaches the region.

Lake Zone and Central (Mwanza and Dodoma)

Mwanza anchors the Lake Zone with strong passenger and cargo bajaji demand serving the lakeside economy, while Dodoma, the capital, is an expanding electric deployment target as government presence and urban growth lift transport demand. Both cities represent the electric transition's next expansion frontier beyond Dar es Salaam.

Rest of Tanzania

Secondary towns across the southern highlands, coastal belt, and western regions sustain predominantly petrol bajaji fleets serving passenger and agricultural haulage needs. Distribution reach and financing availability, rather than product awareness, govern conversion of latent demand in these markets, where the conventional franchises retain their strongest position. Grid coverage and the absence of swap infrastructure keep these regions petrol-dependent through most of the forecast period, and they represent the addressable frontier that will determine whether Tanzania's electric lead in Dar es Salaam translates into national leadership or remains a coastal-urban phenomenon.
Tanzania Three Wheeler Market Regional Analysis Geographic Coverage Infographic
Competitive Landscape

How Competition Is Evolving

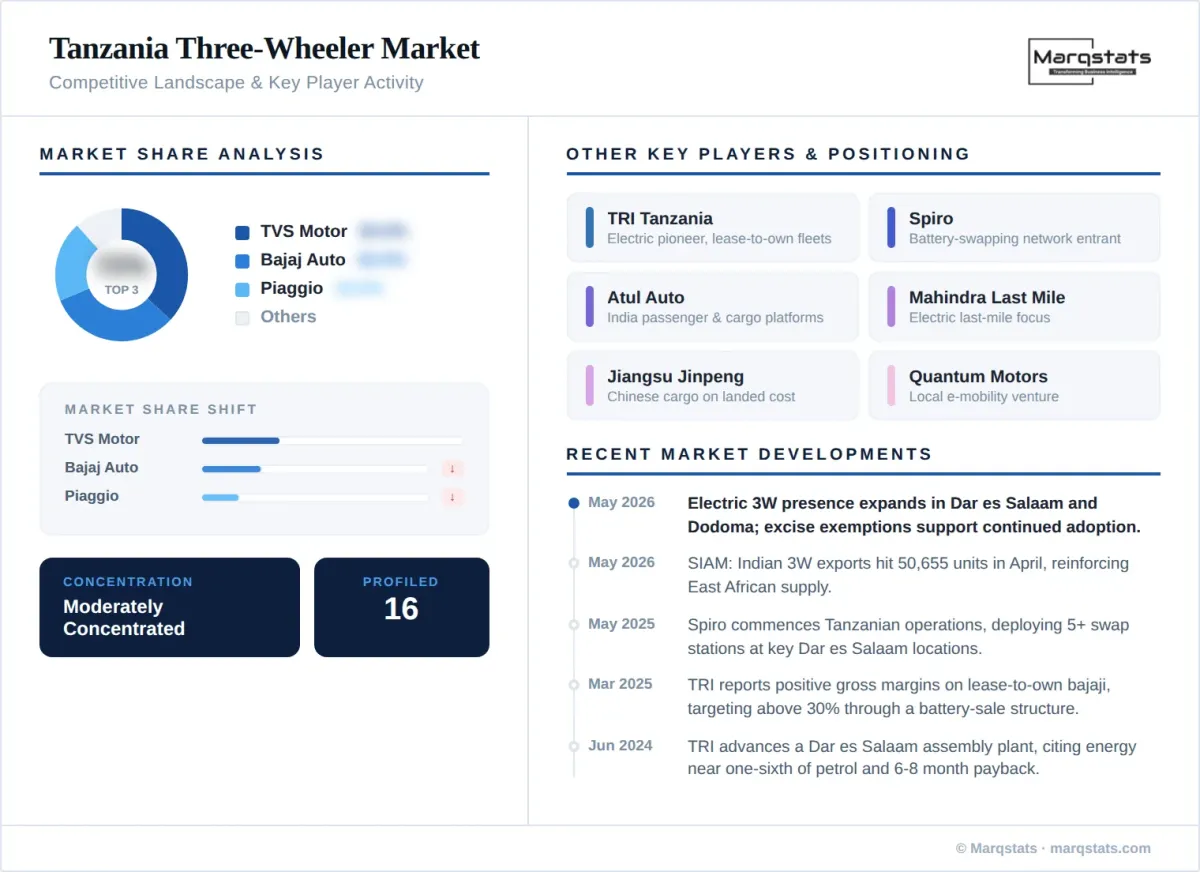
The market is moderately concentrated in conventional powertrains and rapidly diversifying in electric. Three franchises dominate the combustion segment: TVS Motor Company Limited through the TVS King, Bajaj Auto Limited through the RE platform, and Piaggio & C. S.p.A. through the Ape, all landed through Dar es Salaam distributors with established parts and service networks. These incumbents compete on durability, financing access, and after-sales reach.

The electric segment is led by domestically focused ventures. TRI, founded in 2021, holds the pioneering position with lease-to-own electric bajaji fleets, battery-swapping and home-charging models, and plans for a Dar es Salaam assembly plant, having demonstrated positive gross margins and targeting above 30% through operational scaling. International entrants including Spiro have deployed battery-swapping stations at key Dar es Salaam locations, while Chinese battery and vehicle suppliers support the assembly ecosystem. Development-programme backing through UNEP and SOLUTIONSplus strengthens the electric tier's position.

Competition over the forecast period will centre on financing models, swap-network coverage, and local assembly economics. The lease-to-own structure that decouples battery ownership from vehicle purchase is the electric tier's primary competitive lever against conventional franchises, and control of swap and charging infrastructure will influence which platforms fleet operators standardize on. Incumbent distributors retain the service and parts moat; electric challengers counter with operating-cost advantage and driver-livelihood positioning.

Barriers to entry differ sharply by powertrain. Conventional franchise positions rest on decades of dealer and parts infrastructure that new combustion entrants cannot easily replicate, keeping that segment stable. The electric tier, by contrast, is contestable on business-model innovation and capital access rather than legacy distribution, which is why early ventures have been able to establish strong positions quickly; the decisive advantage accrues to whoever pairs demonstrated driver economics with the capital to scale swap networks and assembly capacity ahead of rivals.
Tanzania Three Wheeler Market Competitive Landscape Key Player Activity Infographic
Major Players

Companies Covered

The report profiles 16+ companies with full strategy and financials analysis, including:

TVS Motor Company Limited
Bajaj Auto Limited
Piaggio & C. S.p.A.
Atul Auto Limited
Mahindra Last Mile Mobility Limited
Greaves Cotton Limited
TRI Tanzania Limited
Spiro Limited
Jiangsu Jinpeng Group Co., Ltd.
Chongqing Zongshen Automobile Industry Co., Ltd.
Loncin Motor Co., Ltd.
Luoyang Dayang Trike Locomotive Co., Ltd.
Omega Seiki Mobility Private Limited
E-Mobility Tanzania Limited
Simba Corporation Limited
Quantum Motors Limited
Note: Full company profiles include revenue analysis, product portfolio, SWOT, and recent strategic developments.
Latest Developments

Recent Market Activity

May 2026
Electric three wheeler presence expanded in Dar es Salaam and Dodoma on lower operating costs, with excise duty exemptions supporting continued electric bajaji adoption across Tanzanian cities.
May 2026
SIAM data showed Indian three wheeler exports of 50,655 units in April 2026, nearly double the prior-year month, reinforcing supply availability for East Africa's import-dependent markets.
May 2025
International electric mobility company Spiro commenced Tanzanian operations with a localized strategy, deploying more than five battery-swapping stations at key Dar es Salaam locations.
Mar 2025
TRI reported positive gross margins on its lease-to-own electric bajaji model, targeting above 30% by year-end through a battery-sale structure that removes asset depreciation from its books.
Jun 2024
TRI advanced plans for an electric bajaji assembly plant in Dar es Salaam and targeted 500 vehicles deployed by end-2024, citing energy costs roughly one-sixth of petrol and six-to-eight-month payback.
Report Structure

Table of Contents

1. Introduction
1.1 Study Assumptions & Definitions
1.2 Research Scope
1.3 Market Definition — Passenger & Load Carrier Three-Wheelers (Bajaji)
1.4 Currency, Units & Conversion Basis
1.5 Years Considered — Historical 2021–2025, Forecast 2026–2030
2. Research Methodology
2.1 Research Framework
2.2 Secondary Research — Registration, Export Dispatch & Deployment Data
2.3 Primary Research — 40+ Stakeholder Interviews
2.4 Market Estimation — Bottom-Up Volume Model
2.5 Segment Derivation — Marqstats-Reconciled Share Basis
2.6 Data Triangulation & Validation
2.7 Assumptions & Limitations
3. Executive Summary
3.1 Market Snapshot — Volume & Value
3.2 Key Findings by Segment
3.3 Key Findings by Region
3.4 CXO Perspective — East Africa's Most Advanced Electric Bajaji Market
3.5 Analyst Recommendations
4. Market Dynamics
4.1 Market Drivers
4.1.1 Urban Paratransit Dependence & the Bajaji Economy
4.1.2 Electric Operating Economics — One-Sixth Petrol Energy Cost
4.1.3 Lease-to-Own Financing Models
4.1.4 Battery-Swapping Infrastructure
4.1.5 Policy Support — Excise Exemptions & UNEP/SOLUTIONSplus
4.2 Market Restraints
4.2.1 Import Cost Exposure & Currency Pass-Through
4.2.2 Import Duties on Electric Vehicles
4.2.3 Financing Constraints for Drivers
4.2.4 Driver-Association Ecosystem Preservation
4.3 Market Trends
4.3.1 Local Electric Assembly in Dar es Salaam
4.3.2 Battery-Swapping Network Scale-Up
4.3.3 Fleet & Lease-to-Own Growth
4.3.4 Secondary-City Electric Expansion (Dodoma & Arusha)
4.4 Market Opportunities
4.4.1 Electric Fleet Deployment & Swap Networks
4.4.2 Tourism-Linked Premium Electric Routes
4.4.3 Cargo Segment Electrification
4.5 Industry Value Chain Analysis
4.6 Porter's Five Forces Analysis
4.6.1 Bargaining Power of Suppliers
4.6.2 Bargaining Power of Buyers
4.6.3 Threat of New Entrants
4.6.4 Threat of Substitutes
4.6.5 Intensity of Competitive Rivalry
5. Tanzania Three-Wheeler Market Size & Growth Analysis
5.1 Market Size in Volume, Thousand Units (2021–2030)
5.2 Market Size in Value, USD Million (2021–2030)
5.3 Volume vs Value Growth Decomposition
5.4 Average Selling Price Analysis by Powertrain
5.5 Growth — Absolute & CAGR Bridge (2026–2030)
6. Tanzania Three-Wheeler Market, By Vehicle Type
6.1 Segment Overview & Share Analysis (2025 vs 2030)
6.2 Passenger Carrier
6.2.1 Market Size in Volume, Thousand Units (2021–2030)
6.2.2 Market Size in Value, USD Million (2021–2030)
6.2.3 Bajaji Taxi Operating Models & Replacement Cycles
6.3 Load Carrier
6.3.1 Market Size in Volume, Thousand Units (2021–2030)
6.3.2 Market Size in Value, USD Million (2021–2030)
6.3.3 Cargo Configurations & Urban Delivery Demand
7. Tanzania Three-Wheeler Market, By Fuel Type
7.1 Segment Overview & Share Analysis (2025 vs 2030)
7.2 Petrol
7.2.1 Market Size in Volume, Thousand Units (2021–2030)
7.2.2 Market Size in Value, USD Million (2021–2030)
7.2.3 Workhorse Economics Outside Electric Corridors
7.3 Diesel
7.3.1 Market Size in Volume, Thousand Units (2021–2030)
7.3.2 Market Size in Value, USD Million (2021–2030)
7.3.3 Heavy-Cargo Niche & Contraction Drivers
7.4 CNG/LPG
7.4.1 Market Size in Volume, Thousand Units (2021–2030)
7.4.2 Market Size in Value, USD Million (2021–2030)
7.4.3 Marginal Presence Without a National Programme
7.5 Electric
7.5.1 Market Size in Volume, Thousand Units (2021–2030)
7.5.2 Market Size in Value, USD Million (2021–2030)
7.5.3 Lease-to-Own vs Battery-Swapping Models
7.5.4 Total Cost of Ownership vs Petrol — 6–8 Month Payback
8. Tanzania Three-Wheeler Market, By Application Type
8.1 Segment Overview & Share Analysis (2025 vs 2030)
8.2 Passenger Transport
8.2.1 Market Size in Volume, Thousand Units (2021–2030)
8.2.2 Market Size in Value, USD Million (2021–2030)
8.2.3 Urban Bajaji Route Structures
8.3 Last-mile Delivery/Logistics
8.3.1 Market Size in Volume, Thousand Units (2021–2030)
8.3.2 Market Size in Value, USD Million (2021–2030)
8.3.3 Dar es Salaam E-Commerce & Courier Fleets
8.4 Goods Transportation
8.4.1 Market Size in Volume, Thousand Units (2021–2030)
8.4.2 Market Size in Value, USD Million (2021–2030)
8.4.3 Market-Trader & Agricultural Haulage
8.5 Others (Municipal, Waste, Vending)
8.5.1 Market Size in Volume, Thousand Units (2021–2030)
8.5.2 Market Size in Value, USD Million (2021–2030)
8.5.3 City Service Contracts
9. Tanzania Three-Wheeler Market, By End-User Ownership Model
9.1 Segment Overview & Share Analysis (2025 vs 2030)
9.2 Individual Owner/Drivers
9.2.1 Market Size in Volume, Thousand Units (2021–2030)
9.2.2 Market Size in Value, USD Million (2021–2030)
9.2.3 Lease-to-Own Conversion to Ownership
9.3 Fleet Operators
9.3.1 Market Size in Volume, Thousand Units (2021–2030)
9.3.2 Market Size in Value, USD Million (2021–2030)
9.3.3 Electric Mobility Venture Fleets
9.3.4 Swap & Charging Infrastructure Models
9.4 Government/Institutional Purchases
9.4.1 Market Size in Volume, Thousand Units (2021–2030)
9.4.2 Market Size in Value, USD Million (2021–2030)
9.4.3 Municipal & Development-Programme Procurement
10. Tanzania Three-Wheeler Market, By Region
10.1 Regional Share Analysis — Volume (2025 vs 2030)
10.2 Regional Growth Matrix — CAGR vs Fleet Size
10.3 Import Routing — Dar es Salaam Port & Inland Distribution
11. Dar es Salaam Deep Dive
11.1 Market Context — 100,000+ Bajaji Taxi Base
11.1.1 Fleet Size & Renewal Estimates (2021–2030)
11.1.2 Kimara, Mwenge & Arterial-Corridor Demand
11.2 Electric Bajaji Ecosystem
11.2.1 Swap vs Home-Charging Model Economics
11.2.1.1 Per-Swap Fee vs Daily Home-Charging Cost
11.2.1.2 Working-Capital & Gross-Margin Implications
11.2.2 Local Assembly & Deployment Pipeline
12. Northern Zone Deep Dive (Arusha & Kilimanjaro)
12.1 Passenger Demand & Tourism-Linked Transport
12.2 Premium Electric Route Economics
12.3 Early Secondary-Market Electric Deployment
13. Lake Zone, Central & Rest of Tanzania
13.1 Mwanza — Lake Zone Passenger & Cargo Demand
13.2 Dodoma — Capital Growth & Electric Deployment Target
13.3 Southern Highlands, Coast & Western Regions — Petrol-Dependent Frontier
13.3.1 Distribution & Financing Constraints
13.3.2 Electrification Frontier Assessment
14. Policy & Programme Environment
14.1 Electric Vehicle Excise & Duty Framework
14.1.1 Excise Exemptions & Import Duty Structure
14.1.2 Local Assembly Incentives
14.2 UNEP Global Electric Mobility Programme
14.2.1 Programme Support & E-Mobility Targets
14.2.2 Peer-City Exchange & Technical Assistance
14.3 SOLUTIONSplus Dar es Salaam City Network
14.4 Urban Operating Regulations & Driver-Association Framework
14.5 Standards & Vehicle Certification
15. Powertrain Transition Economics
15.1 Total Cost of Ownership — Petrol vs Electric
15.1.1 Acquisition & Lease-to-Own Cost Comparison
15.1.2 Energy Cost per Kilometre — Petrol vs Electric
15.1.3 Payback Analysis — 6–8 Month Benchmark
15.1.3.1 Home-Charging Driver Scenario
15.1.3.2 Battery-Swap Fleet Scenario
15.2 Battery-Swapping Network Economics
15.3 Local Assembly Cost Structure
15.4 Powertrain Mix Forecast Scenarios to 2030
16. Import & Supply Chain Analysis
16.1 India Export Dispatch Flows & Landed Cost Structure
16.1.1 Freight, Duty & FX Pass-Through to Showroom Price
16.1.2 Electric Component Sourcing & Local Assembly
16.2 Dar es Salaam Port Handling & Inland Logistics
16.2.1 Clearance & Routing to Upcountry Markets
16.2.2 Electric Component & Battery Import Channels
16.3 Distributor & Dealer Network Structure
16.3.1 Conventional Franchise Distribution
16.3.2 Electric Venture Direct & Lease-to-Own Channels
16.4 Battery, Spare Parts & After-Sales Ecosystem
17. Competitive Landscape
17.1 Market Share Analysis — Combustion & Electric (2025)
17.1.1 Conventional Franchise Shares — TVS, Bajaj & Piaggio
17.1.2 Electric Venture Shares — TRI, Spiro & Others
17.2 Competitive Positioning Matrix
17.3 Conventional Franchise vs Electric Venture Benchmarking
17.4 Financing & Business-Model Comparison
17.5 Strategic Developments — Deployments, Assembly & Partnerships (2024–2026)
18. Company Profiles
18.1 TVS Motor Company Limited
18.1.1 Company Overview & Tanzania Footprint
18.1.2 Product Portfolio — Three-Wheeler Platforms
18.1.3 Recent Developments & Strategy
18.2 Bajaj Auto Limited
18.2.1 Company Overview & Tanzania Footprint
18.2.2 Product Portfolio — Three-Wheeler Platforms
18.2.3 Recent Developments & Strategy
18.3 Piaggio & C. S.p.A.
18.3.1 Company Overview & Tanzania Footprint
18.3.2 Product Portfolio — Three-Wheeler Platforms
18.3.3 Recent Developments & Strategy
18.4 Atul Auto Limited
18.4.1 Company Overview & Tanzania Footprint
18.4.2 Product Portfolio — Three-Wheeler Platforms
18.4.3 Recent Developments & Strategy
18.5 Mahindra Last Mile Mobility Limited
18.5.1 Company Overview & Tanzania Footprint
18.5.2 Product Portfolio — Three-Wheeler Platforms
18.5.3 Recent Developments & Strategy
18.6 Greaves Cotton Limited
18.6.1 Company Overview & Tanzania Footprint
18.6.2 Product Portfolio — Three-Wheeler Platforms
18.6.3 Recent Developments & Strategy
18.7 TRI Tanzania Limited
18.7.1 Company Overview & Tanzania Footprint
18.7.2 Product Portfolio — Three-Wheeler Platforms
18.7.3 Recent Developments & Strategy
18.8 Spiro Limited
18.8.1 Company Overview & Tanzania Footprint
18.8.2 Product Portfolio — Three-Wheeler Platforms
18.8.3 Recent Developments & Strategy
18.9 Jiangsu Jinpeng Group Co., Ltd.
18.9.1 Company Overview & Tanzania Footprint
18.9.2 Product Portfolio — Three-Wheeler Platforms
18.9.3 Recent Developments & Strategy
18.10 Chongqing Zongshen Automobile Industry Co., Ltd.
18.10.1 Company Overview & Tanzania Footprint
18.10.2 Product Portfolio — Three-Wheeler Platforms
18.10.3 Recent Developments & Strategy
18.11 Loncin Motor Co., Ltd.
18.11.1 Company Overview & Tanzania Footprint
18.11.2 Product Portfolio — Three-Wheeler Platforms
18.11.3 Recent Developments & Strategy
18.12 Luoyang Dayang Trike Locomotive Co., Ltd.
18.12.1 Company Overview & Tanzania Footprint
18.12.2 Product Portfolio — Three-Wheeler Platforms
18.12.3 Recent Developments & Strategy
18.13 Omega Seiki Mobility Private Limited
18.13.1 Company Overview & Tanzania Footprint
18.13.2 Product Portfolio — Three-Wheeler Platforms
18.13.3 Recent Developments & Strategy
18.14 E-Mobility Tanzania Limited
18.14.1 Company Overview & Tanzania Footprint
18.14.2 Product Portfolio — Three-Wheeler Platforms
18.14.3 Recent Developments & Strategy
18.15 Simba Corporation Limited
18.15.1 Company Overview & Tanzania Footprint
18.15.2 Product Portfolio — Three-Wheeler Platforms
18.15.3 Recent Developments & Strategy
18.16 Quantum Motors Limited
18.16.1 Company Overview & Tanzania Footprint
18.16.2 Product Portfolio — Three-Wheeler Platforms
18.16.3 Recent Developments & Strategy
19. Appendix
19.1 Abbreviations & Glossary
19.2 List of Tables
19.3 List of Figures
19.4 Sources & References
19.5 Customization Options
19.6 Disclaimer
Study Scope & Focus

Coverage & Segmentation

This report quantifies the Tanzania three wheeler market in volume (thousand units) and value (USD million) across a 2021-2025 historical period and a 2026-2030 forecast period, with 2025 as the base year. Segmentation covers vehicle type (passenger carrier, load carrier), fuel type (petrol, diesel, CNG/LPG, electric), application (passenger transport, last-mile delivery/logistics, goods transportation, others), and end-user ownership model (individual owner/drivers, fleet operators, government/institutional purchases), with regional assessment across Dar es Salaam, the Northern Zone, the Lake Zone and Central, and the Rest of Tanzania. The competitive assessment profiles 16 manufacturers, distributors, and electric mobility ventures. Tanzania's demand structure is assessed alongside continental patterns documented in the Africa two wheeler market, whose import, financing, and electrification dynamics closely parallel the tricycle segment.

The study evaluates the electric business-model transition, powertrain economics, financing structures, and competitive positioning to support market-entry, investment, and procurement decisions by OEMs, e-mobility ventures, distributors, financiers, and development institutions. Forecasts incorporate announced commitments with funded programmes and demonstrated commercial traction; speculative initiatives without funding are excluded from the base case, and the electric path is modelled on swap-network and assembly capacity ramping against demonstrated driver economics.
Frequently Asked Questions

FAQs About the Tanzania Three-Wheeler Market

The Tanzania three-wheeler market recorded 35.51 thousand units in 2025 and is projected to reach 50.51 thousand units by 2030. In value terms, the market stood at USD 161.02 million in 2025, reaching USD 244.81 million by 2030.
The market expands at a 7.00% volume CAGR during 2026–2030, with value growing faster at 8.44% owing to mix enrichment toward electric variants.
Passenger carriers (the bajaji taxi) dominate with 80.00% of 2025 volume, with over 100,000 bajaji taxis in Dar es Salaam; load carriers grow faster at a 9.04% CAGR.
Electric three-wheelers are the fastest growing segment at a 33.45% CAGR, rising from 4.00% of volume in 2025 to 15.00% by 2030 — the highest electric penetration in the Africa pack — driven by lease-to-own and battery-swapping models with 6–8 month payback.
Electric bajajis cost roughly one-sixth of petrol per kilometre (about USD 0.20 vs USD 1.20 per 20 km), and lease-to-own structures that decouple battery ownership from the vehicle lower upfront costs. Ventures such as TRI and Spiro have built commercial fleets, swap networks, and local assembly in Dar es Salaam.
TVS Motor Company Limited, Bajaj Auto Limited, Piaggio & C. S.p.A., Atul Auto Limited, Mahindra Last Mile Mobility Limited, Greaves Cotton Limited, TRI Tanzania Limited, Spiro Limited, Jiangsu Jinpeng Group Co., Ltd., Chongqing Zongshen Automobile Industry Co., Ltd., Loncin Motor Co., Ltd., Luoyang Dayang Trike Locomotive Co., Ltd., Omega Seiki Mobility Private Limited, E-Mobility Tanzania Limited, Simba Corporation Limited, and Quantum Motors Limited.
The report is delivered as a PDF (250+ pages), Excel data tables, and a PPT summary deck with analyst email support. Marqstats offers 20% complimentary customization on additional segments, regions, or data.