Market Snapshot
Middle bar: base-year value × (1 + CAGR), rounded to two decimals. This is a calculated illustration, not a separately researched annual estimate.
The Tunisia used car market size is estimated at USD 4,166.02 million in 2025 and is projected to reach USD 5,798.78 million by 2030, growing at a CAGR of 6.84% over 2026 – 2030. Used car transactions rise from 362,000 to 435,000, with passenger cars leading at 67.80% of 2025 volume.
Tunisia rations new cars. Import quotas set by the Ministry of Trade to protect foreign currency reserves limit new car supply, so the used market handles more than three quarters of vehicle purchases. Ownership transfers registered by the Technical Agency for Land Transport (ATTT) outnumber first registrations by about five to one. Marqstats estimates 362,000 used car transactions in 2025 at an average of TND 33,800, or TND 12,235.60 million, converted at TND 2.937 per US dollar.
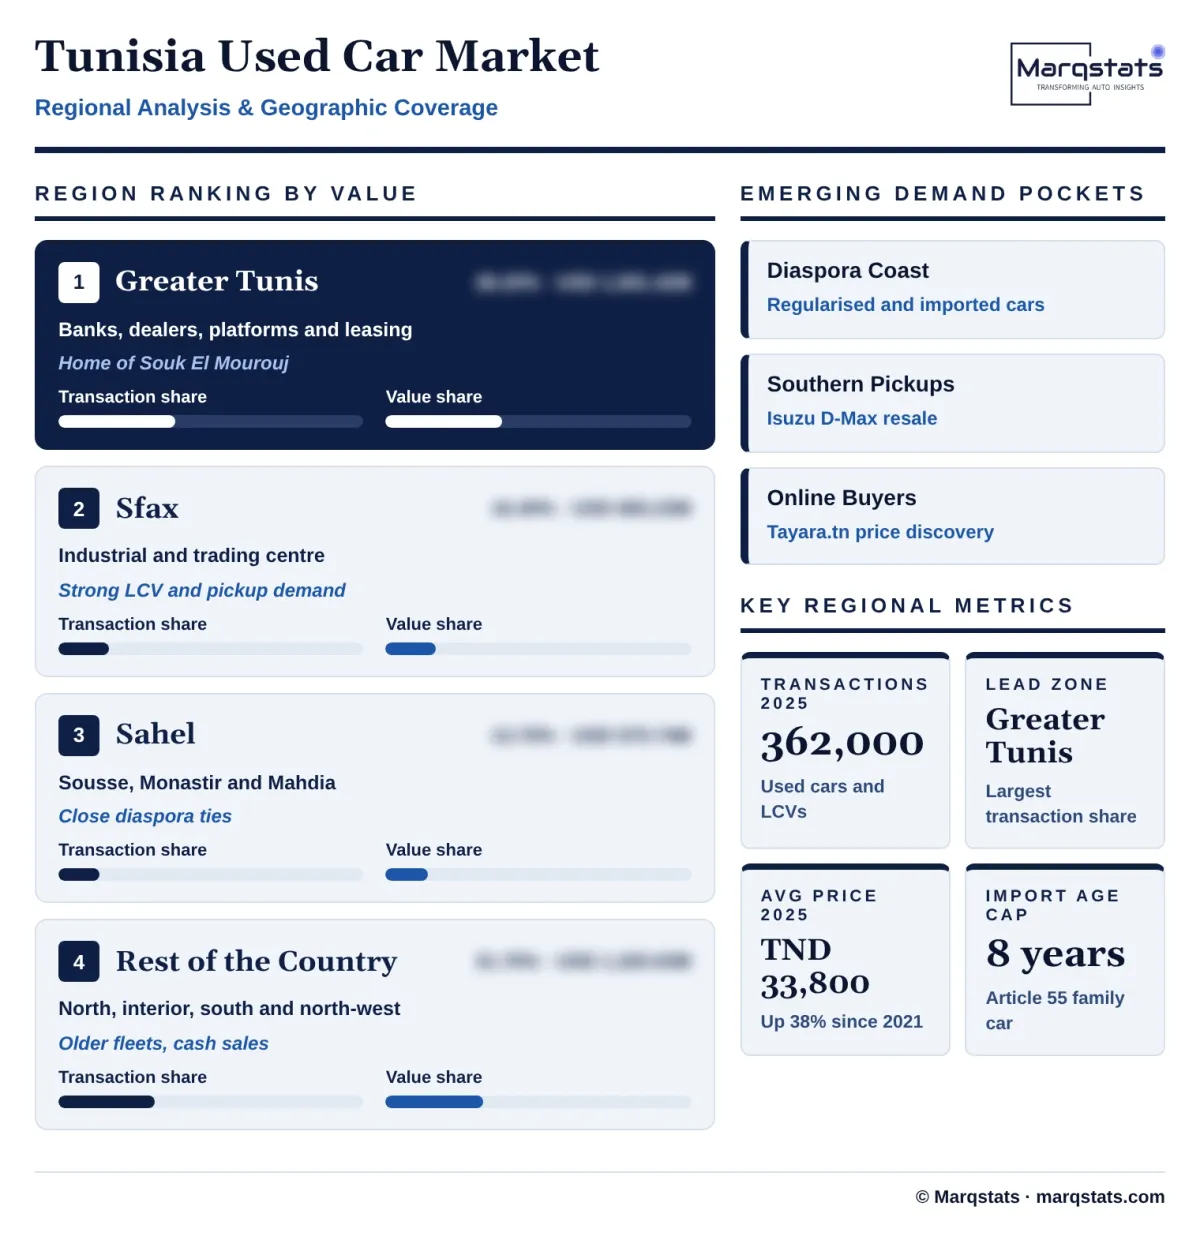
Demand is concentrated on the coast. Greater Tunis accounts for an estimated 38.20% of transactions, Sfax for 16.40% and the Sahel region of Sousse, Monastir and Mahdia for 13.70%. The study segments the market by body type (passenger cars, light commercial vehicles, and SUVs and crossovers), powertrain (gasoline, diesel, and hybrid and electric) and vehicle age.
Key Takeaways
Market Overview & Analysis
Report Summary
Marqstats sizes the Tunisia used car market as the value of all used passenger car and light commercial vehicle transactions in a year, including domestic ownership transfers registered by the ATTT, regularised diaspora vehicles and trade-ins sold by dealers and leasing companies. In 2025 these totalled an estimated 362,000 transactions at an average of TND 33,800. Values are converted at TND 2.937 per US dollar in 2025, and the forecast assumes the dinar weakens by about 3.5% a year against the dollar.
Commercial imports of used cars are not allowed, so supply comes mainly from the domestic fleet. The fleet of about 2.5 million vehicles is old: more than half of passenger cars are over ten years old. Additions to used supply come from Tunisians returning from abroad under the duty-free FCR scheme, from fleet and leasing returns, and from 2026 from families using the Article 55 import right.
Prices are high relative to incomes. Because new cars are rationed and the dinar has weakened, used car prices have risen faster than general inflation. The average transaction rose from about TND 24,500 in 2021 to TND 33,800 in 2025, an increase of about 38% in four years. Over the same period transaction volume rose from about 310,000 to 362,000, so most of the growth in market value came from price rather than volume.
The forecast rests on three conditions. New car import quotas stay broadly unchanged, Article 55 imports run at a steady pace within the foreign currency available, and the dinar continues to weaken gradually. Under these conditions transactions reach 435,000 in 2030 and market value USD 5,798.78 million.
Tunisia Used Car Market Size and Forecast
The Tunisia used car market grows from USD 4,166.02 million in 2025 to USD 5,798.78 million in 2030, a CAGR of 6.84%. In local currency the market grows from TND 12,235.60 million to TND 20,227.50 million, a 10.57% CAGR. The gap between the two reflects an assumed weakening of the dinar from TND 2.937 to about TND 3.49 per US dollar by 2030. Transactions grow from 362,000 to 435,000, a 3.74% annual rate.
Most of the growth in dinar value comes from price, not volume. The average transaction rises from TND 33,800 to TND 46,500 as new car prices keep rising with each import shipment and used car prices follow them. Volume grows more slowly, supported by Article 55 imports, regularised diaspora cars and a gradual increase in dealer trade-ins. Marqstats expects Article 55 to add roughly 12,000 to 18,000 younger cars a year once the scheme is running, enough to lift the share of five- to nine-year-old cars but not to change the basic shortage of supply.
Market Dynamics
Key Drivers
Five conditions keep demand for used cars high and push prices up.
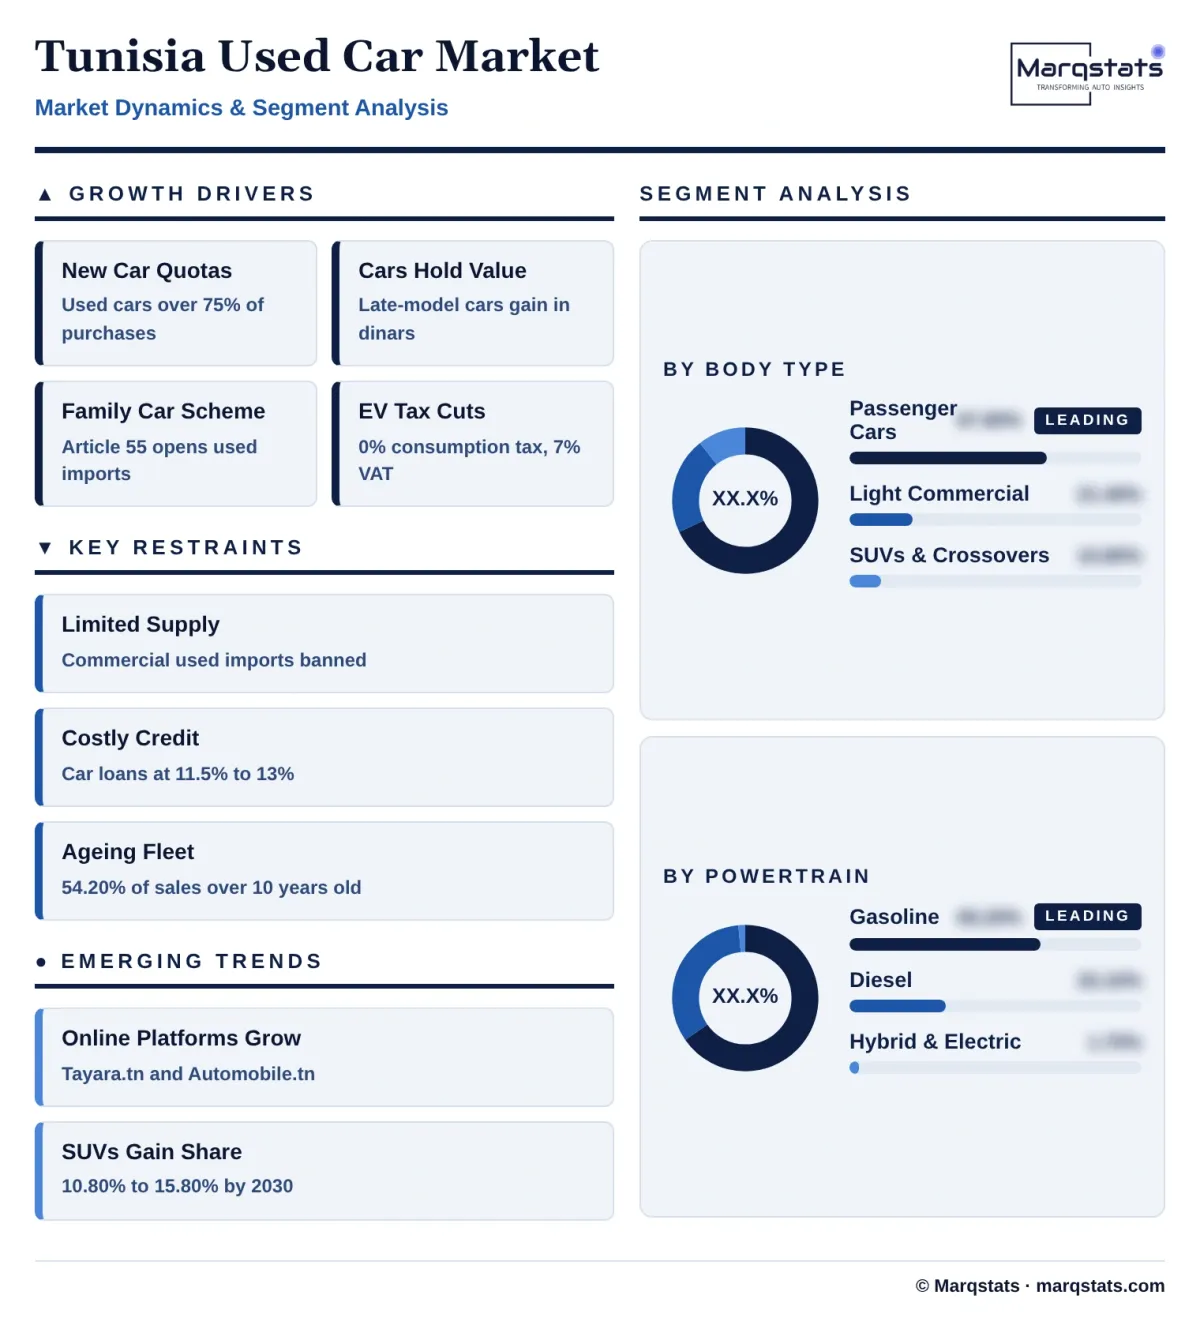
- New car quotas push buyers to the used market. Import quotas limit new car supply to roughly 55,000 to 58,000 vehicles a year, far below demand. Buyers who cannot get or afford a new car turn to used cars, which account for more than three quarters of vehicle purchases.
- Used cars hold their value in dinars. Rising new car prices and a weaker dinar mean late-model used cars often sell for more than their original price. This makes cars attractive as a store of value and keeps transaction values rising.
- The family car scheme opens a new import channel. Article 55 of the 2026 Finance Law lets resident families import a car up to eight years old at reduced tax. At least 10% of annual authorised car imports must go to the scheme, adding younger cars to the fleet over time.
- Tax cuts favour plug-in hybrids and electric cars. The 2026 Finance Law exempts plug-in hybrids and electric cars from consumption tax and cuts their VAT to 7%, making imported used electrified cars more affordable.
- Leasing is reaching used cars. Banks and leasing companies such as Banque Tuniso-Libyenne, Tunisie Leasing & Factoring and Hannibal Lease offer lease finance for used cars up to five years old, helping buyers afford newer stock. Repayment terms of up to 60 months and lower deposits bring late-model used cars within reach of salaried households that cannot raise the full price in cash.
Key Restraints
Four constraints limit supply and keep most of the market informal.
- Supply is tightly limited. Commercial imports of used cars are banned and new car quotas are fixed, so the used pool grows slowly. The Article 55 scheme depends on foreign currency being available, and economists have warned that its income limits and engine caps will restrict take-up.
- Credit is expensive. The central bank rate stood around 8% through 2024 and 2025, and car loans cost about 11.5% to 13% a year. Bank finance is rarely available for cars more than five years old, so most buyers pay cash.
- The fleet is old. More than half of used car transactions involve cars over ten years old, and about 22% of passenger cars fail their first technical inspection, mostly for brakes and emissions. Older cars carry high repair costs and uncertain condition.
- Buyers lack reliable vehicle histories. Tunisia has no central database linking VINs to accidents, service records or inspection mileage, so odometer tampering and hidden repairs are common. Buyers rely on garage checks, which slows sales and keeps prices uncertain. Informal brokers exploit the information gap by buying undervalued cars for cash and reselling them quickly, adding a margin that buyers cannot see.
Key Trends
Four shifts are opening new supply channels and formalising the trade.
- Online platforms are taking share from car markets. Tayara.tn, Automobile.tn and Autoprix.tn have grown to an estimated 26.50% of transactions and are the main price reference. Sellers increasingly list online first and use weekly markets only for final viewing and payment. Marqstats expects their share to keep rising as buyers search online before visiting sellers.
- Dealers are building certified used programmes. Ennakl Automobiles runs Das WeltAuto for Volkswagen Group brands, Ben Jemâa Motors runs BMW Premium Selection and Italcar offers trade-ins. Certified sales are still small because late-model stock is scarce, but buyers pay a premium for inspected cars with warranties and service records.
- SUVs and crossovers are gaining share. SUVs rise from 10.80% of transactions in 2025 to 15.80% by 2030, led by the Kia Sportage, Hyundai Tucson, Nissan Qashqai and Dacia Duster, with value growing at 15.28% a year.
- Technical inspection is getting stricter. The ATTT has raised inspection fees and tightened brake and emissions checks on cars more than ten years old, pushing owners to repair or retire the oldest cars. Brakes account for about 35% of failures and emissions for about 28%, so owners of older cars face rising repair bills to stay on the road.
Strategic Implications
- For franchise dealers, certified used cars are an opportunity they cannot fully supply. With new car quotas capping their main business, dealers such as Ennakl, City Cars, ARTES and Alpha Hyundai Motor can grow by taking trade-ins and selling inspected, warranted used cars. The constraint is stock, so trade-in programmes matter more than showroom space. Dealers can also offer multi-brand servicing for the ageing fleet, earning revenue outside the quota-limited new car business.
- For online platforms, trust is the product. Platforms that add inspections, verified mileage, escrow payment and digital sale documents can move transactions out of informal markets and earn fees beyond listings.
- For lenders, late-model used cars are underserved. Lease-to-own products for two- to six-year-old cars, priced with inspection reports and platform price data, can serve salaried buyers who are priced out of new cars.
- The main uncertainty is foreign currency. If foreign currency becomes scarcer, the authorities could slow Article 55 approvals and cut new car quotas, which would reduce supply and push prices up further. The base case assumes steady implementation.
Market Segmentation
Passenger cars, mostly city cars, hatchbacks and compact sedans, account for an estimated 245,436 transactions in 2025, 67.80% of the market and USD 2,824.56 million. Their share eases to 63.50% by 2030, with value growing at 5.45% a year to USD 3,682.22 million. The Renault Clio, Peugeot 208, Volkswagen Polo, Hyundai i10 and Kia Picanto lead.
Light commercial vehicles and pickups account for an estimated 77,468 transactions in 2025, 21.40% of the market and USD 891.53 million, rising to 90,045 transactions and USD 1,200.35 million by 2030, a 6.13% value CAGR. Small businesses and farmers rely on the Isuzu D-Max, Fiat Doblò, Peugeot Partner and Citroën Berlingo, which hold their value well. Leasing companies sell off-lease vans and pickups through sealed-bid auctions, adding younger stock to this segment.
SUVs and crossovers account for an estimated 39,096 transactions in 2025, 10.80% of the market and USD 449.93 million. They are the fastest-growing body type, rising to 68,730 transactions and 15.80% by 2030, with value growing at 15.28% a year to USD 916.21 million, as compact crossovers reach the used market.
Gasoline cars account for an estimated 236,024 transactions in 2025, 65.20% of the market and USD 2,716.24 million. They dominate urban demand because small petrol engines carry low road tax and maintenance costs. Their share falls to 58.60% by 2030, with value growing at 4.58% a year to USD 3,398.08 million.
Diesel vehicles account for an estimated 119,822 transactions in 2025, 33.10% of the market and USD 1,378.95 million, concentrated in light commercial vehicles, pickups and older intercity cars. They rise to 137,025 transactions by 2030, with value growing at 5.78% a year to USD 1,826.62 million.
Hybrid and electric cars account for an estimated 6,154 transactions in 2025, 1.70% of the market and USD 70.82 million, and are the fastest-growing powertrain. Tax cuts in the 2026 Finance Law lift them to 43,065 transactions and 9.90% by 2030, with value growing at 51.97% a year to USD 574.08 million.
Cars up to four years old account for an estimated 40,906 transactions in 2025, 11.30% of the market and USD 470.76 million. Leasing returns, fleet sales and higher-end diaspora imports supply this group, which rises to 13.80% and USD 800.23 million by 2030, an 11.19% value CAGR.
Cars aged five to nine years account for an estimated 124,890 transactions in 2025, 34.50% of the market and USD 1,437.28 million. They are the most liquid group and the main target of Article 55 imports, rising to 37.40% and USD 2,168.74 million by 2030, an 8.58% value CAGR.
Cars ten years old or more account for an estimated 196,204 transactions in 2025, 54.20% of the market and USD 2,257.98 million. They remain the largest group but their share falls to 48.80% by 2030, with value growing at 4.62% a year to USD 2,829.80 million. Most are sold for cash at weekly markets, often through informal brokers, and buyers rely on garage checks to judge condition.
By Geography
Greater Tunis
Greater Tunis, covering Tunis, Ariana, Ben Arous and Manouba, is the largest market, with an estimated 38.20% of 2025 transactions, about 138,284 cars worth USD 1,591.42 million. Banks, leasing companies, franchise dealers and online platforms are based here, leasing companies register their fleets in the capital, and the Souk El Mourouj weekly car market is the largest in the country.
Sfax
Sfax accounts for an estimated 16.40% of transactions, about 59,368 vehicles worth USD 683.23 million. As Tunisia's main industrial and trading centre outside the capital, it has strong demand for light commercial vehicles, diesel vans and pickups, and many transactions are settled in cash.
Sahel
The Sahel region of Sousse, Monastir and Mahdia accounts for an estimated 13.70% of transactions, about 49,594 cars worth USD 570.74 million. Tourism and services support incomes, and close ties with the diaspora in Europe bring a steady flow of imported cars. The region was a major beneficiary of the Article 80 regularisation, and it is expected to be an early user of the Article 55 family car scheme.
Cap Bon and the North
Nabeul, Bizerte, Béja and Zaghouan account for an estimated 10.60% of transactions, about 38,372 vehicles worth USD 441.60 million. Commuters into Tunis and farming communities create mixed demand for small cars and light commercial vehicles. Nabeul and Bizerte have large populations of returning diaspora, and Bizerte port is an entry point for vehicles shipped from Europe.
Central Interior
Kairouan, Kasserine, Sidi Bouzid and Siliana account for an estimated 9.10% of transactions, about 32,942 vehicles worth USD 379.11 million. Incomes are lower than on the coast, fleets here average more than 14 years old, and informal cash sales dominate. In Kasserine, Sidi Bouzid and Gafsa, many cars are more than 15 years old, buyers travel to Sousse or Sfax for younger stock, and local prices follow listings on Tayara.tn closely.
South
Gabès, Médenine, Tataouine, Gafsa, Tozeur and Kébili account for an estimated 8.00% of transactions, about 28,960 vehicles worth USD 333.28 million. Cross-border trade and desert conditions sustain demand for pickups such as the Isuzu D-Max, which keep strong resale values. Diaspora cars arriving through southern ports and returning residents add to local supply.
North-West
Jendouba and Le Kef account for an estimated 4.00% of transactions, about 14,480 vehicles worth USD 166.64 million. Lower incomes and older fleets make this the smallest regional market, and farming and cross-border trade with Algeria support demand for pickups and older diesel cars. Regional shares are a Marqstats allocation based on registration and listing data.
How Competition Is Evolving
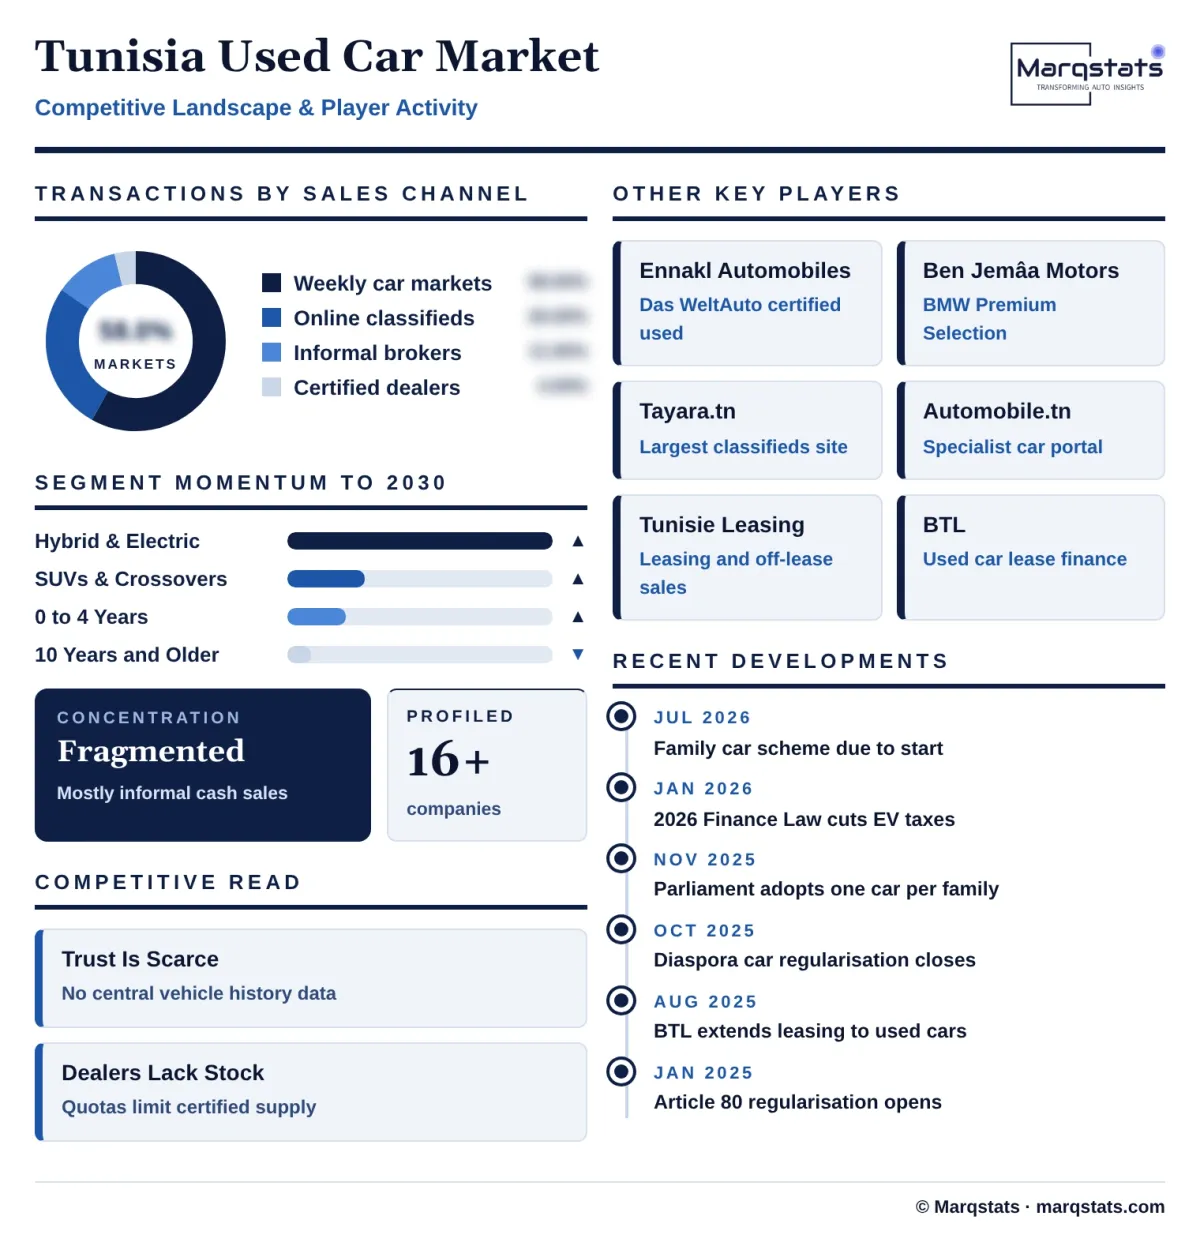
The Tunisia used car market is highly fragmented and largely informal. Marqstats estimates weekly open-air car markets handle about 58.00% of transactions, private online sales 26.50%, informal brokers known as gachas 11.50%, and certified dealer programmes 4.00%. No single seller holds a meaningful share of transactions.
Franchise dealers are the main formal players. Ennakl Automobiles, the Volkswagen Group distributor, runs the Das WeltAuto certified used programme, though its volumes remain small because late-model stock is scarce. Ben Jemâa Motors runs BMW Premium Selection, Italcar offers trade-ins for Fiat, Jeep and Alfa Romeo, and City Cars (Kia), ARTES (Renault and Dacia) and Alpha Hyundai Motor support trade-ins and servicing for their brands.
Online platforms are the main price reference. Tayara.tn is the largest general classifieds site, Automobile.tn is the leading specialist car portal, and Autoprix.tn aggregates listings and tracks prices. Platforms that add inspection, verified mileage and secure payment are best placed to win share from informal markets. Informal brokers remain influential because they offer instant cash, which platforms and dealers can only match by offering quick, guaranteed purchase prices.
Lenders shape access to newer cars. Tunisie Leasing & Factoring and Hannibal Lease finance vehicles for businesses and sell off-lease cars, and Banque Tuniso-Libyenne extended lease finance to used cars up to five years old. As certified stock and lease finance grow, the formal part of the market will expand from a small base.
Companies Covered
Companies covered in the report include:
Recent Market Activity
Table of Contents
Coverage & Segmentation
The study covers the Tunisia used car market nationally, with 2025 as the base year, 2021 – 2025 as the historical period and 2026 – 2030 as the forecast period. Values are in US dollars, converted from Tunisian dinars at TND 2.937 per US dollar in 2025, with an assumed depreciation of 3.5% a year over the forecast. The market is defined as the value of used passenger car and light commercial vehicle transactions, including ownership transfers, regularised diaspora vehicles and dealer and leasing resales. It is segmented by body type, powertrain and vehicle age.
New vehicle sales under import quotas, heavy commercial vehicles and motorcycles are excluded, as are finance, insurance and aftersales revenue. The transaction count, the average transaction value and the body type, powertrain, age, channel and regional splits are Marqstats estimates built on ATTT registration data and listing and dealer prices.