Market Snapshot
The India automotive wiring harness market is an estimated USD 2.93 billion (₹25,491 crore) in 2025 and is forecast to reach USD 4.80 billion (₹41,760 crore) by 2030, a 10.38% CAGR. Growth comes from heavier electrical content per vehicle, rising utility-vehicle mix and electric platforms, more than from extra vehicle builds.
Marqstats sizes the market as the value of low-voltage and high-voltage wiring harnesses, connectors, terminals and junction boxes fitted on vehicles assembled in India, plus replacement harnesses sold through the aftermarket. The base is a Marqstats construction: an estimated 32.95 million vehicles built in calendar 2025, multiplied by harness content per vehicle for each class, then calibrated against the audited revenue of the listed and rated harness makers. Exports of finished wiring sets under HSN 85443000 sit outside the total.
Passenger vehicles decide the market. They were about 15.9% of 2025 builds but carry 53.7% of harness value, because a mid-size utility vehicle carries roughly ten times the harness content of a commuter motorcycle. Electric vehicles are the second force: an estimated USD 0.44 billion of 2025 value, 15.02% of the total, rising to USD 1.18 billion by 2030, the same anchors Marqstats publishes for the India EV wire harness market.
Key Takeaways
Market Overview & Analysis
Report Summary
The analysis covers wiring harnesses fitted on passenger vehicles, commercial vehicles, two-wheelers and three-wheelers built in India, and replacement harnesses sold after the vehicle leaves the factory. Coverage spans 2021 to 2025 history and a 2026 to 2030 forecast, with 2025 as the base year. Four quantified dimensions split the total: vehicle type, propulsion platform, voltage class and sales channel. A regional view assigns base-year value to the assembly corridors where harnesses are consumed.
Three findings carry the page. First, harness value is a content story: the vehicle mix shifted to utility vehicles and connected two-wheelers, so supplier revenue grew roughly twice as fast as vehicle volume in FY26. Second, electric vehicles take an outsized share of future growth, and the high-voltage layer is where harness makers face new engineering and test demands. Third, the copper cost pass-through lag is the main short-term margin risk, visible in the MSWIL FY26 accounts where profit grew far slower than revenue.
Marqstats states its constructions as constructions. Vehicle builds by class, harness content per vehicle, the aftermarket share and the regional split are Marqstats estimates; supplier revenues are reported figures from company filings, offer documents and a published rating rationale. Where a company figure covers a fiscal year and the market covers a calendar year, the comparison is labelled as a ratio rather than a market share.
India Automotive Wiring Harness Market Size and Forecast
Marqstats estimates the market at USD 1.62 billion in 2021, USD 2.05 billion in 2022, USD 2.38 billion in 2023, USD 2.64 billion in 2024 and USD 2.93 billion in 2025. In rupees, at the fixed 2025 average rate of ₹87.00 per US dollar, the same series runs from ₹14,094 crore to ₹25,491 crore. The 2022 jump reflects the recovery in passenger vehicle output once semiconductor supply eased; later years track the utility-vehicle mix and rising feature content.
The forecast reaches USD 3.30 billion in 2026, USD 3.63 billion in 2027, USD 3.97 billion in 2028, USD 4.37 billion in 2029 and USD 4.80 billion in 2030, or ₹41,760 crore at the end of the period. The 2025 to 2030 CAGR is 10.38%, and absolute growth is USD 1.87 billion. Growth is front-loaded into 2026 because the GST rate cut on small cars and two-wheelers from 22 September 2025 lifted builds into early 2026: SIAM reported total production of 3.47 crore vehicles for FY2025-26, and domestic wholesales up 10.4% to 2.83 crore units.
The base rests on four build pools. Marqstats estimates calendar 2025 builds at 5.25 million passenger vehicles, 25.40 million two-wheelers, 1.10 million commercial vehicles and 1.20 million three-wheelers, 32.95 million in all. That total sits between the SIAM April to December 2025 production count of 25,371,989 units, which covers nine months, and the 3.47 crore units SIAM reported for FY2025-26. Average harness content of about ₹24,000 per passenger vehicle, ₹35,000 per commercial vehicle, ₹2,400 per two-wheeler and ₹5,500 per three-wheeler gives roughly ₹23,200 crore of factory fitment. Replacement harnesses add an estimated ₹2,294 crore.
Calibration matters more than the arithmetic. MSWIL reported FY26 revenue of ₹11,478 crore, Yazaki India Private Limited reported FY25 revenue of ₹4,483 crore in its September 2025 rating rationale, Dhoot Transmission Limited reported FY26 revenue from operations of ₹4,524.95 crore in its offer documents, and Minda Corporation Limited reported FY26 consolidated revenue of ₹6,185 crore, of which wiring harness is one of several product lines. These four groups alone account for most of the supply base once non-harness revenue and exports are removed, which is why Marqstats holds the 2025 total at ₹25,491 crore rather than the higher figure a pure builds-times-content model would allow.
This is a Marqstats construction. Content per vehicle is not published by any ministry, so the estimate is triangulated from supplier revenue, OEM build mix and harness bills of materials. A 10% error in average passenger vehicle content would move the 2025 total by about ₹1,370 crore, roughly 5%; the supplier calibration bounds that error, because the total cannot fall far below what MSWIL, Yazaki India, Dhoot Transmission and Minda Corporation sell into Indian assembly lines.
Electric Platforms Add a Second Harness, Not a Replacement
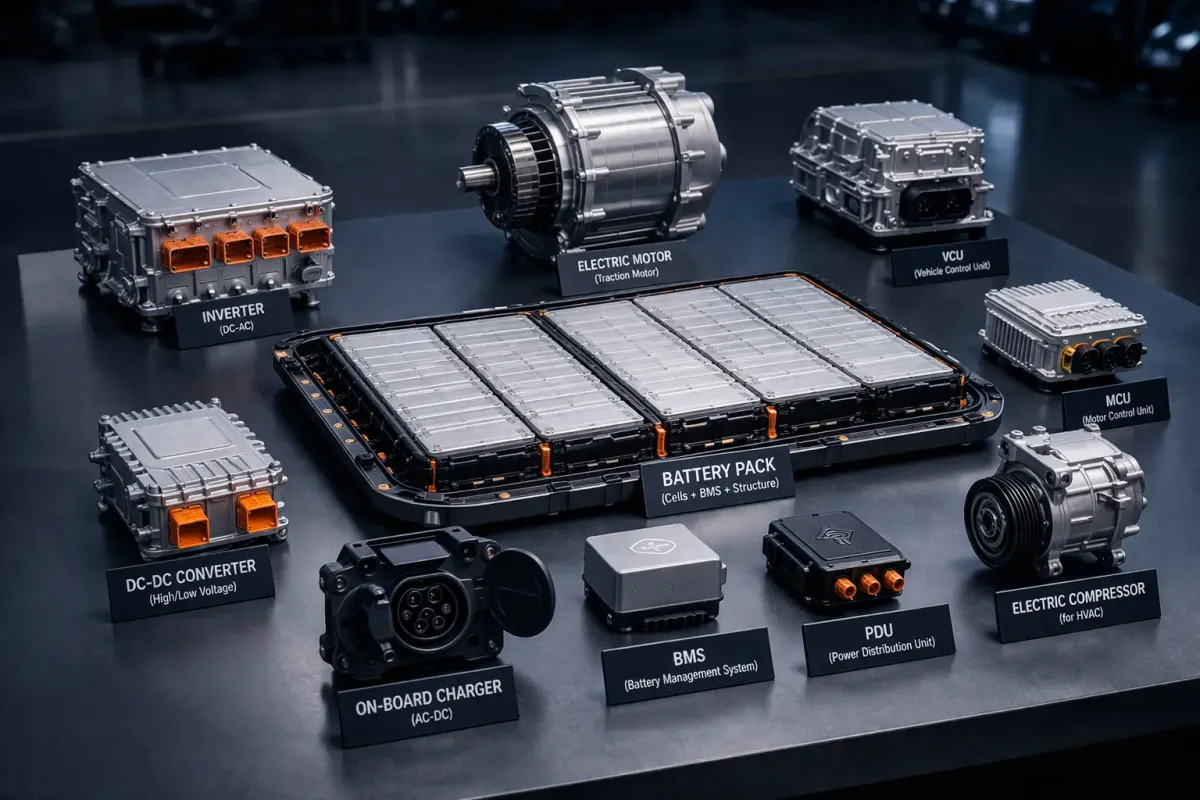
Electric vehicles raise harness value per unit because they keep the low-voltage network and add a high-voltage one. AIS-038 (Rev. 2), issued by the Automotive Research Association of India (ARAI) and aligned with UNECE Regulation No. 100, treats circuits above 60 V DC or 30 V AC as high voltage. Those circuits need orange insulation or conduit, shielded cable, sealed connectors and a high-voltage interlock loop. A battery-electric car therefore carries body, cockpit and chassis wiring much like its petrol twin, plus traction cables between battery, inverter, motor, onboard charger and charging inlet.
Registration data shows the scale of the shift. Calendar 2025 retail sales reached 1,280,168 electric two-wheelers, 797,727 electric three-wheelers, 176,980 electric passenger vehicles and 15,798 electric commercial vehicles including 4,395 buses, as reported by Autocar Professional in January 2026. Most electric two- and three-wheelers run 48 V to 60 V packs and stay below the high-voltage line. Electric cars, buses and trucks cross it.
Marqstats aligns the electric layer with its India EV Wire Harness Market page: an estimated USD 0.44 billion in 2025 rising to USD 1.18 billion by 2030, a 21.81% CAGR on the rounded anchors. That layer is part of this market, not an addition to it. Of the USD 0.44 billion, about 44% is high-voltage cabling, consistent with the 56% low-voltage share on the EV page; strong-hybrid traction wiring adds an estimated USD 0.02 billion, bringing the full high-voltage layer to USD 0.21 billion in 2025.
Copper Pass-Through Sets the Margin Cycle
Revenue growth and margin moved in opposite directions in FY26. MSWIL grew revenue 23.2% to ₹11,478 crore, yet profit after tax rose only 3.1% to ₹625 crore, and EBITDA of ₹1,061 crore works out to about 9.2% of revenue against roughly 10.7% a year earlier. Copper conductor is the largest single input in a harness, and OEM contracts reset metal prices with a lag of one to two quarters, so a rising copper price inflates revenue and squeezes margin at the same time.
Yazaki India shows the same exposure from the sourcing side. Crisil Ratings noted in September 2025 that about 25% of the raw material it consumes is imported from its parent and associate companies, and that around 40% of its debt is contracted from Yazaki Corporation. Import dependence on terminals, connectors and specialised cable keeps a currency element inside every harness price.
The implication is practical. Harness value in rupees tracks copper and the rupee as well as vehicles, so year-to-year market growth can overstate or understate real content growth. Marqstats holds the forecast at a constant ₹87.00 per US dollar and assumes metal pass-through completes within each year, so the 10.38% CAGR reflects volume and content rather than commodity swings.
Market Dynamics
Key Drivers
Four forces lift harness value faster than vehicle output.
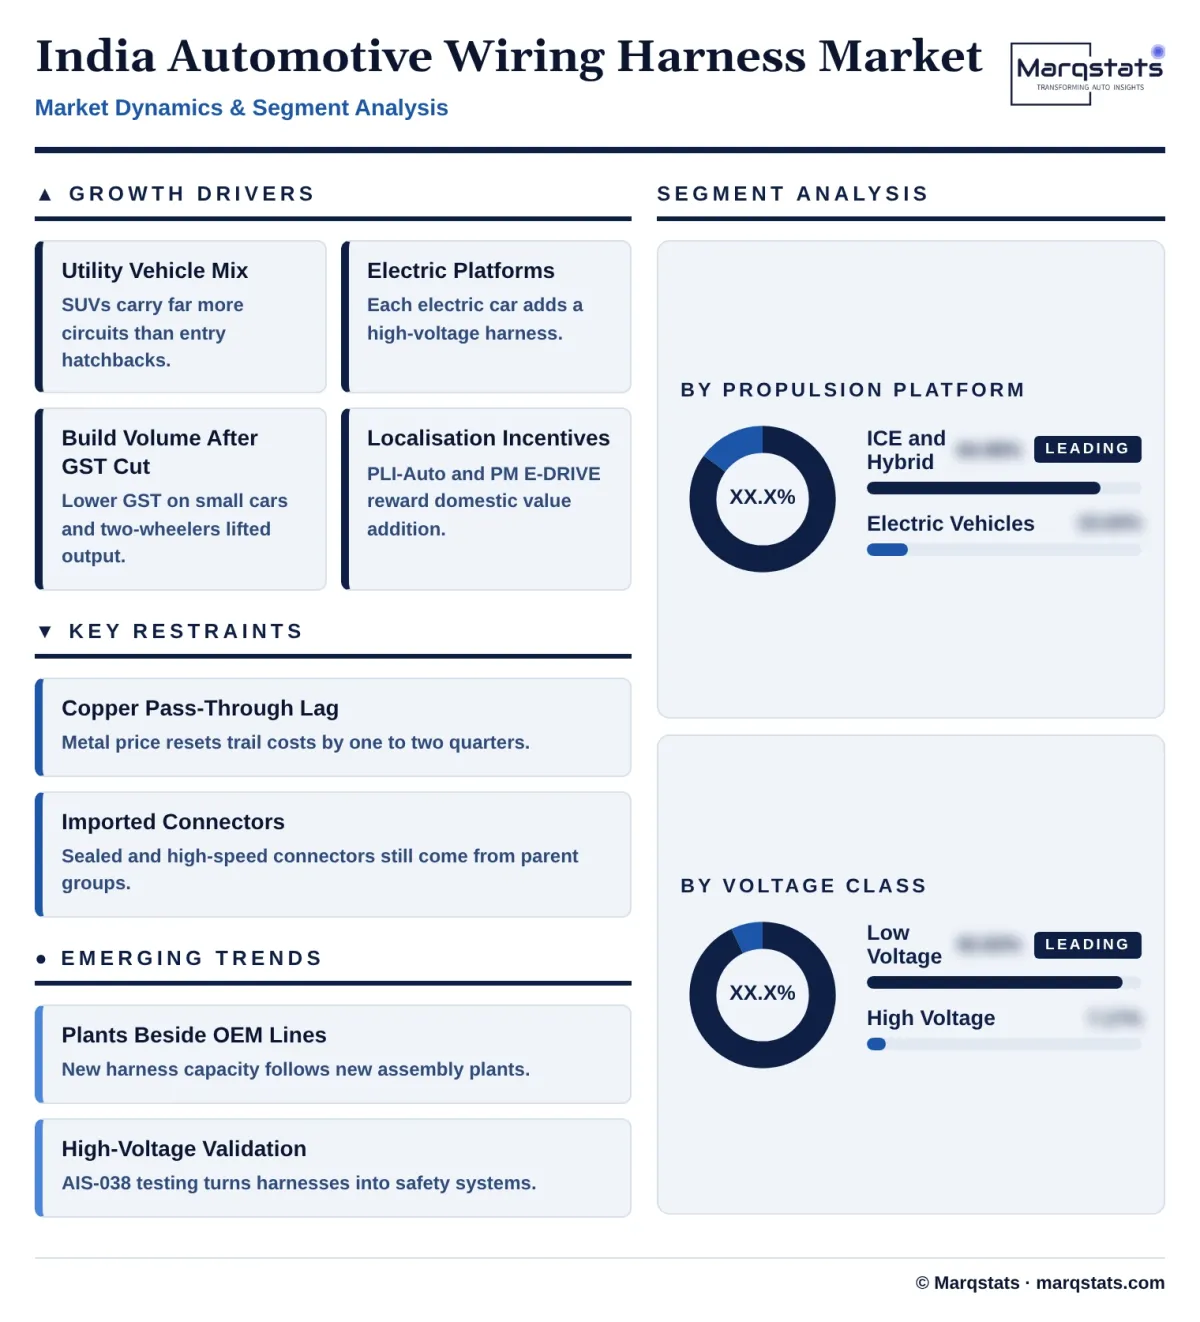
- Utility-vehicle mix: utility vehicles made up about 65% of FY25 passenger vehicle sales according to SIAM, and a mid-size SUV with a digital cockpit, 360-degree camera and powered seats needs far more circuits than an entry hatchback. Every point of mix shift adds harness content without adding a vehicle.
- Electric platforms: calendar 2025 electric passenger vehicle sales rose 77% to 176,980 units, and each one carries a high-voltage harness on top of the low-voltage network. The EV layer grows from USD 0.44 billion to USD 1.18 billion between 2025 and 2030.
- Build volume after the GST cut: the GST Council cut the rate on small cars and two-wheelers up to 350 cc from 28% to 18% from 22 September 2025, and SIAM reported FY2025-26 domestic wholesales up 10.4% to 2.83 crore units. Higher builds lift harness demand directly, since every vehicle needs a complete set.
- Localisation incentives: the Production Linked Incentive scheme for automobiles and auto components, with an outlay of ₹25,938 crore, and the PM E-DRIVE scheme, with an outlay of ₹10,900 crore including support for 14,028 electric buses, both reward domestic value addition. High-voltage harnesses and power distribution assemblies are among the components OEMs now source locally to qualify.
Key Restraints
Three constraints cap how much of that growth reaches supplier margins.
- Copper and currency lag: MSWIL FY26 profit after tax rose 3.1% on revenue growth of 23.2%, the clearest evidence that metal pass-through clauses reset too slowly to protect margin when copper climbs.
- Imported connectors and terminals: Yazaki India imports about 25% of its raw material from its parent group, per Crisil Ratings in September 2025. Sealed high-voltage connectors and high-speed data connectors are still largely imported, so a weaker rupee raises cost before prices reset.
- Zonal architectures cut wire length: as OEMs move from distributed wiring to zonal controllers linked by automotive Ethernet, total wire length per vehicle falls even as connector and data-cable value rises. Suppliers that sell mainly by length of copper lose value per vehicle in that transition.
Key Trends
Three trends change what a harness supplier sells.
- Capacity moves next to OEM plants: MSWIL listed greenfield plants at Pune, Navagam in Gujarat and Kharkhauda in Haryana in May 2025, and Yazaki India took a 3.16 lakh sq ft built-to-suit plant at Chengalpattu near Chennai in April 2025. Harnesses are bulky and built to trim level, so suppliers locate within a short delivery radius of assembly lines.
- Two-wheeler makers raise growth capital: Dhoot Transmission Limited opened its IPO on 10 August 2026 at ₹829 to ₹871 a share, with a ₹1,400 crore fresh issue that funds new harness plants at Jhajjar in Haryana and Shoolagiri near Hosur in Tamil Nadu.
- High-voltage engineering becomes a qualifying test: AIS-038 (Rev. 2) requirements on isolation, interlock loops and ingress protection turn the high-voltage harness into a validated safety system, which favours suppliers with in-house test labs and global parent designs.
Strategic Implications
- For entrants: compete in the high-voltage and connector layers rather than in low-voltage bundles. The EV layer grows at a 21.81% CAGR against 7.77% for the rest of the market, and buyers there pay for validated safety design rather than labour cost.
- For incumbents: protect margin through faster copper indexation and backward integration into terminals and connectors. The MSWIL FY26 accounts show that revenue growth alone does not carry profit when metal pass-through lags by a quarter or two.
- For suppliers and investors: the passenger vehicle layer, at 53.7% of 2025 value and 56.5% by 2030, decides group-level revenue, while two-wheeler harness makers depend on volume and the electric two-wheeler mix. Capital that funds high-voltage test capability and sealed-connector moulding addresses the part of the bill of materials that India still imports.
Market Segmentation
Passenger vehicles are the largest segment at an estimated USD 1.57 billion (₹13,689 crore), 53.70% of 2025 value, rising to USD 2.71 billion and 56.50% by 2030, an 11.54% CAGR. The segment wins on content, not volume: about 5.25 million builds carry average harness value near ₹24,000, and utility vehicles with ADAS, panoramic roofs and multiple displays sit well above that average. Electric cars push the number further, since each adds a high-voltage harness. Maruti Suzuki India Limited, Mahindra and Mahindra Limited, Tata Motors Passenger Vehicles Limited, Hyundai Motor India Limited and Toyota Kirloskar Motor Private Limited are the volume buyers, and MSWIL and Yazaki India are their main suppliers.
Two-wheelers are an estimated USD 0.79 billion (₹6,844 crore), 26.85% of 2025 value, reaching USD 1.10 billion and 23.00% by 2030, a 6.84% CAGR. They are 77% of builds but carry harness content of about ₹2,400 a unit, so the segment grows mainly with volume, with some lift from digital clusters, connected features and electric scooters. Dhoot Transmission Limited and Minda Corporation Limited are the leading suppliers to Bajaj Auto Limited, TVS Motor Company Limited, Hero MotoCorp Limited and Honda Motorcycle and Scooter India Private Limited. Share falls because passenger and commercial vehicles add content faster.
Commercial vehicles are an estimated USD 0.49 billion (₹4,232 crore), 16.60% of 2025 value, rising to USD 0.82 billion and 17.00% by 2030, a 10.85% CAGR. Trucks and buses carry the highest harness content per unit, about ₹35,000 on average, because of long chassis runs, trailer wiring, telematics and automated transmissions. Electric buses supported under PM E-DRIVE and the first electric heavy trucks add high-voltage cabling with heavy shielding. Tata Motors Limited, Ashok Leyland Limited, VE Commercial Vehicles Limited and Mahindra and Mahindra Limited are the main buyers.
Three-wheelers are the smallest segment at an estimated USD 0.08 billion (₹726 crore), 2.85% of 2025 value, rising to USD 0.17 billion and 3.50% by 2030, a 16.27% CAGR. The segment grows fastest because electric three-wheelers, 797,727 sold in calendar 2025, carry battery management and motor-controller wiring that a diesel or CNG auto-rickshaw does not. Most stay below 60 V, so the value gain comes from circuit count rather than high-voltage cable.
Internal combustion and hybrid platforms account for an estimated USD 2.49 billion, 84.98% of 2025 value, and USD 3.62 billion, 75.42% of 2030 value, a 7.77% CAGR. The segment still adds more absolute value than the electric layer, USD 1.13 billion over the period, because it carries the passenger vehicle volume and the full commercial vehicle fleet. Strong hybrids belong here; their traction wiring is counted in the high-voltage voltage class.
Electric vehicles, meaning battery-electric, plug-in hybrid and fuel-cell platforms across all vehicle types, account for an estimated USD 0.44 billion, 15.02% of 2025 value, rising to USD 1.18 billion and 24.58% by 2030, a 21.81% CAGR. These anchors match the Marqstats India EV Wire Harness Market page, and the slice includes both the low-voltage and high-voltage harnesses fitted on electric vehicles plus their replacement sales. Electric two- and three-wheelers dominate unit count, while electric cars and buses dominate value per unit.
Low-voltage harnesses, covering 12 V and 24 V networks and the 48 V to 60 V systems of most electric two- and three-wheelers, are an estimated USD 2.72 billion, 92.83% of 2025 value, and USD 4.15 billion, 86.46% of 2030 value, an 8.82% CAGR. Body, cockpit, chassis and powertrain wiring all sit here, and so does the growth in camera, radar and display links.
High-voltage harnesses are an estimated USD 0.21 billion, 7.17% of 2025 value, rising to USD 0.65 billion and 13.54% by 2030, a 25.35% CAGR. About USD 0.19 billion of the 2025 figure is the high-voltage portion of the electric-vehicle layer and an estimated USD 0.02 billion comes from strong hybrids. The class grows faster than the EV layer as a whole because electric cars, buses and trucks, which cross 60 V, gain share within EV harness value against electric two-wheelers, which do not.
Factory fitment is an estimated USD 2.67 billion, 91.00% of 2025 value, rising to USD 4.39 billion and 91.50% by 2030, a 10.46% CAGR. Harnesses are designed into a vehicle platform two to three years before launch and supplied just in sequence, so the OEM channel follows build volume and content almost exactly.
Replacement harnesses are an estimated USD 0.26 billion, 9.00% of 2025 value, reaching USD 0.41 billion and 8.50% by 2030, a 9.54% CAGR. Demand comes from collision repair, rodent damage and the large two-wheeler parc, and is served through OEM spare-parts networks and supplier retail brands. Share eases slightly because new vehicles add content faster than the parc ages.
By Geography
North India
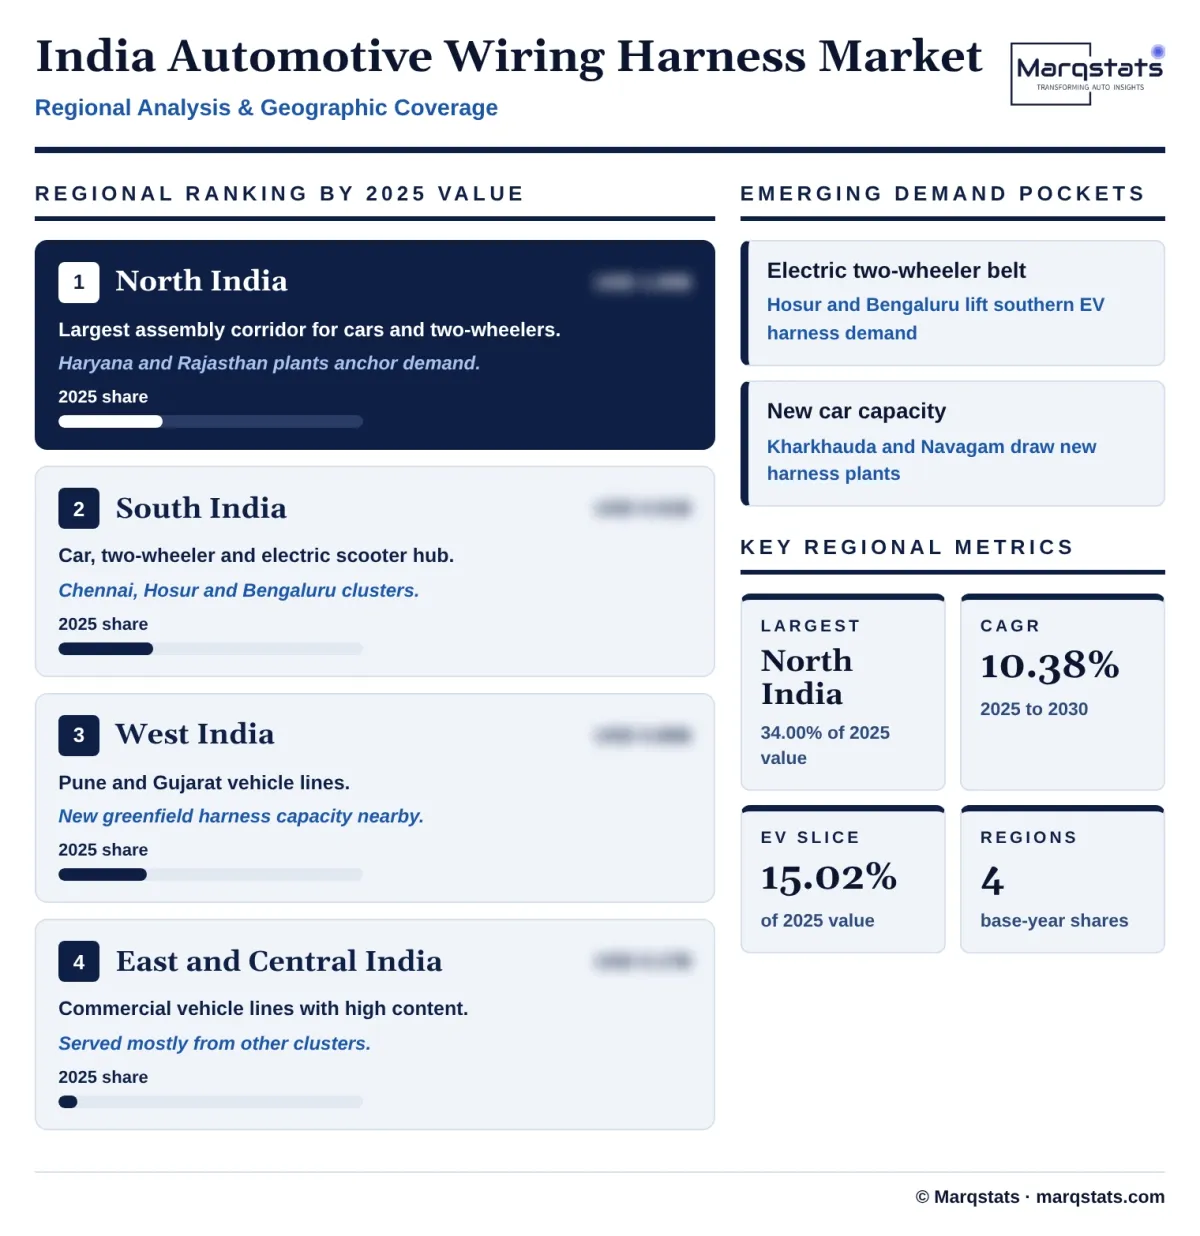
North India is the largest region at an estimated USD 1.00 billion, 34.00% of 2025 value. Maruti Suzuki India Limited builds at Gurugram, Manesar and Kharkhauda in Haryana, Hero MotoCorp Limited and Honda Motorcycle and Scooter India Private Limited run large two-wheeler plants in Haryana and Rajasthan, and Uttarakhand hosts commercial vehicle and two-wheeler lines. The MSWIL Kharkhauda project follows the newest Maruti Suzuki capacity. Marqstats publishes base-year regional shares only.
South India
South India accounts for an estimated USD 0.91 billion, 31.00% of 2025 value. Tamil Nadu hosts Hyundai Motor India Limited, Renault and Nissan, TVS Motor Company Limited, Royal Enfield and Ashok Leyland Limited; Karnataka hosts Toyota Kirloskar Motor Private Limited and the largest Honda two-wheeler plant; Andhra Pradesh hosts Kia India. The region carries an above-average electric share through Hosur and Bengaluru two-wheeler makers, and the Yazaki India Chengalpattu plant targets this cluster.
West India
West India accounts for an estimated USD 0.85 billion, 29.00% of 2025 value. Maharashtra hosts Tata Motors, Mahindra and Mahindra Limited and Bajaj Auto Limited at Pune, Chakan and Aurangabad, and Gujarat hosts Maruti Suzuki at Hansalpur, Tata Motors at Sanand and MG Motor at Halol. MSWIL opened greenfield capacity at Pune and Navagam to serve these lines, and Minda Corporation Limited has expanded harness capacity at Chakan.
East and Central India
East and Central India is the residual region at an estimated USD 0.17 billion, 6.00% of 2025 value. Jamshedpur in Jharkhand and Pithampur in Madhya Pradesh build commercial vehicles, so the region carries high content per unit on small volume. Few harness suppliers run plants here; most serve these lines from northern and western clusters.
How Competition Is Evolving
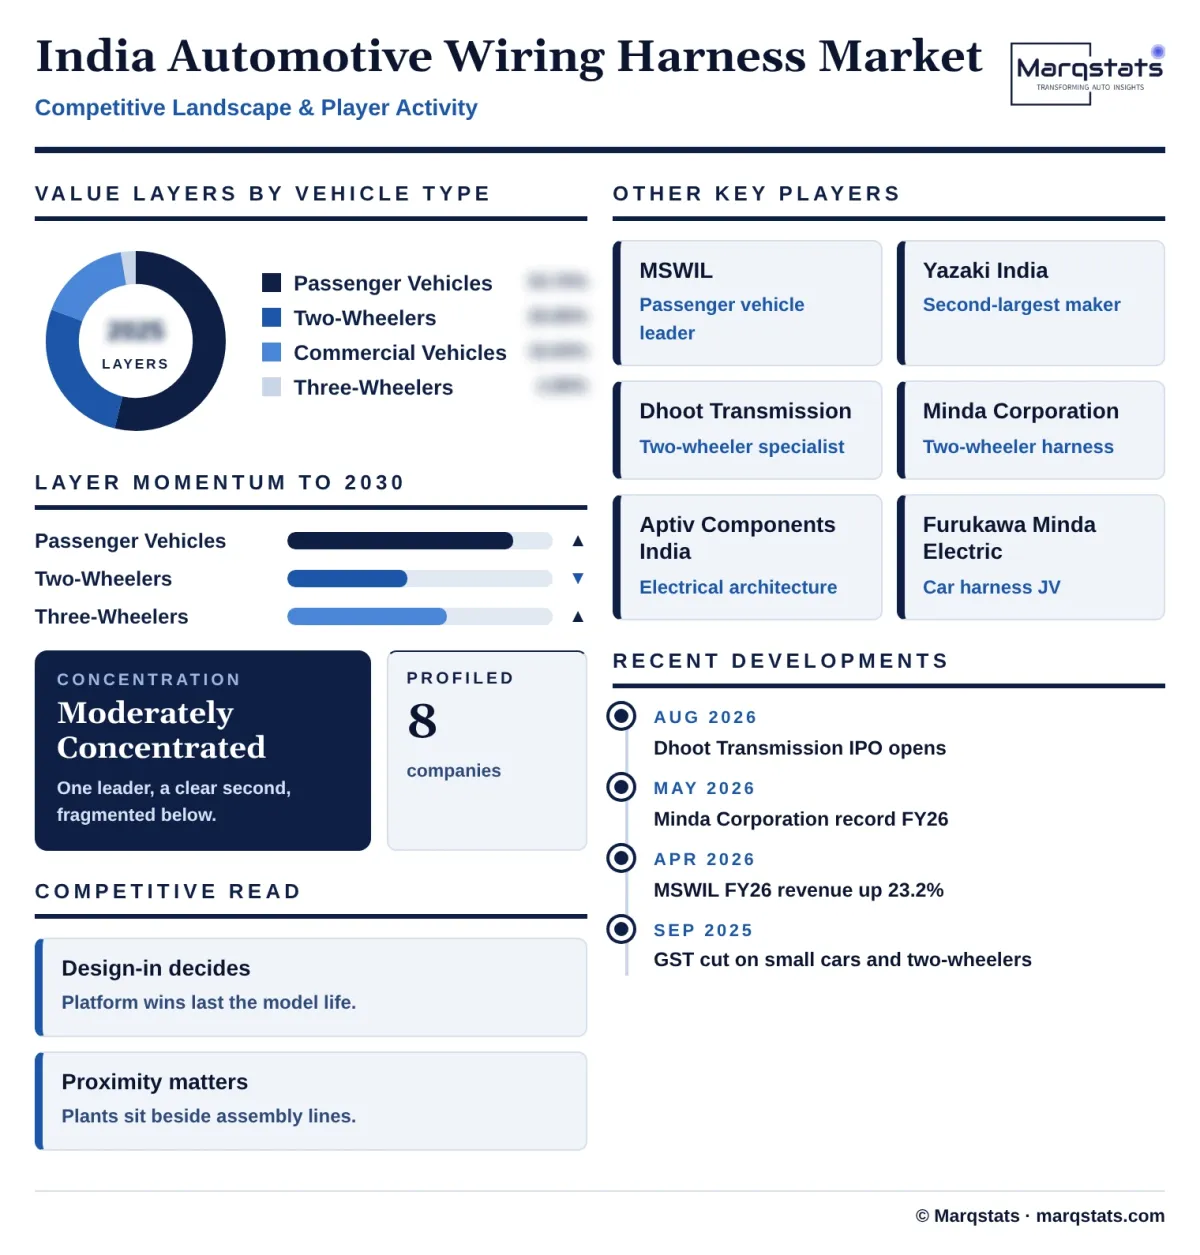
Supply is concentrated at the top and fragmented below. MSWIL reported FY26 revenue of ₹11,478 crore, equal to about 45% of the Marqstats 2025 market value; because the company figure covers April 2025 to March 2026 and includes some non-domestic sales, Marqstats treats it as a ratio, not an audited share. Crisil Ratings describes Yazaki India Private Limited as the second-largest wire harness maker in India, with FY25 revenue of ₹4,483 crore. Dhoot Transmission Limited and Minda Corporation Limited lead the two-wheeler layer. The order at the top is settled; the contest is in electric two-wheelers and high-voltage programmes.
Suppliers compete on design-in and proximity more than on price. A harness is engineered with the vehicle, tooled for each trim and delivered just in sequence, so the supplier that wins the platform keeps it for the model life, often six to eight years. Plants sit within short trucking distance of assembly lines, which is why MSWIL, Yazaki India and Dhoot Transmission all expand next to new OEM capacity. In the high-voltage layer, the axis shifts to validated design under AIS-038 (Rev. 2), shielding performance and access to parent-group connector technology.
The value chain explains who earns what. Wire drawing, insulation compounding, cutting, crimping and taping are largely domestic, while sealed high-voltage connectors, high-speed data connectors and many terminal designs come from parent groups in Japan, Europe and Korea. Marqstats builds a group-level league table in the delivered analysis; the public view shows value layers by vehicle type instead, since company shares are not published by a registry.
Companies Covered
Companies covered in the report include:
Recent Market Activity
Table of Contents
Coverage & Segmentation
Included: low-voltage and high-voltage wiring harnesses, connectors, terminals, conduits, fuse and junction boxes fitted on passenger vehicles, commercial vehicles, two-wheelers and three-wheelers assembled in India, plus replacement harnesses sold in India. Value is measured at supplier selling price excluding GST, in US dollars at a constant ₹87.00 per US dollar. History covers 2021 to 2025 and the forecast covers 2026 to 2030.
Excluded: exports of finished wiring sets under HSN 85443000, which Marqstats tracks separately; bulk cable sold under HSN 854442 and 854460 before assembly; tractors, construction equipment and off-highway machines; and charging cables supplied with chargers. The Marqstats Egypt Automotive Wiring Harness Market page measures manufacturing output, most of it exported; this page measures harness consumption at Indian assembly lines, so the two are not comparable on method.
Do not add: the India EV Wire Harness Market (USD 0.44 billion in 2025, USD 1.18 billion in 2030) is the electric-vehicle slice of this market and is already inside the USD 2.93 billion total. The wiring harness and high-voltage connector pool within the India EV Component Market is the same slice again. Adding either to this page double counts.