Market Snapshot
Middle bar: base-year value × (1 + CAGR), rounded to two decimals. This is a calculated illustration, not a separately researched annual estimate.
The global used EV financing market size is estimated at USD 25.50 billion in 2025 and is projected to reach USD 68.42 billion by 2030, growing at a CAGR of 21.82% over 2026 – 2030. The number of financed used electric vehicles rises from about 1.28 million to 4.02 million a year, a 25.72% annual rate, while the average amount financed per contract falls from about USD 19,900 to USD 17,000.
Marqstats defines the market as the value of new loans, hire purchase agreements, personal contract purchase agreements, leases and subscriptions written each year to fund second-hand battery electric and plug-in hybrid passenger cars and light commercial vehicles. Cash purchases, dealer stock finance, outstanding balances on older loans, conventional hybrids and fuel cell vehicles are excluded.
Hire purchase and secured loans account for an estimated 56.00% of 2025 originations, battery electric vehicles for 72.00% and commercial banks and credit unions for 43.02%. China accounts for 42.00% of 2025 originations and Europe for 32.98%. The study segments the market by product type, powertrain, lender type and region.
Key Takeaways
Market Overview & Analysis
Report Summary
Marqstats sizes the used EV financing market as the value of finance contracts written each year to buy second-hand battery electric and plug-in hybrid vehicles. In 2025 lenders wrote an estimated USD 25.50 billion of such contracts, financing about 1.28 million vehicles at an average of about USD 19,900 per contract.
The market sits within a much larger used vehicle economy. Marqstats estimates used vehicles of all types trade for about USD 1.48 trillion a year worldwide, formal lenders finance about USD 488.50 billion of used vehicle purchases, and second-hand plug-in vehicles change hands for about USD 74.20 billion. Of that, around 41.50% of used EV purchase value is financed, at an average loan-to-value ratio of about 76.50%, lower than the 85% to 100% typical for petrol and diesel cars because lenders hold back part of the price against battery and price risk.
Used EV supply comes mainly from the first large wave of new EVs, many of which were bought by companies or leased. Three-year corporate leases written in 2021 to 2023 are now returning in large numbers, especially in the UK, Germany and France, and leasing companies such as Ayvens and Arval decide how this stock reaches the used market. In China, used new energy vehicle sales reached about 1.61 million units in 2025, about 8% of the 20.11 million used cars sold.
Underwriting a used EV differs from underwriting a used petrol car. The battery accounts for 30% to 40% of the vehicle value, and two cars of the same age and mileage can have very different battery condition depending on how often they were fast-charged and the climate they operated in. Lenders are moving from age-and-mileage pricing to battery state-of-health checks, linking loan-to-value limits and terms to measured battery capacity and remaining manufacturer battery warranty.
The market grew from USD 4.85 billion in 2021 to USD 7.90 billion in 2022, USD 12.40 billion in 2023 and USD 18.15 billion in 2024, as off-lease EVs and subsidised used vehicles entered the market and buyers relied on credit to cover the price premium over petrol cars. Marqstats expects USD 33.66 billion in 2026 and USD 68.42 billion in 2030.
Product structures differ by region. In the UK and much of Europe, personal contract purchase agreements defer 40% to 55% of the vehicle price to a final balloon payment, so a fall in used EV values can leave the contract worth less than the guaranteed future value and push vehicles back to the lender. In the United States, longer instalment loans of six years or more reduce monthly payments but increase negative equity risk. In China, shorter consumer loans dominate, while in India banks such as State Bank of India and non-bank lenders such as Poonawalla Fincorp offer used EV loans with terms of up to six to eight years.
Global Used EV Financing Market Size and Forecast
The global used EV financing market grows from USD 25.50 billion in 2025 to USD 68.42 billion in 2030, a CAGR of 21.82%. Marqstats expects USD 42.41 billion in 2027, USD 51.32 billion in 2028 and USD 60.04 billion in 2029. Annual growth slows from 40.50% in 2025 and 32.00% in 2026 to 13.96% in 2030 as the market matures.
Volume drives growth. Financed used EVs rise from about 1.28 million in 2025 to 1.76 million in 2026, 2.29 million in 2027, 2.85 million in 2028, 3.43 million in 2029 and 4.02 million in 2030. The average amount financed falls from about USD 21,500 in 2021 and USD 19,900 in 2025 to USD 17,000 in 2030 as off-lease supply grows and new EV prices fall.
Financing penetration is the most important assumption. Marqstats estimates that each percentage point change in the share of used EV purchases financed moves 2025 originations by about USD 0.61 billion, each percentage point change in average loan-to-value moves them by about USD 0.33 billion, and each USD 1,000 change in the average financed used EV price moves them by about USD 0.98 billion.
Prices are the main risk, not battery failure. Independent diagnostic data from large European fleets indicate that most traction batteries keep well over 90% of usable capacity over typical three-to-five-year finance terms. The bigger risk to lenders is a fall in used EV prices caused by new EV price cuts and better range on newer models, which can push balloon contracts into negative equity.
The mix of contracts changes. Loans and hire purchase fall from 56.00% to 48.00% of originations, while personal contract purchase and leases rise from 34.98% to 40.00% and subscriptions from 9.02% to 12.00%. Battery electric vehicles rise from 72.00% to 80.01%, and specialist lenders from 14.98% to 17.99%.
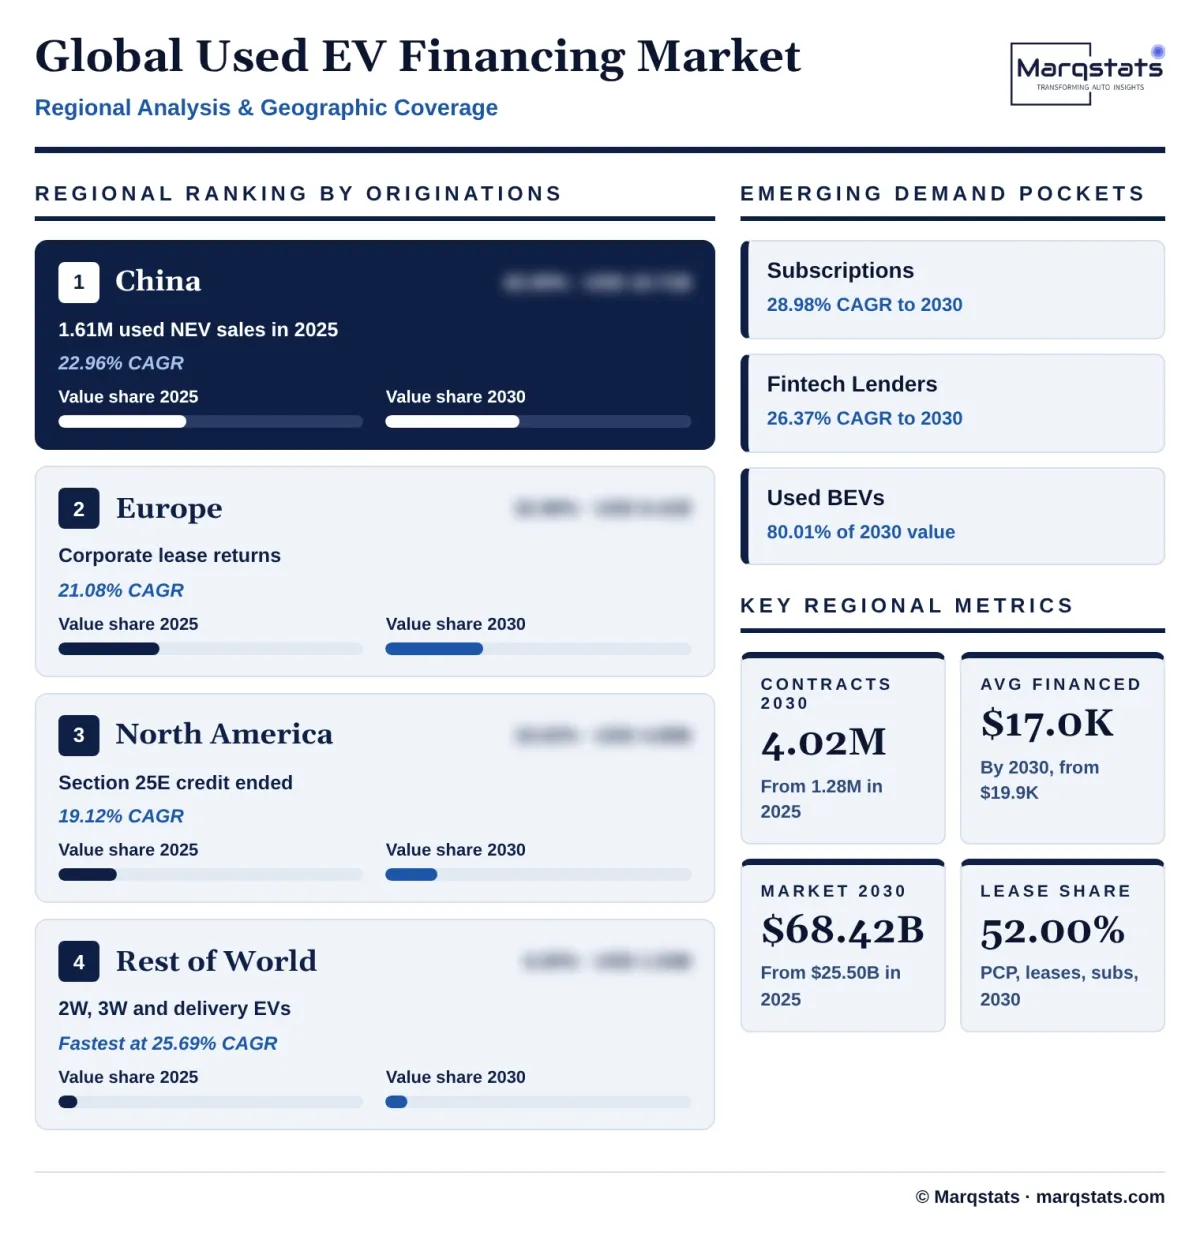
Regional growth rates converge. China grows at 22.96% a year and rises from 42.00% to 43.99% of originations, Europe grows at 21.08% and holds about a third of the market, North America grows at 19.12% and falls from 19.02% to 17.00%, and the Rest of World region grows at 25.69% to 7.02%. Marqstats tracks four indicators to monitor the forecast: used EV transaction volumes, average used EV prices, finance penetration and loan-to-value ratios, and the share of contracts backed by battery health certificates.
Market Dynamics
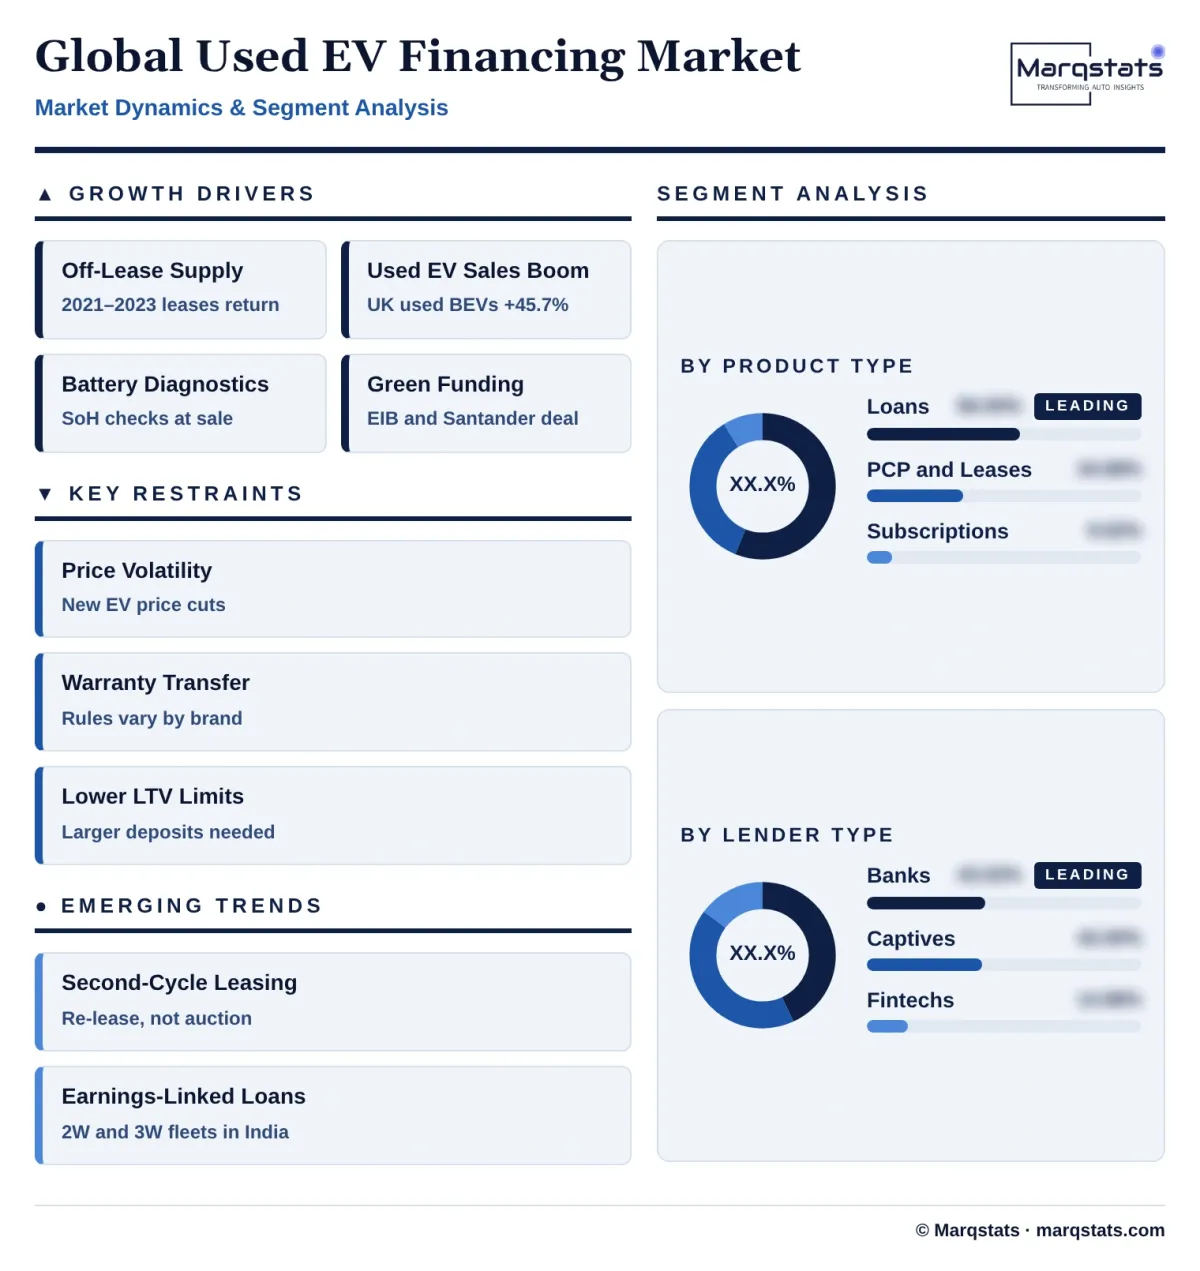
Key Drivers
Five forces are expanding finance for second-hand electric vehicles.
- Off-lease supply. Large numbers of three-year corporate and consumer EV leases written in 2021 to 2023 are returning, giving dealers and lenders a steady flow of young used EVs to finance.
- Used EV sales are growing fast. UK used battery electric car sales rose 45.7% in 2025, and China sold about 1.61 million used new energy vehicles, up about 43%.
- Lower prices widen the buyer base. Falling used EV prices bring the vehicles within reach of buyers who rely on finance, especially for vehicles priced at USD 15,000 to 25,000.
- Battery diagnostics reduce lender risk. Rapid battery tests from providers such as AVILOO and Recurrent, and certificates from remarketing platforms such as Ayvens Carmarket, give lenders evidence of battery condition at the point of sale.
- Green funding lowers the cost of capital. The EIB Group and Santander Consumer Bank agreed a synthetic securitisation in March 2026 that unlocks PLN 860 million for new green loans in Poland, including electric vehicles.
Key Restraints
Four constraints make used electric vehicles harder to lend against than petrol and diesel cars.
- Price volatility. Cuts in new EV prices, such as the price war across many models in China in 2025, quickly reduce used values and raise the risk of negative equity on balloon contracts.
- Battery warranty transfer. Rules on whether manufacturer battery warranties pass to second owners vary by brand and country, and some policies void cover on transfer or commercial use, leaving lenders exposed.
- Lower loan-to-value limits. Lenders cap advances on used EVs below those for petrol and diesel cars, requiring larger deposits from buyers.
- Subsidy withdrawal. The end of the US Section 25E used clean vehicle credit in September 2025 removed a point-of-sale subsidy that reduced borrowing needs.
Key Trends
Four shifts are changing how lenders underwrite and structure used EV finance.
- Battery health in underwriting. Lenders are linking loan-to-value limits and terms to measured state of health and remaining battery warranty rather than age and mileage alone.
- Second-cycle leasing. Leasing companies and captive finance arms re-lease returning EVs on 24-to-36-month terms instead of selling them into wholesale auctions.
- Digital remarketing platforms. Santander Consumer and Openbank launched Santander Used Cars Trade in June 2026, a B2B platform for remarketing used vehicles across European markets, joining Ayvens Carmarket.
- Earnings-linked commercial lending. In India and Southeast Asia, fintechs finance used electric two- and three-wheelers with daily or weekly repayments taken from delivery and ride-hailing earnings, backed by telematics and remote immobilisation.
Strategic Implications
- For banks and credit unions, battery data are the edge. Building battery state-of-health checks into the loan application lets banks lend on used EVs that cautious lenders reject and price risk more accurately.
- For captive finance companies, warranty transfer protects residual values. Extending manufacturer battery warranties to second owners, combined with certified used programmes, supports used prices and lowers loss given default.
- For leasing companies, second-cycle leasing reduces losses. Re-leasing returning vehicles rather than selling them at auction spreads depreciation over a second contract and avoids selling into weak wholesale markets.
- For fintechs and non-bank lenders, commercial fleets are the opportunity. Linking repayments to platform earnings and telematics allows controlled losses on used electric two-wheelers, three-wheelers and vans that banks treat cautiously.
- For diagnostic providers, accreditation matters. Certification through bodies such as the European Car Remarketing Association and integration into credit bureau and loan origination systems will drive adoption.
- For investors in auto asset-backed securities, EV sub-pool data are needed. Most securitisations still combine used battery electric, plug-in hybrid and petrol vehicles in the same pools, so investors who push for separate reporting of EV default and recovery rates will be better placed to price tranches as used EVs become a larger share of auto loan books.
Market Segmentation
Fully amortising loans and hire purchase agreements, where the buyer carries all depreciation and battery risk, account for 56.00% of 2025 originations, USD 14.28 billion, rising to USD 32.84 billion by 2030, an 18.12% CAGR, while their share falls to 48.00%. Banks such as Ally Financial and Wells Fargo in the United States and State Bank of India and ICICI Bank in India are active lenders.
Balloon contracts and second-hand leases, where the lender or leasing company carries residual value risk, account for 34.98% of 2025 originations, USD 8.92 billion, and grow at 25.14% a year to USD 27.37 billion and 40.00% of the market by 2030. Santander Consumer Finance, Volkswagen Financial Services and leasing companies such as Ayvens are leading providers.
All-inclusive subscriptions bundling the vehicle, insurance, maintenance and sometimes charging account for 9.02% of 2025 originations, USD 2.30 billion, and grow fastest, at 28.98% a year, to USD 8.21 billion and 12.00% of the market by 2030. Octopus Electric Vehicles in the UK and FINN in Germany and the United States offer used EV subscriptions and leases.
Used battery electric vehicles account for 72.00% of 2025 originations, USD 18.36 billion, and grow at 24.42% a year to USD 54.74 billion and 80.01% of the market by 2030. Tesla Model 3 and Model Y, BYD Atto 3, Volkswagen ID.3 and ID.4 and Nissan Leaf are among the most financed models.
Used plug-in hybrids account for 28.00% of 2025 originations, USD 7.14 billion, rising to USD 13.68 billion by 2030, a 13.89% CAGR, while their share falls to 19.99% as buyers and lenders weigh the cost of maintaining both an engine and a battery.
Carmaker finance arms such as Volkswagen Financial Services, BMW Financial Services and Tesla Finance account for 42.00% of 2025 originations, USD 10.71 billion, rising to USD 27.37 billion by 2030, a 20.64% CAGR. They use subsidised rates, certified used programmes and buyback guarantees to support brand residual values.
Commercial banks and credit unions account for 43.02% of 2025 originations, USD 10.97 billion, the largest lender group, rising to USD 28.74 billion by 2030, a 21.24% CAGR. They compete on interest rates and increasingly use third-party battery diagnostics.
Specialist fintechs and non-bank lenders account for 14.98% of 2025 originations, USD 3.82 billion, and grow fastest, at 26.37% a year, to USD 12.31 billion and 17.99% of the market by 2030. Revfin, TapFin, Poonawalla Fincorp and Credifin in India use telematics and earnings data to finance commercial EVs.
By Geography
China
China is the largest market, with 42.00% of 2025 originations, USD 10.71 billion, rising to USD 30.10 billion by 2030, a 22.96% CAGR, and 43.99% of the market. Used new energy vehicle sales reached about 1.61 million units in 2025, about 8% of 20.11 million used car sales, and most transactions fall in the RMB 50,000 to 150,000 range. New car price cuts across many models in 2025 reduced used values, leading lenders to shorten terms and lower loan-to-value limits. Cross-province transfers and exports complicate collateral tracking, and new rules effective January 2026 require manufacturer after-sales confirmation for used cars exported within 180 days of first registration.
Europe
Europe accounts for 32.98% of 2025 originations, USD 8.41 billion, rising to USD 21.89 billion by 2030, a 21.08% CAGR. Returning corporate leases supply most young used EVs, and leasing companies such as Ayvens and Arval manage their remarketing. UK used battery electric car sales rose 45.7% in 2025 to 274,815. Ayvens Carmarket introduced battery health certificates in Germany, France, Portugal and the Netherlands in September 2025, and Santander Consumer and Openbank launched the Santander Used Cars Trade platform in June 2026.
North America
North America accounts for 19.02% of 2025 originations, USD 4.85 billion, rising to USD 11.63 billion by 2030, a 19.12% CAGR, the slowest of the four regions. The end of the USD 4,000 Section 25E used clean vehicle credit after 30 September 2025 removed a point-of-sale subsidy, and longer loan terms of six years or more are becoming more common, raising negative equity risk on vehicles that depreciate quickly. Used EV listing prices have fallen; the average was about USD 34,821 in February 2026, down 8.5% from a year earlier.
Rest of World
India, Southeast Asia, Latin America and other markets account for 6.00% of 2025 originations, USD 1.53 billion, and grow fastest, at 25.69% a year, to USD 4.80 billion and 7.02% of the market by 2030. Used EV finance in these markets is led by commercial electric two-wheelers, three-wheelers and delivery vehicles, financed by specialist non-bank lenders using telematics and earnings-linked repayments.
How Competition Is Evolving
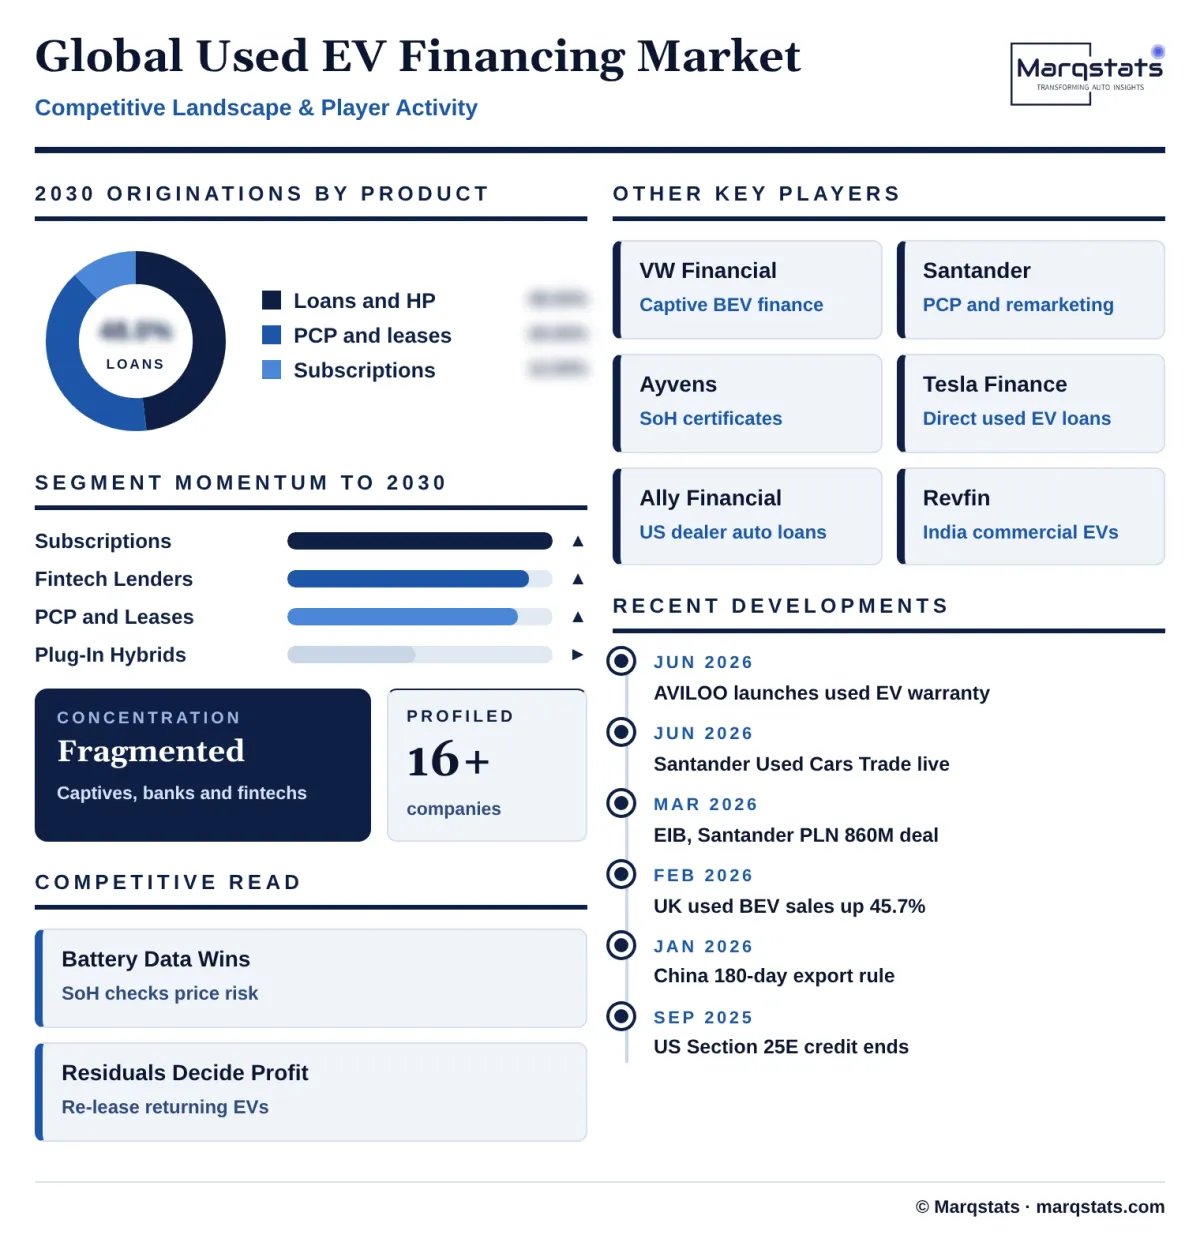
The used EV financing market is fragmented across thousands of lenders, but a group of large captive finance companies, banks and leasing groups shape pricing and risk practices. Volkswagen Financial Services, BMW Financial Services, Tesla Finance, Santander Consumer Finance, BNP Paribas Personal Finance and Ally Financial are among the largest lenders, while Ayvens and Arval control much of the young used EV supply in Europe.
Battery diagnostics and remarketing platforms are becoming part of the competitive landscape. AVILOO provides battery tests and warranties to lenders, leasing companies and auction groups such as BCA, Recurrent provides battery reports to US dealers, and Ayvens Carmarket and Santander Used Cars Trade operate B2B remarketing platforms.
In emerging markets, specialist lenders compete on data rather than price. Revfin, TapFin, Poonawalla Fincorp, Credifin and Ecofy in India use vehicle telematics and borrower earnings to finance used EVs that banks treat cautiously.
Competition will be decided by battery data, residual value management and funding costs. Lenders that combine point-of-sale battery checks, second-cycle leasing and low-cost green funding will win the most profitable business.
Partnerships between lenders, carmakers and data providers are increasing. Santander Consumer Finance provides point-of-sale finance for brands such as MG in the UK, leasing companies such as Ayvens and Arval use independent battery tests in end-of-lease remarketing, and auction groups such as BCA have integrated AVILOO battery testing. Credit bureaus are also adding battery data to vehicle history reports, giving lenders another source of information when they price used EV loans.
Companies Covered
Companies covered in the report include:
Recent Market Activity
Table of Contents
Coverage & Segmentation
The study covers the global used EV financing market, with 2025 as the base year, 2021 – 2025 as the historical period and 2026 – 2030 as the forecast period. Values are in US dollars and measure new contracts written each year. The market covers loans, hire purchase, personal contract purchase, leases and subscriptions for second-hand battery electric and plug-in hybrid passenger cars and light commercial vehicles, segmented by product type, powertrain, lender type and region.
Cash purchases, dealer stock finance, outstanding loan balances, short-term rentals of less than 30 days, conventional hybrids and fuel cell vehicles are excluded. Segment and regional splits are Marqstats estimates built on used EV transaction data, finance penetration and loan-to-value benchmarks, lender disclosures and average used EV prices.