Market Snapshot
Middle bar: base-year value × (1 + CAGR), rounded to two decimals. This is a calculated illustration, not a separately researched annual estimate.
The global micromobility docking and charging rack market size is estimated at USD 489.00 million in 2025 and is projected to reach USD 625.00 million by 2030, growing at a CAGR of 5.03% over 2026 – 2030. Marqstats estimates about 110,000 bikeshare docks, 13.1 million community charging ports and 60,000 secure parking and charging bays were installed worldwide in 2025.
Marqstats defines the market as the installed equipment value of docking stations, charging racks, charging piles and secure parking units for bicycles, e-bikes and e-scooters. It covers bikeshare docks and kiosks, powered and unpowered, community and residential e-bike charging piles, and smart parking and charging racks and lockers, including solar-powered units. Battery-swap cabinets, chargers for cars, vans and buses, plain unpowered bike stands, the vehicles themselves and rental or charging fees are excluded.
Community charging stations account for 46.01% of 2025 value, bikeshare docking stations for 40.49% and secure parking and charging racks for 13.50%. Asia Pacific accounts for 55.01% of 2025 value, almost all of it in China, and Europe for 23.11%. The study segments the market by product type, power type, installation setting and region.
Key Takeaways
Market Overview & Analysis
Report Summary
Marqstats sizes the micromobility docking and charging rack market as the installed equipment value of hardware that holds, locks and charges bicycles, e-bikes and e-scooters. In 2025 the market was worth an estimated USD 489.00 million, made up of about 110,000 bikeshare docks at an average of about USD 1,800 per dock including the station share of kiosks and payment terminals, about 13.1 million community charging ports at about USD 16 per port, and about 60,000 secure parking and charging bays at about USD 1,100 per bay.
Three types of buyer make up the market. Bikeshare operators and cities buy docking stations, where each dock locks a bike, reads its identity and, on newer powered models, charges the e-bike battery while it is parked. Residential compounds, property managers and local governments, mostly in China, buy community charging piles that let riders charge their own electric bicycles outdoors and pay per session, keeping batteries out of stairwells and homes. Campuses, workplaces, transit agencies, landlords and city councils buy secure parking racks and lockers that lock privately owned bikes and e-scooters and, in many cases, charge them.
The products differ widely in price. A Chinese community charging pile with ten ports costs a few hundred US dollars, while a powered bikeshare dock with its share of the station kiosk, power cabinet and grid connection can cost several thousand US dollars. A smart parking dock or charging locker from Bikeep, PARAT, Swiftmile or Locky Dock typically costs from several hundred to a few thousand US dollars per bay, depending on charging, access control and whether it runs on solar power.
The market grew from an estimated USD 318.00 million in 2021 to USD 336.00 million in 2022 and USD 357.00 million in 2023, then jumped to USD 446.00 million in 2024 and USD 489.00 million in 2025 as Chinese cities installed charging piles at scale during the national safety campaign. Bikeshare docking spending was steadier, supported by expansions in New York, Mexico City, Paris, Madrid, Barcelona and other large systems and by new systems such as Bizi in Zaragoza, which Lyft launched in January 2025.
Fire safety links all three segments. Lithium-ion battery fires in homes and apartment buildings have pushed governments to move e-bike charging outdoors or into controlled spaces. China focused on charging infrastructure, New York City on product certification under Local Law 39 of 2023, which requires e-bikes, e-scooters and their batteries sold, leased or rented in the city to be certified to UL 2849, UL 2272 or UL 2271, and other cities on secure parking and charging hubs for delivery riders.
Marqstats counts equipment at installed value, including the price of the hardware and the share of kiosks, power cabinets and installation that buyers pay to the equipment supplier or its installer. Utility grid upgrades paid directly by cities or power companies, software subscriptions and operating services are left out, so the market captures the hardware decision rather than the full cost of running a system.
Rules shape where equipment is installed. China combined fire safety inspections with targets for outdoor charging facilities in residential areas. In the European Union, the recast Energy Performance of Buildings Directive adopted in 2024 requires bicycle parking spaces in new and renovated buildings, which supports secure parking demand. In the United States, cities are pairing product certification rules with public charging pilots, and bikeshare contracts increasingly specify powered docks for new stations.
Battery swapping and dock charging are alternative ways to keep shared e-bikes running. Under swapping, staff drive vans around the city to replace depleted batteries, while dock charging lets bikes recharge whenever they are parked. Lyft studies of its systems found that electrifying a relatively small share of stations, about one in five, could greatly reduce the need for battery swapping, because e-bike trips concentrate at a limited number of busy stations. This is why operators target the busiest stations first.
Global Micromobility Docking and Charging Rack Market Size and Forecast
The global micromobility docking and charging rack market grows from USD 489.00 million in 2025 to USD 625.00 million in 2030, a CAGR of 5.03%. Marqstats expects the market to fall to USD 463.00 million in 2026 as Chinese community charging spending drops after the safety campaign, then recover to USD 497.00 million in 2027, USD 539.00 million in 2028 and USD 580.00 million in 2029.
Bikeshare docking stations grow from USD 198.00 million to USD 268.00 million, a 6.24% CAGR. Marqstats estimates about 110,000 docks were installed or replaced in 2025, rising to about 124,600 in 2030, a 2.52% annual rate, while the average value per dock rises from about USD 1,800 to USD 2,150 as powered docks replace simpler mechanical ones. Powered docks rise from about 20% of bikeshare dock value in 2025 to about 45% in 2030.
Community charging stations grow from USD 225.00 million to USD 230.00 million, a 0.44% CAGR. Chinese spending falls from USD 210.00 million to USD 180.00 million as annual installations drop from about 13.1 million ports to about 12.0 million and the average price falls from about USD 16 to USD 15 per port, while spending in the rest of Asia, Europe and the Americas rises from USD 15.00 million to USD 50.00 million.
Secure parking and charging racks grow from USD 66.00 million to USD 127.00 million, a 13.99% CAGR. Installed bays rise from about 60,000 in 2025 to about 121,000 in 2030, a 15.06% annual rate, while the average value per bay eases from about USD 1,100 to USD 1,050 as volumes grow and more units are installed without charging.
Marqstats tracks four indicators to monitor the forecast: the number of grid-connected and solar-powered bikeshare stations in large systems, Chinese government figures on electric bicycle charging ports, building and fire code changes that require e-bike parking and charging in new buildings, and procurement notices for new and renewed bikeshare contracts.
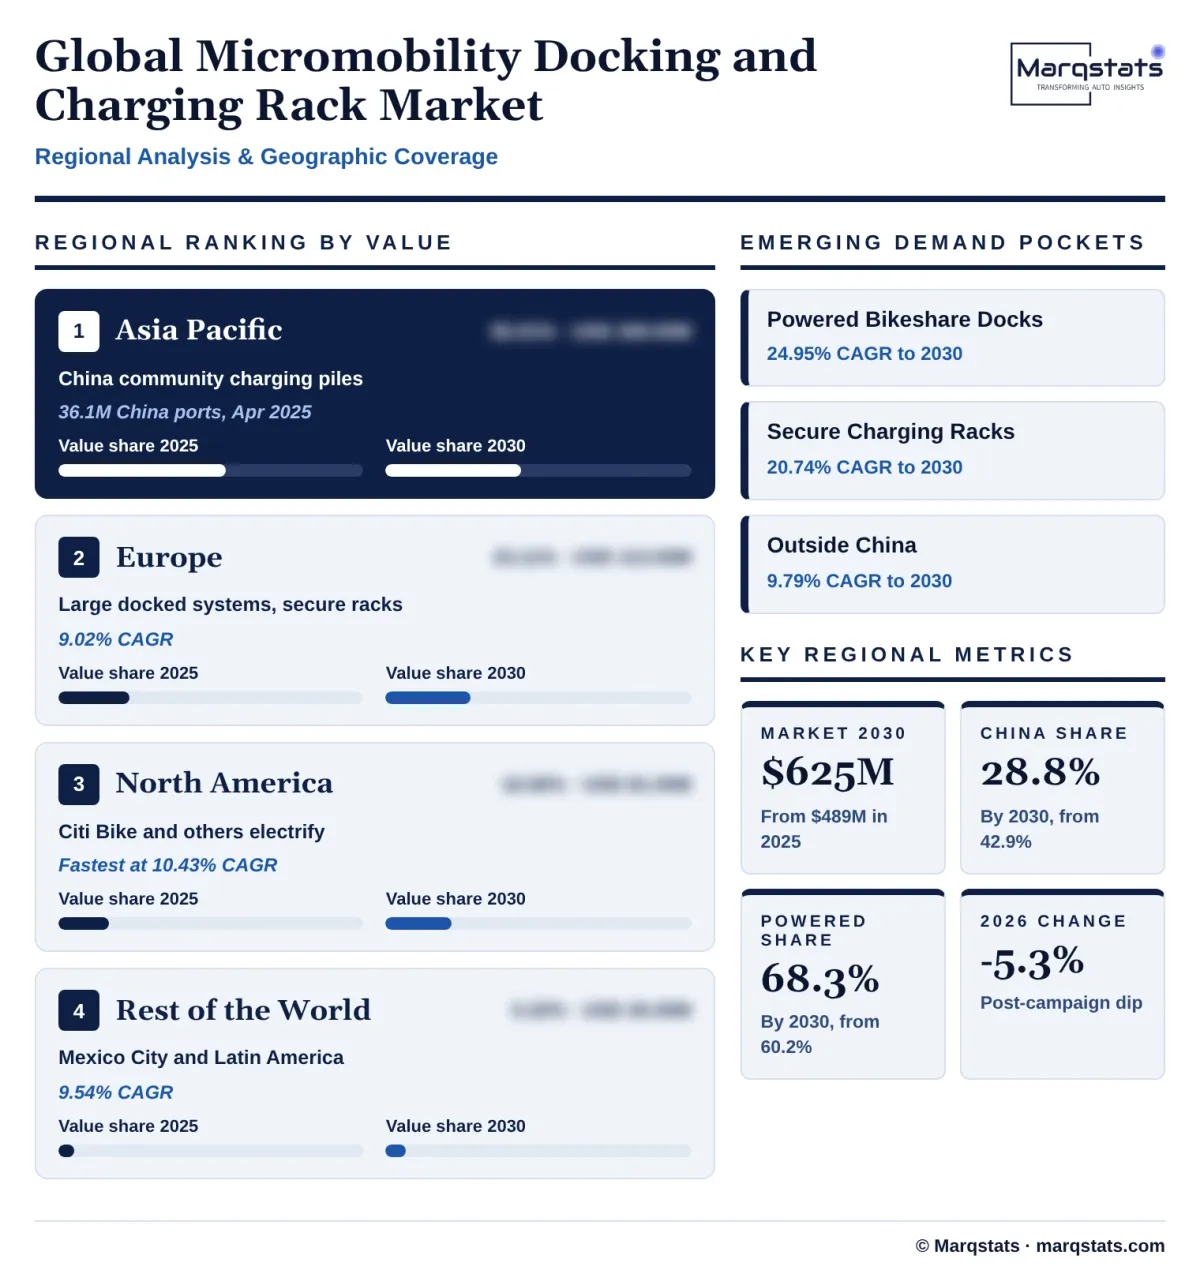
The mix of the market changes over the forecast. Bikeshare docking rises from 40.49% to 42.88% of value and secure parking and charging racks from 13.50% to 20.32%, while community charging falls from 46.01% to 36.80%. Asia Pacific remains the largest region but its share falls from 55.01% to 44.32%, while Europe rises to 27.84% and North America to 21.28%. China alone falls from 42.94% to 28.80% of global value, a 3.04% annual decline, while the rest of the world grows at 9.79% a year.
Installed values move in different directions by segment. Powered bikeshare docks are more expensive than mechanical ones, so the average value per bikeshare dock rises by about 19% between 2025 and 2030. Community charging piles become cheaper as suppliers compete for fewer orders, and secure parking bays become slightly cheaper as volumes grow. Across the market, powered equipment rises from USD 294.30 million to USD 426.80 million while non-powered equipment stays nearly flat.
Market Dynamics
Key Drivers
Five forces are lifting spending on docks, charging racks and secure parking for bikes, e-bikes and e-scooters.
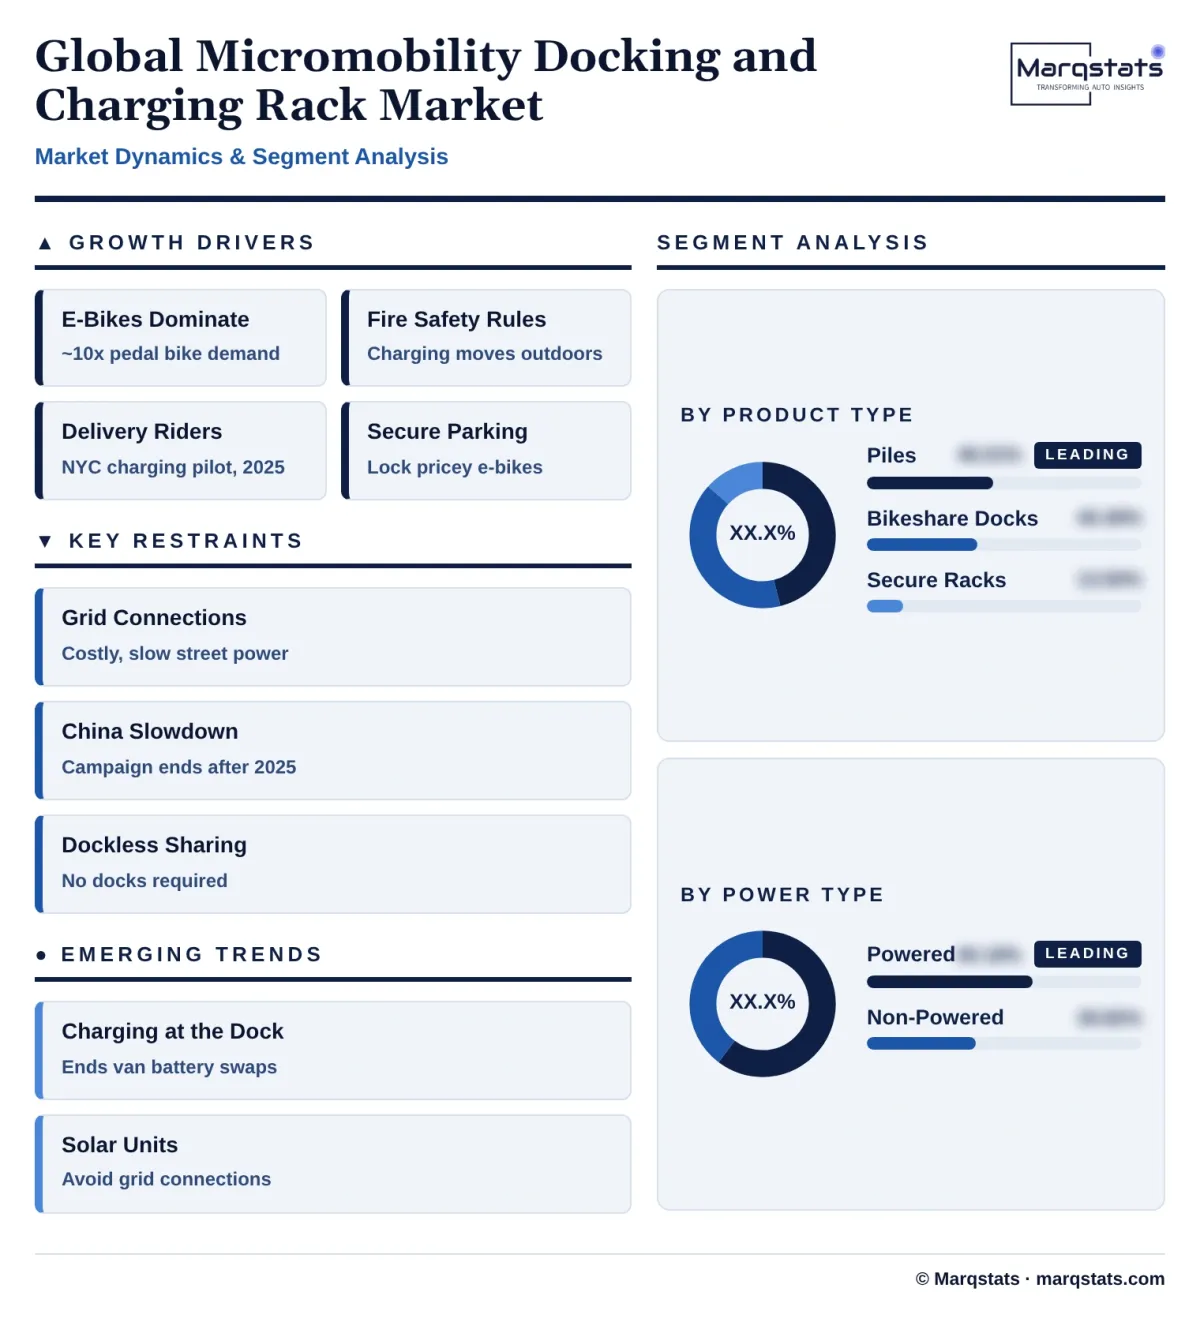
- E-bikes dominate bikeshare. E-bikes are about ten times more popular than pedal bikes in Lyft shared fleets, and Citi Bike recorded more than 29 million e-bike trips in 2024, so operators need docks that charge bikes in place instead of swapping batteries by van.
- Fire safety rules. China, New York City and other governments are acting on lithium-ion battery fires by moving charging into outdoor piles, safer hubs and certified equipment, creating demand for community charging stations and secure charging lockers.
- Delivery rider charging. Food and parcel delivery riders use e-bikes for long shifts, and cities are testing public charging and battery swapping hubs for them, such as the six-month NYC DOT and Newlab pilot announced in May 2025.
- New and expanded bikeshare systems. Cities continue to launch and enlarge docked systems, including Bizi in Zaragoza in January 2025 and the Citi Bike expansion of more than 250 stations announced at the end of 2024.
- Secure parking for valuable bikes. E-bikes cost far more than ordinary bikes, so riders, employers and campuses want locked, monitored parking, which drives demand for smart racks and lockers from Bikeep, PARAT, Swiftmile and Locky Dock.
Key Restraints
Four constraints slow how fast operators, cities and property owners install docking and charging hardware.
- Grid connection cost and delay. Powering a street station needs a utility connection, permits and trenching, which can cost more than the docks themselves and take months to arrange.
- Post-campaign slowdown in China. Once residential compounds have installed enough charging ports, new orders fall back to replacements and new buildings, cutting the largest single source of demand.
- Competition from dockless sharing. Dockless bikes and e-scooters need no docks and dominate shared micromobility in many Chinese and European cities, limiting the number of docked systems.
- Tight city budgets. Bikeshare systems often depend on public contracts, sponsorship or advertising, so equipment orders can be delayed when contracts are renewed or budgets are cut.
Key Trends
Four shifts are changing how micromobility docking and charging equipment is designed, powered and bought.
- Charging at the dock. Operators are replacing manual battery swapping with powered docks, such as the Lyft Smart E-Station and the grid-connected Citi Bike stations in New York.
- Solar and off-grid units. Solar-powered stations and charging totems, such as the Lyft Solar Station, Bikeep stations with solar towers in Canada and Solarcycle totems in the UK and Spain, avoid grid connection costs.
- Advertising-funded parking. Councils in New Zealand and elsewhere are funding secure bike parking through advertising panels on the units, reducing upfront public spending.
- Open, multi-brand charging. Racks and lockers are moving to universal sockets and standard plugs so riders can charge different e-bike and e-scooter brands at the same unit.
Strategic Implications
- For bikeshare operators, powered docks are an operating cost decision. Every e-bike charged in the dock removes a battery swap visit, so stations with the highest e-bike use should be electrified first.
- For cities and transit agencies, secure parking supports ridership. Locked and charged parking at stations, campuses and town centres makes e-bike commuting practical for riders who would not leave an expensive bike on a public rack.
- For property managers, charging infrastructure reduces fire risk. Outdoor charging piles and fire-rated charging lockers keep batteries out of corridors and homes and help buildings meet local safety rules.
- For equipment suppliers, growth is shifting away from China. Suppliers serving Europe and North America face slower volume but higher value per unit, and can win orders by offering solar options, advertising funding and open charging standards.
- For utilities, small loads add up. Bikeshare and parking stations draw little power individually, but simple, quick connection processes for small street loads would speed electrification of thousands of stations.
- For investors, the market is moving from a Chinese volume business to a Western value business. Equipment that charges, locks and reports data earns higher prices and longer service contracts than basic charging piles, so supplier returns depend on winning electrification and secure parking projects in Europe and North America.
Market Segmentation
Community and residential charging piles for privately owned e-bikes account for 46.01% of 2025 value, USD 225.00 million and about 13.1 million ports, and grow at 0.44% a year to USD 230.00 million and 36.80% of 2030 value. China accounts for USD 210.00 million of 2025 value after the national electric bicycle safety campaign added more than 24 million ports, and its spending falls to USD 180.00 million by 2030. The rest of the world grows from USD 15.00 million to USD 50.00 million as India, Southeast Asia and European housing providers add shared charging points.
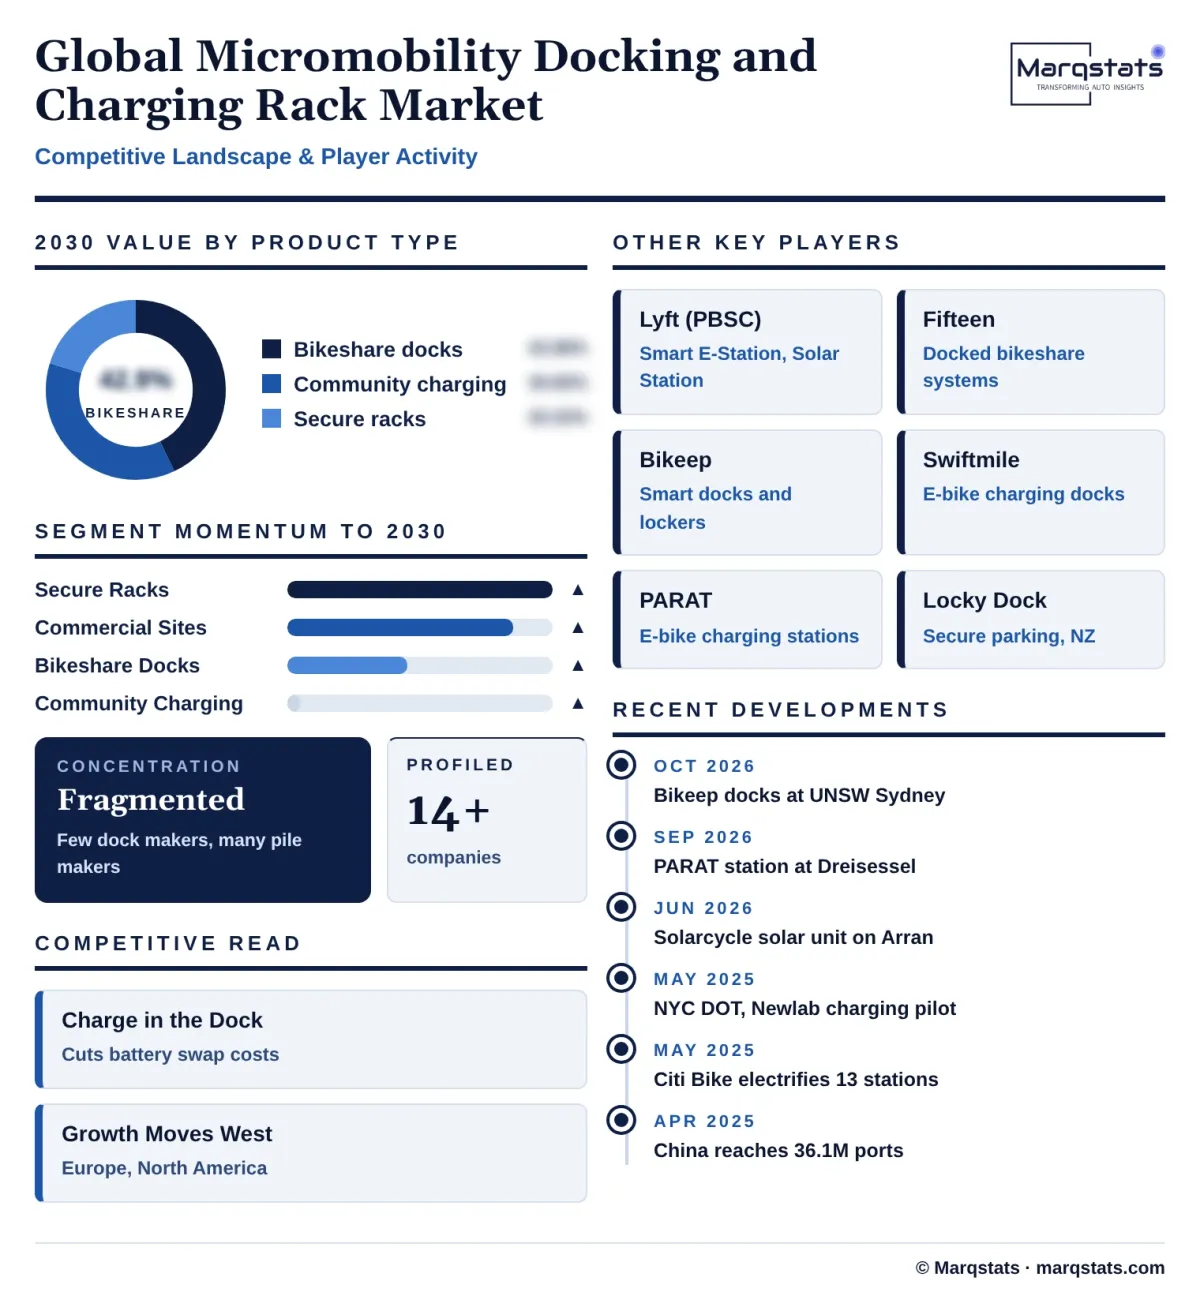
Docks, kiosks and power cabinets for docked bikeshare systems account for 40.49% of 2025 value, USD 198.00 million and about 110,000 docks, and grow at 6.24% a year to USD 268.00 million and 42.88% of the market by 2030, becoming the largest segment. Lyft, which supplies PBSC Urban Solutions equipment, and Fifteen lead docked equipment supply in North America and Europe, while large Asian systems buy mainly from local suppliers.
Smart parking racks, docks and lockers for privately owned bikes, e-bikes and e-scooters account for 13.50% of 2025 value, USD 66.00 million and about 60,000 bays, and grow fastest, at 13.99% a year, to USD 127.00 million and 20.32% of the market by 2030. Bikeep, PARAT, Swiftmile, Locky Dock and Bike-Energy serve campuses, transit hubs, workplaces and city centres.
Docks, racks and piles that charge vehicle batteries account for 60.18% of 2025 value, USD 294.30 million, and grow at 7.72% a year to USD 426.80 million and 68.29% of 2030 value. Powered bikeshare docks grow fastest within this group, at 24.95% a year, from USD 39.60 million to USD 120.60 million, and powered secure racks grow at 20.74% a year from USD 29.70 million to USD 76.20 million.
Docks and racks that lock vehicles without charging them account for 39.82% of 2025 value, USD 194.70 million, and grow at 0.36% a year to USD 198.20 million, falling to 31.71% of the market. Mechanical bikeshare docks decline from USD 158.40 million to USD 147.40 million, a 1.43% annual fall, as operators specify charging on new and replacement stations.
Equipment installed on streets, at transit stations and in public squares accounts for 54.42% of 2025 value, USD 266.10 million, and grows at 6.14% a year to USD 358.50 million and 57.36% of 2030 value, including all bikeshare docks, public secure parking and public community charging piles.
Charging piles and secure parking installed in residential compounds and apartment buildings account for 34.91% of 2025 value, USD 170.70 million, and grow at 0.49% a year to USD 174.90 million, falling to 27.98% of the market as Chinese installations slow.
Equipment at workplaces, campuses, hospitals, hotels, tourist sites and delivery rider hubs accounts for 10.67% of 2025 value, USD 52.20 million, and grows at 11.90% a year to USD 91.60 million and 14.66% of 2030 value, led by secure charging racks and lockers.
By Geography
Asia Pacific
Asia Pacific is the largest region, with 55.01% of 2025 value, USD 269.00 million, rising to USD 277.00 million by 2030, a 0.59% CAGR, while its share falls to 44.32%. China accounts for USD 210.00 million of community charging spending in 2025, with about 36.1 million electric bicycle charging ports in place by early April 2025. Large docked bikeshare systems in Chinese cities, Taiwan and other Asian markets account for about USD 45.00 million, and secure parking in Australia and New Zealand, where Bikeep and Locky Dock are expanding, for about USD 6.00 million. Spending outside China rises from USD 59.00 million to USD 97.00 million by 2030 as India and Southeast Asia add charging points and docked systems.
Europe
Europe accounts for 23.11% of 2025 value, USD 113.00 million, and grows at 9.02% a year to USD 174.00 million and 27.84% of the market by 2030. Large docked systems in Paris, Barcelona, Madrid, London and other cities account for about USD 75.00 million, and secure parking and charging racks for about USD 33.00 million, the largest secure parking market in the world. Bicing in Barcelona is the fourth-largest bikeshare system worldwide, and Bicimad in Madrid recorded 13.7 million rides in 2025, up 39%. PARAT, Bikeep, Bike-Energy and Solarcycle are adding charging stations at tourist sites, municipal locations and campuses, and Rethymno in Greece installed 15 Bikeep stations at three locations in an EU-funded project reported in January 2026.
North America
North America accounts for 16.56% of 2025 value, USD 81.00 million, and grows fastest among regions, at 10.43% a year, to USD 133.00 million and 21.28% of the market by 2030. Bikeshare docks account for about USD 60.00 million, rising to USD 88.00 million, as Citi Bike, Divvy, Capital Bikeshare, Bay Wheels and Bluebikes expand and electrify stations. Citi Bike carried about 47 million rides in 2025 and had 15 grid-connected stations after the May 2025 programme, leaving most of its network still to be electrified. Secure parking grows from USD 20.00 million to USD 40.00 million, led by Swiftmile and Bikeep installations such as San Jose and Kingston in 2026.
Rest of the World
Latin America, the Middle East and Africa account for 5.32% of 2025 value, USD 26.00 million, and grow at 9.54% a year to USD 41.00 million and 6.56% of the market by 2030. Mexico City operates one of the three largest bikeshare systems in the world, Guadalajara and Buenos Aires operate large docked systems, and Gulf cities are adding docked bikeshare and e-scooter parking as part of transport plans.
How Competition Is Evolving
The micromobility docking and charging rack market is fragmented. Bikeshare docking is concentrated among a few suppliers, led by Lyft, which owns PBSC Urban Solutions, and Fifteen, alongside nextbike and local suppliers in Asia, but community charging in China is served by many small pile makers and charging network operators, and secure parking is split among specialist suppliers such as Bikeep, PARAT, Swiftmile, Locky Dock and Bike-Energy.
Bikeshare docking suppliers compete on the full system. Lyft sells its Smart E-Station, which locks bikes, charges e-bikes, shares real-time data with the operator and supports rental by smartphone or smartcard, and a modular Solar Station with a connected kiosk. It also operates systems such as Citi Bike, Divvy, Bay Wheels, Capital Bikeshare and Bizi in Zaragoza, which gives it data on which stations need charging most.
Secure parking suppliers compete on charging, access and funding. Bikeep offers smart docks and lockers and has expanded to Greece, Canada, the United States, Denmark, Australia and New Zealand, often funded by advertising. Swiftmile builds charging docks for e-bikes and e-scooters and took part in the NYC DOT and Newlab charging pilot, while PARAT supplies e-bike charging stations for tourist and municipal sites in Germany.
Chinese community charging is a price-driven segment. Suppliers and charging network operators sell or install ten- to twenty-port piles with payment by mobile app, and the end of the national safety campaign will force consolidation as new installation volumes fall.
Funding models are becoming a competitive tool. Suppliers that offer advertising-funded parking, leasing, solar units that avoid grid connection costs and data services for operators can win contracts from cities and landlords that lack capital budgets. Solarcycle prices its solar charging systems from GBP 7,995 including branding and support, and several New Zealand councils have funded Bikeep parking through advertising in 2026.
Companies Covered
Companies covered in the report include:
Recent Market Activity
Table of Contents
Coverage & Segmentation
The study covers the global micromobility docking and charging rack market, with 2025 as the base year, 2021 – 2025 as the historical period and 2026 – 2030 as the forecast period. Values are in US dollars at installed equipment value, and volumes are docks, charging ports and parking bays installed or replaced each year. The market is segmented by product type, power type, installation setting and region. Where Chinese prices are converted, Marqstats uses a 2025 average rate of CNY 7.18 per US dollar.
Battery-swap cabinets, chargers for cars, vans, buses and other four-wheel electric vehicles, including off-grid solar chargers for those vehicles, plain unpowered bike stands and hoops, dockless bikes and e-scooters, the vehicles themselves, software subscriptions, operating services and rental or charging fees are excluded. Solar-powered micromobility stations and charging totems are included. Segment and regional splits are Marqstats estimates built on operator and supplier announcements, government charging port figures, city programme releases and equipment price benchmarks.