Market Snapshot
The global electric van upfitting market size is estimated at USD 1,037.10 million in 2025 and is projected to reach USD 2,979.19 million by 2030, growing at a CAGR of 23.50% over 2026 – 2030. About 314,160 of the 689,204 electric vans sold in 2025 were upfitted, at USD 3,301 per upfit.
Marqstats defines the market as the value of second-stage equipment and installation fitted to new battery-electric and plug-in hybrid vans and van-based chassis cabs up to 4.25 tonnes in Europe and Class 3 in North America. It covers shelving and racking, partitions, lining and flooring, refrigerated and insulated conversions, box, Luton, tipper and dropside bodies on electric chassis cabs, and auxiliary electrical systems including electric power take-off. The base vehicle, walk-in step-van bodies on strip chassis, camper and leisure conversions, telematics subscriptions and the repowering of diesel vans to electric are excluded.
Europe accounts for 61.25% of 2025 value and China for 17.36%, although China sells 59.76% of the world's electric vans. Shelving and racking is the largest upfit type at 32.00% of value, and parcel and last-mile delivery the largest application at 38.00%. The study segments the market by upfit type, application, channel and region.
Key Takeaways
Market Overview & Analysis
Report Summary
Marqstats sizes the electric van upfitting market as the value of everything a second-stage upfitter, a dealer installer or an OEM factory conversion programme adds to a new electric van after it leaves the base assembly line. In 2025 the world sold an estimated 689,204 battery-electric and plug-in hybrid vans, of which 314,160 received a professional upfit worth USD 1,037.10 million in total, an average of USD 3,301 per upfit.
The electric van base is built bottom-up because no public body counts electric vans or their upfits worldwide. In the European Union, the European Automobile Manufacturers' Association (ACEA) reports that electrically chargeable vans took 11.2% of 2025 registrations, about 161,733 vans. The Society of Motor Manufacturers and Traders (SMMT) recorded 30,169 battery-electric vans in the United Kingdom, up 36.2%, and Marqstats adds about 20,000 vans in Norway, Switzerland and Iceland, giving Europe 211,902 electric vans. In China, sales of new energy light vans reached 301,902 in 2025, up 23.37%, and Marqstats estimates about 140,000 new energy micro-vans, anchored on the 148,166 new energy commercial vehicles sold by SAIC-GM-Wuling, less about 30,000 vans exported, giving China 411,902. North America adds 25,400, Asia-Pacific outside China 28,000 and the rest of the world 12,000.
Upfitting an electric van is a different job from upfitting a diesel van. The traction battery sits in the floor between the frame rails, so OEM body builder guidelines forbid drilling or screwing into the floor, and upfitters fix racking to factory anchor points, bonded composite floors or pre-drilled rail systems instead. High-voltage cables run through the body, so electrical work needs trained technicians, isolation checks and OEM-approved interfaces. There is no engine belt, so refrigeration compressors, hydraulic tippers and inverters run from the high-voltage battery through an electric power take-off module or from a separate auxiliary battery.
Weight shapes every specification. A steel racking package can weigh 180 to 280 kg on a large van, and every kilogram reduces both payload and range. Directive 2006/126/EC on driving licences, as amended by Directive (EU) 2018/645, lets member states allow Category B licence holders to drive alternatively fuelled goods vans up to 4,250 kg when the extra mass comes from the propulsion system, but vans above 3,500 kg still fall into category N2 under Regulation (EU) 2018/858, with consequences for tachographs, speed limiters and roadworthiness testing. Most fleets therefore buy lighter aluminium and composite systems to stay below 3,500 kg.
Value is concentrated where fleets buy complex builds. Europe accounts for USD 635.18 million, 61.25% of 2025 value, from 116,546 upfits averaging USD 5,450. China accounts for USD 180.00 million from 156,523 upfits averaging USD 1,150, North America for USD 147.92 million from 20,491 upfits averaging USD 7,219, Asia-Pacific outside China for USD 47.60 million and the rest of the world for USD 26.40 million.
Regulation decides what an upfitter may fit. In the European Union, a converter that changes a type-approved van must complete multi-stage type approval under Regulation (EU) 2018/858 and show that the build does not compromise crash safety, braking or electromagnetic compatibility. In the United Kingdom, the Zero Emission Vehicle mandate sets annual zero-emission targets for van makers, and from 1 June 2026 electric vans between 3,500 kg and 4,250 kg take a Class 7 MOT. In the United States, the end of the commercial clean vehicle credit for vehicles acquired after 30 September 2025 removed up to USD 7,500 of support per light commercial vehicle. In China, refrigerated and other special-purpose vans must appear in MIIT product announcements before they can be registered.
Global Electric Van Upfitting Market Size and Forecast
The global electric van upfitting market grows from USD 1,037.10 million in 2025 to USD 2,979.19 million in 2030, a CAGR of 23.50% and an absolute gain of USD 1,942.09 million. Marqstats expects the market to reach about USD 1,280.78 million in 2026, USD 1,581.73 million in 2027, USD 1,953.38 million in 2028 and USD 2,412.36 million in 2029.
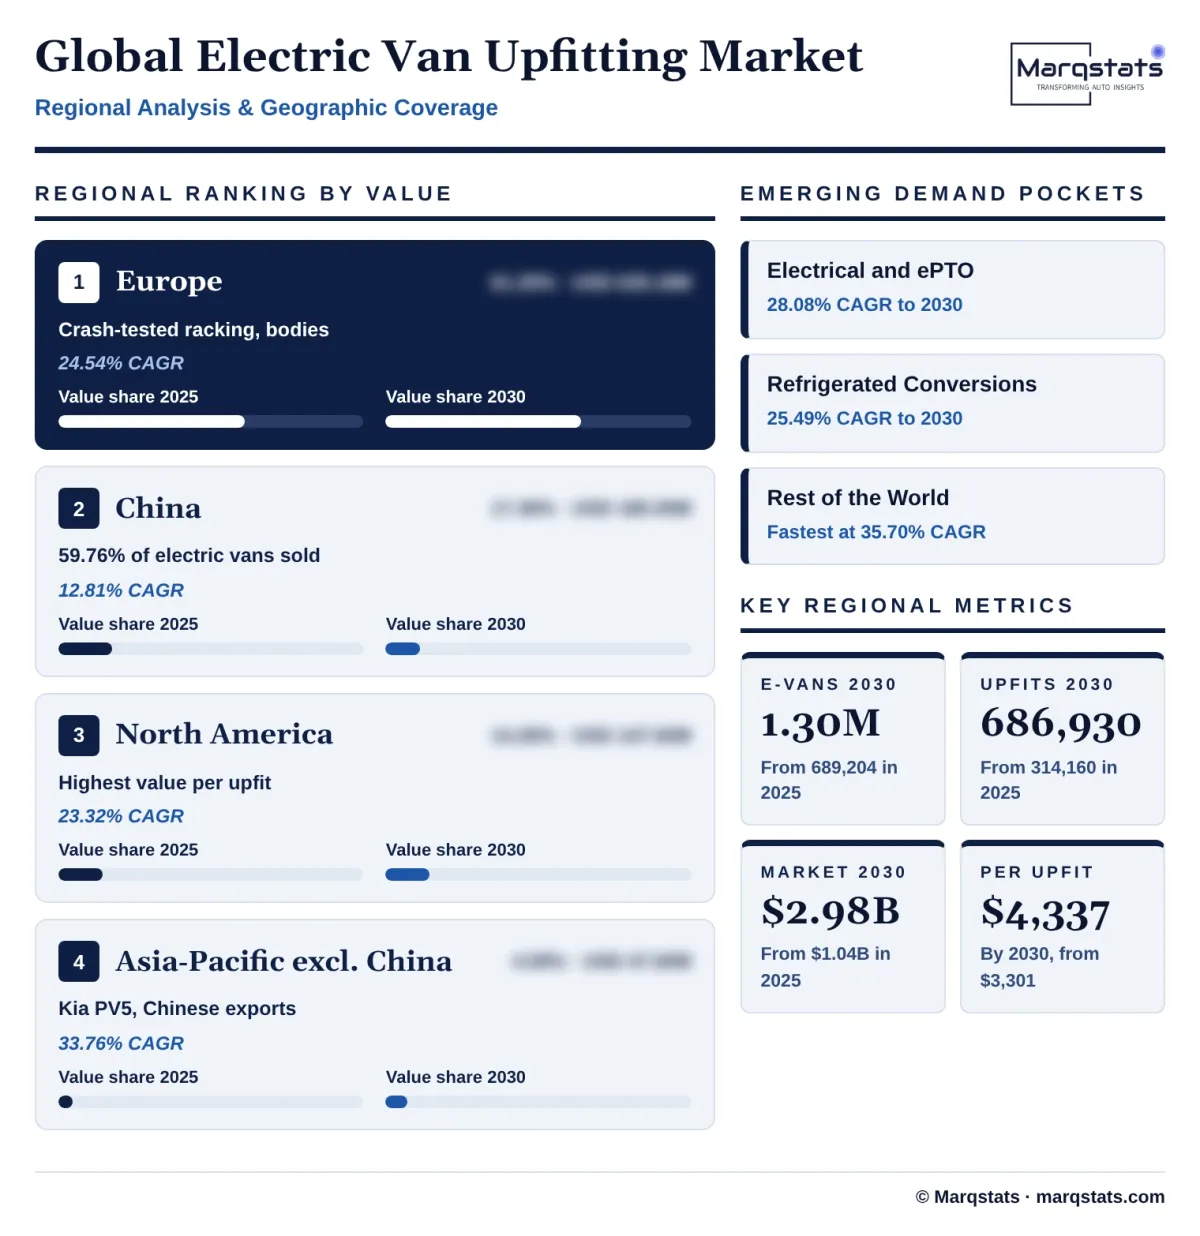
Three multipliers drive the forecast. Electric van sales rise from 689,204 in 2025 to 1,302,000 in 2030, a 13.57% CAGR. The share of electric vans receiving a professional upfit rises from 45.58% to 52.76%, because electric vans move beyond parcel fleets, which buy simple fit-outs, into trades, utilities and cold-chain fleets, which almost always upfit. The average value per upfit rises from USD 3,301 to USD 4,337 as auxiliary power, insulated bodies and lightweight materials take a larger share of each build. Together they lift upfits from 314,160 to 686,930, a 16.94% CAGR, and value at 23.50% a year.
Europe drives most of the absolute growth. Its electric van sales rise from 211,902 to 520,000, a 19.67% CAGR, as EU CO2 standards for new vans tighten in 2030 and the UK Zero Emission Vehicle mandate raises the required zero-emission share of new van sales each year. Its upfit value grows from USD 635.18 million to USD 1,903.20 million, a 24.54% CAGR, adding USD 1,268.02 million, about two thirds of global growth.
China grows slowest in value. New energy light vans already passed 70% of monthly light van sales for four months running at the end of 2025, so China's electric van sales grow at only 7.08% a year to 580,000. Its upfit value rises from USD 180.00 million to USD 328.86 million, a 12.81% CAGR, as more electric vans are converted into refrigerated and special-purpose vehicles.
North America recovers from a weak 2025. Electric van sales rise from 25,400 to 62,000, a 19.54% CAGR, and upfit value from USD 147.92 million to USD 421.85 million. The forecast assumes no new federal purchase credit and rests on parcel carriers, utilities and municipal fleets that set their own decarbonisation targets.
The smaller regions grow fastest. Asia-Pacific outside China grows at 33.76% a year to USD 203.78 million as Kia, Hyundai and Chinese exporters supply electric vans to Korea, Japan, Australia and Southeast Asia, and the rest of the world grows at 35.70% to USD 121.50 million from a base of 12,000 electric vans in Latin America, the Middle East, Africa and Türkiye.
Marqstats tracks four indicators against the forecast: quarterly electric van registrations from ACEA, SMMT and the China Association of Automobile Manufacturers (CAAM); the share of electric vans delivered through OEM factory upfit programmes; the price of aluminium and composite racking relative to steel; and the take-up of electric transport refrigeration units in urban delivery fleets.
The upfit mix shifts toward power and cold. Electrical, auxiliary power and ePTO equipment rises from 15.00% to 18.00% of value and refrigerated and insulated conversions from 18.00% to 19.50%, while shelving and racking falls from 32.00% to 30.00% and partitions, lining and flooring from 18.00% to 16.00%. By application, trades and field service rises from 30.00% to 32.50% and cold chain from 20.00% to 21.50%, while parcel and last-mile delivery falls from 38.00% to 33.50%. OEM factory and certified programmes rise from 30.00% to 38.00% of value.
Market Dynamics
Key Drivers
Five forces are pushing upfit spending on electric vans up faster than electric van sales.
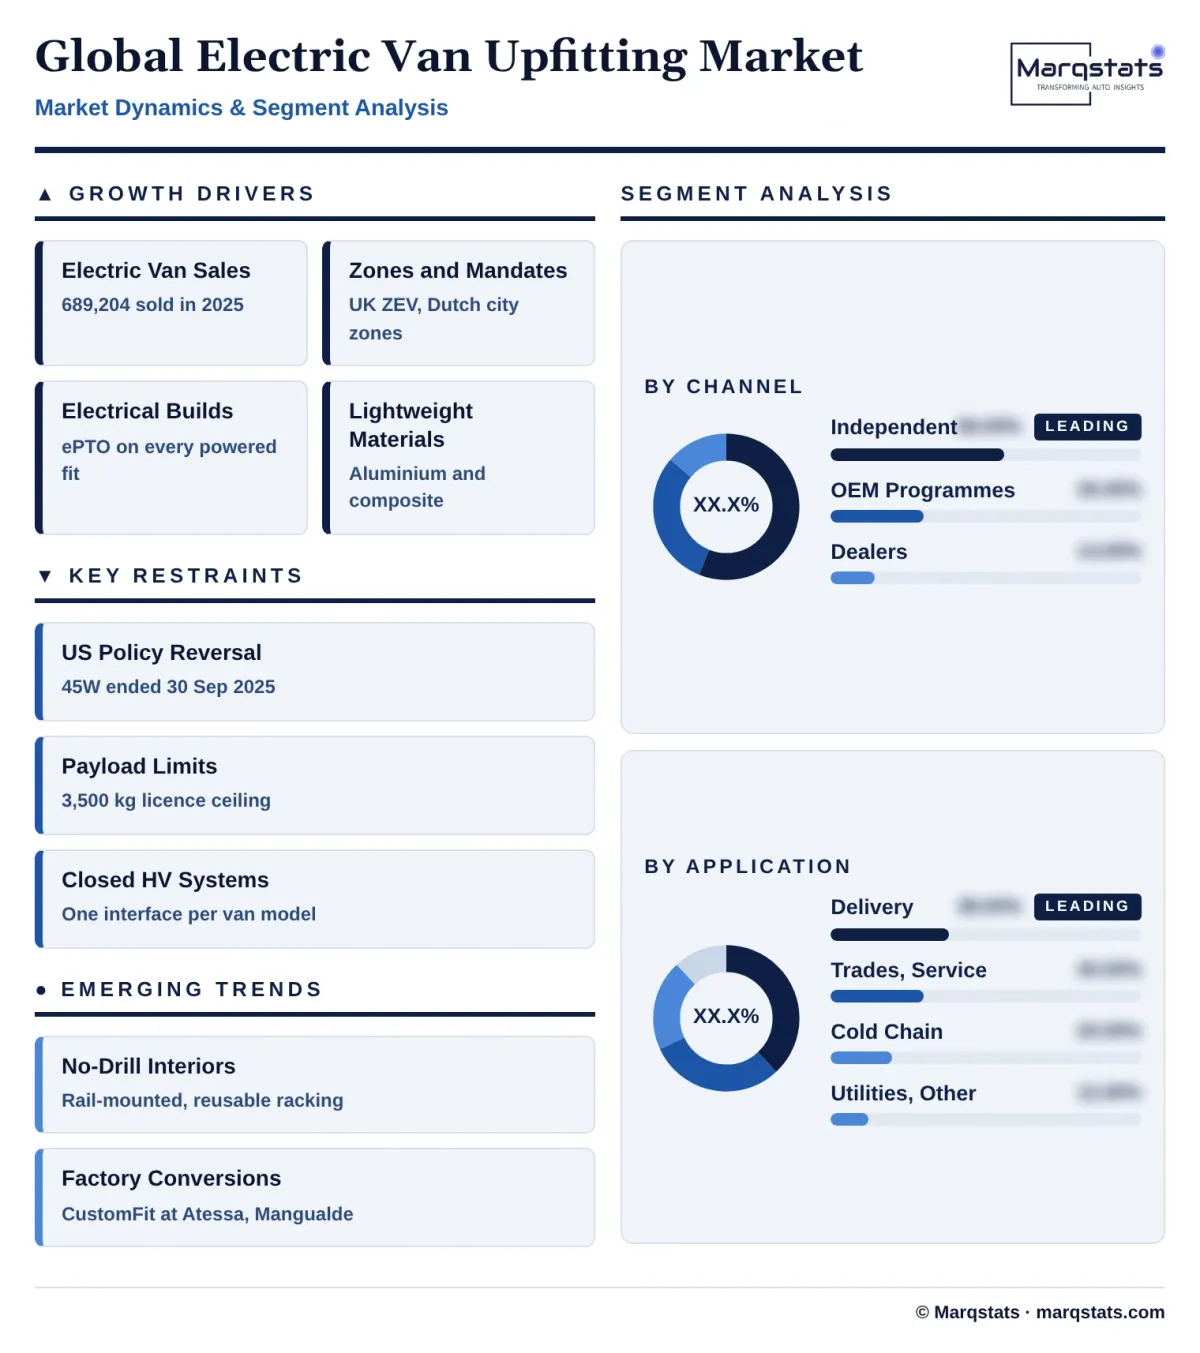
- Electric van sales keep rising. Global electric van sales rise from 689,204 in 2025 to 1,302,000 in 2030. In the European Union electrically chargeable vans reached 11.2% of 2025 registrations, up from 6.1% in 2024, and in the Netherlands the European Alternative Fuels Observatory reports that battery-electric and plug-in hybrid vans took about 83.9% of new van registrations in 2025.
- Zero-emission zones and mandates. The UK Zero Emission Vehicle mandate sets a rising minimum share of zero-emission van sales for each manufacturer, Dutch cities are closing their centres to new diesel vans, and EU CO2 standards for new vans tighten in 2030, pushing fleets to buy electric vans that then need fit-outs.
- Electric vans need more electrical work. Without an engine belt, every compressor, pump, tipper and inverter on an electric van has to run from the traction battery or a separate auxiliary battery, which adds isolation hardware, DC-AC inverters, wiring and software integration to each build and raises the average value per upfit.
- Lightweight materials cost more. Aluminium and composite racking, partitions and floors protect payload and range on heavy electric vans, and they sell at a premium over steel, so the shift to lighter systems raises upfit value even when the number of shelves stays the same.
- Purchase support for fleets. The UK government extended the Plug-in Van Grant in August 2025 to at least 2027, at up to GBP 2,500 for small vans and GBP 5,000 for large vans, and Amazon added about 10,000 Rivian electric delivery vans in the year to February 2026, giving upfitters a steady pipeline of electric vehicles.
- Higher-value applications electrify. Trades, utilities and cold-chain fleets, which almost always upfit their vans, are adopting electric vans after parcel carriers, lifting the share of electric vans upfitted from 45.58% in 2025 to 52.76% in 2030.
Key Restraints
Four constraints slow how fast electric van upfitting can grow and where its value lands.
- US policy reversal. The One Big Beautiful Bill Act ended the federal commercial clean vehicle credit for vehicles acquired after 30 September 2025, Ford's US E-Transit sales fell 58.9% to 5,186 in 2025, and General Motors stopped building BrightDrop vans in October 2025, shrinking the North American electric van pool.
- Payload and licence limits. Battery mass leaves less payload for equipment, and vans above 3,500 kg move into category N2 with tachograph, speed limiter and testing consequences in many countries, which caps how much equipment a fleet can fit to an electric van.
- Closed high-voltage architectures. Each OEM uses its own high-voltage layout, connector and software gateway, so upfitters must engineer and certify separate wiring harnesses and power take-off interfaces for every electric van model, which raises engineering cost for small and mid-sized upfitters.
- OEMs take simple work in-house. Factory conversion programmes such as Stellantis Pro One CustomFit, Ford Pro Converter and Mercedes-Benz VanSolution install partitions, linings and standard racking at the plant, reducing the volume of simple, high-turnover work left for independent upfitters.
Key Trends
Four shifts are changing how electric vans are fitted out, by whom and with what materials.
- No-drill and rail-mounted interiors. Systems such as the Sortimo Rail System, shown on the Peugeot E-Expert at Solutrans in November 2025, and pre-drilled floors let shelving clip into factory points without touching the battery, and they can be moved to the next van when a lease ends.
- Factory-gate conversions for small electric vans. Stellantis opened a CustomFit centre at Mangualde in October 2025 to fit partitions, storage and flooring to the Citroën ë-Berlingo, Fiat e-Doblò, Opel Combo Electric and Peugeot E-Partner before delivery.
- Purpose-built electric vans. Dedicated electric platforms such as the Kia PV5, the Flexis vans that Renault Group is taking full control of, and the Rivian electric delivery van are designed with flat floors and upfit interfaces, and racking makers such as Modul-System launched PV5-specific systems in February 2026.
- Battery-powered refrigeration. All-electric transport refrigeration units from Thermo King and Carrier Transicold run from the van's high-voltage system or a dedicated lithium-ion auxiliary battery, replacing engine-driven compressors and making refrigerated conversions the highest-value upfit on electric vans.
Strategic Implications
- For independent upfitters, the margin is moving to complex builds. Simple partitions and linings are migrating into OEM factory programmes, so upfitters should invest in high-voltage technician training, multi-stage type-approval capability and certified status with Ford Pro, Stellantis Pro One and Mercedes-Benz Vans, and focus on refrigerated, utility and mobile workshop conversions that factories cannot standardise.
- For racking and partition makers, weight is the product. Aluminium, composite and rail-mounted systems that save mass and can be moved between vans command a premium on electric vans, and vehicle-specific kits for new platforms such as the Kia PV5 and the Flexis vans win early fleet orders.
- For electrical and refrigeration suppliers, the interface is the opportunity. Inverters, isolated power take-off modules, auxiliary batteries and electric refrigeration units that are approved by each van OEM and talk to the vehicle's battery management system will capture the fastest-growing part of the market.
- For suppliers entering China, the volume is large but the ticket is small. China sells the most electric vans, but at about USD 437 of upfit spending per van sold, profitable entry depends on refrigerated and special-purpose conversions rather than generic shelving.
- For North American fleets and upfitters, 2025 reset the base. With the federal credit gone and two volume electric vans weakened, growth to 2030 depends on parcel carriers, utilities and municipal fleets with their own targets, so upfitters should plan capacity around named fleet programmes rather than national sales forecasts.
- For fleet buyers, the upfit belongs in the vehicle specification from day one. Ordering racking, partitions and power systems through OEM-certified channels, choosing lightweight and transferable systems and sizing auxiliary batteries for refrigeration and tools protects payload, range and residual value over the life of an electric van.
Market Segmentation
Shelving, drawer units, bins and load-securing systems account for 32.00% of 2025 value, USD 331.87 million, and grow at 21.91% a year to USD 893.76 million, while their share falls to 30.00% as other upfit types grow faster. Sortimo International, Bott, Modul-System, Adrian Steel and Clarience Technologies supply most systems, increasingly in aluminium and composite to save weight.
Bulkheads, side linings, load floors and cargo protection account for 18.00% of 2025 value, USD 186.68 million, and grow at 20.62% a year to USD 476.67 million. This is the work OEM factory programmes are absorbing fastest, so its share falls to 16.00% by 2030.
Insulated panel kits, refrigerated bodies and electric refrigeration units account for 18.00% of 2025 value, USD 186.68 million, and grow at 25.49% a year to USD 580.94 million and 19.50% of 2030 value. Each conversion is worth several times a racking package, and all-electric units from Thermo King and Carrier Transicold remove the need for a diesel-driven compressor.
Box, Luton, tipper and dropside bodies built on electric van chassis cabs such as the Renault Master E-Tech, IVECO eDaily and Fiat e-Ducato account for 17.00% of 2025 value, USD 176.31 million, and grow at 22.76% a year to USD 491.57 million.
Inverters, auxiliary batteries, electric power take-off modules, lighting and charging circuits account for 15.00% of 2025 value, USD 155.56 million, and grow fastest, at 28.08% a year, to USD 536.25 million and 18.00% of 2030 value, because every powered accessory on an electric van has to draw from the battery.
Parcel and grocery delivery fleets account for 38.00% of 2025 value, USD 394.10 million, and grow at 20.42% a year to USD 998.03 million, while their share falls to 33.50%. These fleets bought electric vans first, but they buy standardised, low-cost fit-outs in large batches.
Electricians, plumbers, heating engineers and service technicians account for 30.00% of 2025 value, USD 311.13 million, and grow at 25.49% a year to USD 968.24 million and 32.50% of 2030 value, as trades fleets move from diesel to electric and buy full racking, ladder and power packages.
Food, grocery and pharmaceutical cold-chain fleets account for 20.00% of 2025 value, USD 207.42 million, and grow at 25.30% a year to USD 640.53 million, helped by urban zero-emission zones that exclude diesel refrigeration.
Utilities, telecoms, local authorities and other fleets account for 12.00% of 2025 value, USD 124.45 million, and grow at 24.51% a year to USD 372.39 million and 12.50% of 2030 value, buying tippers, mobile workshops and high-output inverters.
Independent and national upfitters account for 56.00% of 2025 value, USD 580.78 million, and grow at 20.73% a year to USD 1,489.60 million, while their share falls to 50.00% as factories take simpler work.
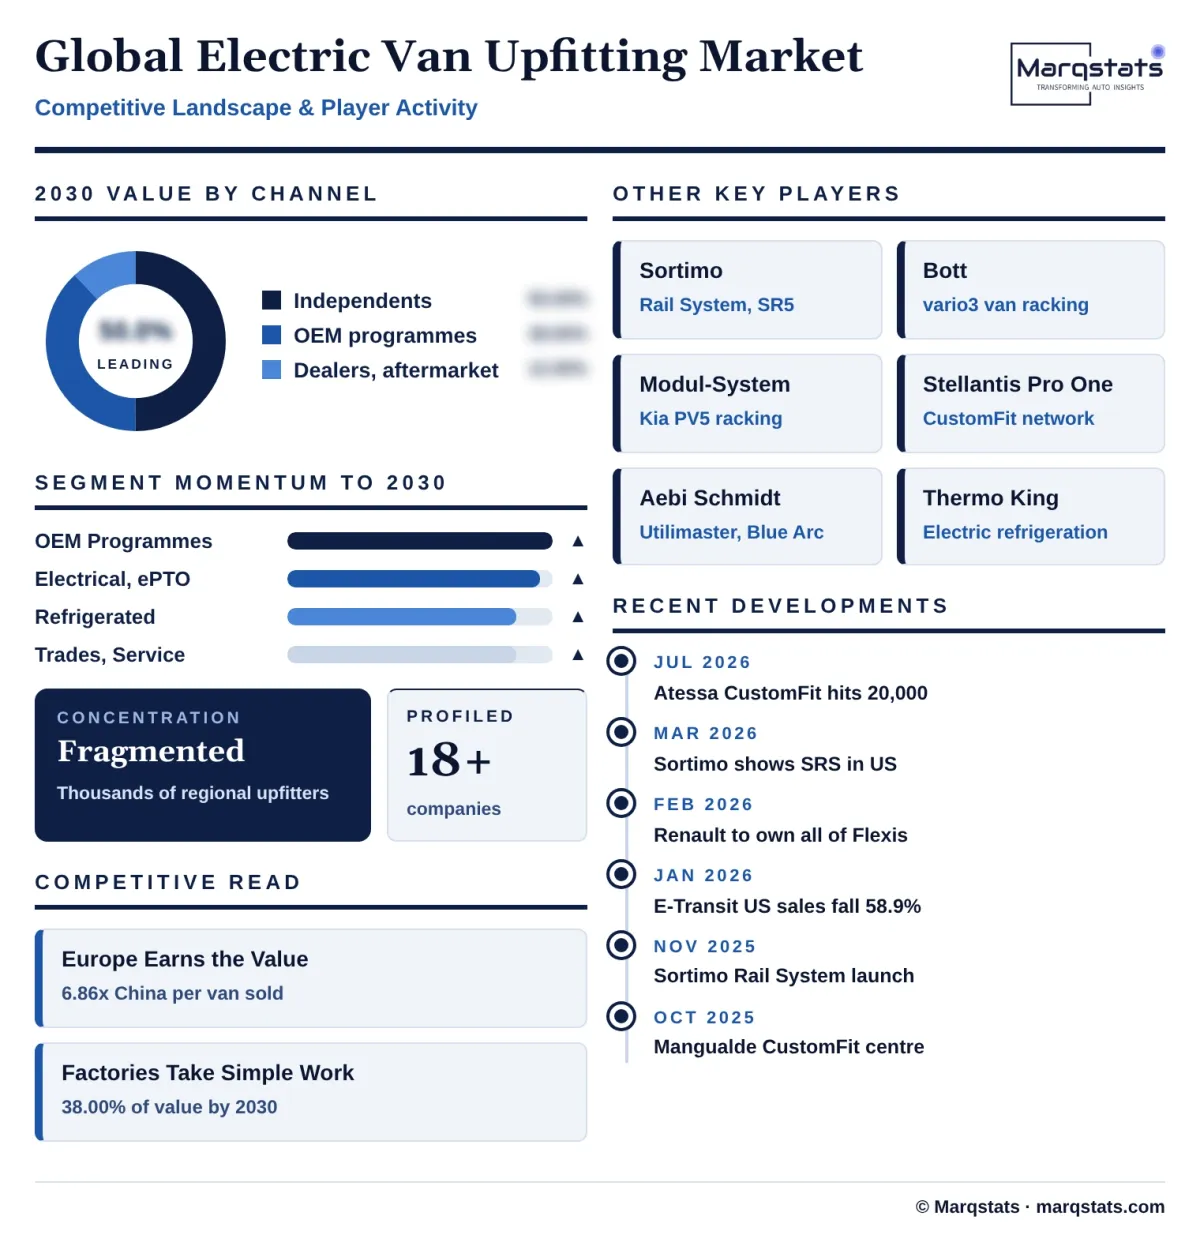
OEM factory conversions and certified partner programmes account for 30.00% of 2025 value, USD 311.13 million, and grow fastest, at 29.48% a year, to USD 1,132.09 million and 38.00% of 2030 value. Stellantis Pro One works with more than 550 certified conversion partners, and its Atessa CustomFit centre passed 20,000 upfitted vehicles in July 2026.
Dealers and aftermarket installers account for 14.00% of 2025 value, USD 145.19 million, and grow at 19.75% a year to USD 357.50 million, mainly fitting accessories, linings and simple racking to vans sold to small businesses.
By Geography
Europe
Europe is the largest region, with 61.25% of 2025 value, USD 635.18 million from 116,546 upfits at an average of USD 5,450 (about EUR 4,823), rising to USD 1,903.20 million and 63.88% of value by 2030, a 24.54% CAGR. Europe sold 211,902 electric vans in 2025: about 161,733 electrically chargeable vans in the European Union, 30,169 battery-electric vans in the United Kingdom and about 20,000 in Norway, Switzerland and Iceland. Most European electric vans are panel vans fitted with crash-tested racking from Sortimo, Bott and Modul-System, while chassis-cab versions carry box, Luton and tipper bodies from converters such as Gruau. The Netherlands is the most electrified van market, with battery-electric and plug-in hybrid vans at about 83.9% of 2025 registrations. Europe also hosts the main OEM factory programmes, including Stellantis Pro One CustomFit at Atessa and Mangualde, Ford Pro Converter and Mercedes-Benz VanSolution.
China
China accounts for 17.36% of 2025 value, USD 180.00 million from 156,523 upfits at an average of USD 1,150 (about CNY 8,257), rising to USD 328.86 million by 2030, a 12.81% CAGR, while its share falls to 11.04%. China sold an estimated 411,902 electric vans in 2025, 59.76% of the world total, led by new energy light vans from brands such as Geely's Yuancheng, which sold 61,686 in 2025, and micro-vans from SAIC-GM-Wuling. Most enter express and urban logistics fleets with only cargo liners and partitions, so upfit spending per van sold is about USD 437. Refrigerated light vans are the main higher-value conversion and must be listed as special-purpose vehicles in the Ministry of Industry and Information Technology (MIIT) vehicle product announcements.
North America
North America accounts for 14.26% of 2025 value, USD 147.92 million from 20,491 upfits at an average of USD 7,219, the highest in the world, rising to USD 421.85 million by 2030, a 23.32% CAGR. The United States contributes USD 137.52 million from about 19,100 upfits, Canada USD 7.58 million (about CAD 10.60 million) from about 1,000 upfits and Mexico USD 2.82 million. The 2025 base is weak: Ford sold 5,186 E-Transit vans in the United States, down 58.9%, General Motors sold 4,971 BrightDrop vans before ending production in October 2025, and the federal commercial clean vehicle credit ended. Amazon's fleet of more than 30,000 Rivian vans and its order for about 5,000 Mercedes-Benz electric vans keep parcel volume flowing, and US upfitters such as Adrian Steel, Knapheide, Holman and Clarience Technologies fit trades and utility vans.
Asia-Pacific excl. China
Asia-Pacific outside China accounts for 4.59% of 2025 value, USD 47.60 million from about 14,000 upfits at USD 3,400 each, and grows at 33.76% a year to USD 203.78 million and 6.84% of value by 2030. Electric van sales rise from about 28,000 to 95,000 as Kia's PV5 and Hyundai's electric vans reach Korean fleets and export markets and Chinese electric vans are sold in Australia, Japan and Southeast Asia.
Rest of the World
The rest of the world accounts for 2.55% of 2025 value, USD 26.40 million from about 6,600 upfits, and grows fastest, at 35.70% a year, to USD 121.50 million by 2030. Electric van sales rise from about 12,000 to 45,000 across Latin America, the Middle East, Africa and Türkiye, led by multinational parcel and food companies that apply global fleet targets locally, although limited depot charging slows adoption.
How Competition Is Evolving
The electric van upfitting market is fragmented. Thousands of regional upfitters, body builders and installers compete alongside a small group of international equipment makers, and no company holds a dominant share of global value. Competition is best understood in four layers: equipment makers, body builders and converters, power and refrigeration suppliers, and van OEMs with factory programmes.
Equipment makers supply racking, partitions and floors. Sortimo International, Bott, Modul-System and System Edström lead in Europe, while Adrian Steel, Clarience Technologies with Ranger Design, Knapheide and Holman lead in North America. Their competitive edge on electric vans is vehicle-specific, lightweight and no-drill systems that carry OEM approval.
Body builders and converters handle chassis-cab bodies, refrigerated conversions and specialist builds. Gruau in France, Aebi Schmidt Group, which absorbed The Shyft Group's Utilimaster and Blue Arc brands in July 2025, and J.B. Poindexter in the United States are among the larger groups, but most refrigerated and box-body work is done by regional converters.
Power and refrigeration suppliers are gaining weight in each build. Thermo King, part of Trane Technologies, and Carrier Transicold supply electric refrigeration units, and power electronics makers such as KEB Automation supply the inverters that drive auxiliary equipment from the high-voltage battery.
Van OEMs are the fastest-growing competitors. Stellantis, Ford, Mercedes-Benz Vans, Renault Group and Volkswagen Commercial Vehicles certify partner upfitters and run factory conversion lines, taking partitions, linings and standard racking into the plant and leaving complex builds to certified partners.
Certification is becoming the entry ticket. Stellantis Pro One works with more than 550 certified conversion partners and offers warranties of up to eight years on its displayed conversions, Modul-System renewed its Ford Pro Converter Partner status in February 2026, and Mercedes-Benz Vans approves upfitters through its eXpertUpfitter and VanSolution programmes. Upfitters without OEM certification, high-voltage training and multi-stage type approval are being pushed toward accessories and used-van work.
Companies Covered
Companies covered in the report include:
Recent Market Activity
Table of Contents
Coverage & Segmentation
The study covers the global electric van upfitting market, with 2025 as the base year and 2026 – 2030 as the forecast period. Values are in US dollars at installed prices including labour, excluding the vehicle, sales taxes and freight, converted at 2025 average rates of EUR 1 = USD 1.13, USD 1 = CNY 7.18 and USD 1 = CAD 1.3978. Volumes are new electric vans sold and upfits completed. The market is segmented by upfit type, application, channel and region.
Vehicles in scope are new battery-electric, plug-in hybrid and fuel cell vans and van-based chassis cabs up to 4.25 tonnes in Europe and up to Class 3 in North America, including Chinese new energy light vans and micro-vans. Walk-in step-van bodies on strip chassis, electric pickups and light trucks, camper and leisure conversions, wheelchair-accessible passenger conversions, telematics subscriptions and the conversion of diesel vans to electric drive are excluded.
The study is a dedicated deep-dive into electric vans and does not add to related Marqstats reports. It is a subset of the Global Commercial Vehicle Upfitting study and overlaps the US Commercial Van Upfitting, North America Commercial Van Upfitting, Europe LCV Body Conversion, Van Shelving and Racking Systems and refrigerated van conversion reports, which cover diesel and electric vans together. The US slice of USD 137.52 million is about 10% of the live US Commercial Van Upfitting value but also includes chassis-cab bodies that the US report excludes. The repowering of diesel vans to electric sits in the Global Electric LCV Retrofit and Conversion report.