Market Snapshot
Middle bar: base-year value × (1 + CAGR), rounded to two decimals. This is a calculated illustration, not a separately researched annual estimate.
The global electric tail lift market size is estimated at USD 1,255.10 million in 2025 and is projected to reach USD 1,618.10 million by 2030, growing at a CAGR of 5.21% over 2026 – 2030. Annual shipments rise from about 331,000 lift kits to 393,000, a 3.49% annual rate, while the average manufacturer selling price rises from about USD 3,792 to USD 4,117 per kit as more lifts are built for battery-electric vans and trucks.
Marqstats defines the market as the manufacturer selling value of tail lifts, also called liftgates or power gates, whose lifting and tilting is driven electrically, either through an electro-hydraulic power pack running on battery power or through electromechanical actuators with no hydraulic oil. It covers cantilever, tuck-under, slider and column lifts fitted to vans, light and medium trucks, heavy rigid trucks and trailers, sold to body builders, vehicle makers and fleets. Manual and spring-assisted gates, lifts driven by engine power take-off, passenger wheelchair lifts, stationary dock levellers, body-builder installation labour and after-sales service are excluded.
Lifts powered from the vehicle's own 12 or 24 volt battery account for an estimated 82.03% of 2025 value, and cantilever lifts for 44.00%. Europe accounts for 38.01% of 2025 value and Asia-Pacific grows fastest. The study segments the market by power supply, lift type, lifting capacity, vehicle class and region.
Key Takeaways
Market Overview & Analysis
Report Summary
Marqstats sizes the electric tail lift market as the manufacturer selling value of tail lifts powered by electricity, which today means almost every tail lift sold. In 2025 about 331,000 such lift kits were shipped worldwide, worth an estimated USD 1,255.10 million at an average selling price of about USD 3,792 per kit, before body-builder installation.
A tail lift is a powered platform fitted to the rear of a van, truck or trailer that raises goods, pallets and roll cages from the ground to the load floor. Most units are electro-hydraulic: an electric motor drives a hydraulic pump in a compact power pack, and hydraulic cylinders lift and tilt the platform. The motor draws power from the vehicle battery, from an extra battery fitted for the lift, or on electric vehicles from the high-voltage traction battery through a DC-DC converter. A small number of fully electromechanical lifts replace the hydraulic cylinders with electric actuators and need no hydraulic oil.
Some industry estimates treat only about a third of tail lifts as electric, but that boundary does not hold. Tail lifts driven by engine power take-off are now rare outside a few heavy and specialist trucks, and the vast majority of cantilever, tuck-under, slider and column lifts sold in Europe, North America and Japan use battery-powered electro-hydraulic packs. Marqstats therefore sizes the full electrically powered market and splits it by power supply architecture, which is where the real change is happening.
Four product types make up the market. Cantilever lifts fold up behind the rear doors and form a closing tail, and are the standard choice on European distribution trucks. Tuck-under and fold-away lifts stow beneath the body and dominate North American box trucks and trailers. Slider lifts retract into a rail under the floor so the rear doors and docks can still be used. Column lifts, common on vans, run on vertical columns either side of the opening and keep weight low.
The market grew from about 300,000 kits worth USD 975.00 million in 2021 to 345,000 kits worth USD 1,276.50 million in 2023, as fleets renewed trucks after the pandemic and steel and component costs pushed prices up. It then eased to USD 1,260.74 million in 2024 and USD 1,255.10 million in 2025 as truck and van registrations fell in Europe and the US delivery equipment market went into what Hiab described as a trough.
The electrical demand of a lift is the reason the power architecture matters. A typical electro-hydraulic lift uses a 2 to 3 kW pump motor, which draws roughly 170 to 250 amps from a 12 volt system or half that from a 24 volt system while lifting. Diesel trucks recharge their batteries from the alternator between stops, but battery-electric vans and trucks have only a small auxiliary battery fed by a DC-DC converter, and repeated lift cycles can drain it. Lift makers and vehicle makers are responding with approved high-voltage connection points, dedicated DC-DC converters and lithium battery packs, which cost more but keep the vehicle and lift running through a full delivery shift.
Regulation shapes design in every region. In Europe tail lifts are machinery under the EU machinery rules and must meet the EN 1756-1 standard, which sets requirements for controls, overload protection, platform safety and foot protection. In the United States, liftgates are installed under body-builder practices and vehicle maker guidelines, and federal rules cover the vehicle lighting and underride protection around them. Japan has its own power gate standards and a body-builder network closely tied to truck makers. Changes to driving licence rules for 4.25 tonne zero-emission vans in the UK and EU, and CO2 targets for vans and trucks, influence how many lifts end up on electric chassis.
Global Electric Tail Lift Market Size and Forecast
The global electric tail lift market grows from USD 1,255.10 million in 2025 to USD 1,618.10 million in 2030, a CAGR of 5.21%. Marqstats expects shipments of about 339,000 kits worth USD 1,302.00 million in 2026, 351,500 worth USD 1,370.00 million in 2027, 364,500 worth USD 1,446.00 million in 2028 and 378,500 worth USD 1,529.00 million in 2029, before reaching 393,000 kits in 2030.
Value grows faster than volume. Shipments rise at 3.49% a year while the average selling price rises from about USD 3,792 to USD 4,117. Conventional lifts powered from the vehicle battery stay at about USD 3,600 to USD 3,750 per kit, but traction-battery-fed lifts sell at about USD 5,000 to USD 5,300 and lithium-pack lifts at about USD 4,500 to USD 4,600, so every shift in mix lifts the average.
The 2025 base was built region by region. Marqstats estimates about 108,500 kits in Europe, where roughly 45% of new rigid distribution trucks and about 2% of new vans receive a tail lift, about 86,000 in North America across box trucks, trailers and pickups, about 54,000 in Japan, about 44,000 in China, about 23,500 in the rest of Asia-Pacific and about 15,000 in the rest of the world.
Electric chassis drive the mix change. Marqstats estimates about 21,000 lifts were fed from traction batteries in 2025, mostly on electric vans and light trucks in China and Europe, rising to about 74,000 in 2030 as the EU 2030 CO2 targets for vans and trucks and the UK zero emission vehicle mandate raise electric shares. Lithium-pack lifts rise from about 22,000 to 50,000 units, used on diesel trucks running many delivery stops and on electric trucks where the lift must not drain the auxiliary battery.
Marqstats tracks four indicators to monitor the forecast: new rigid truck and van registrations in Europe and North America, the electric share of new vans and trucks, the order intake reported by listed tail lift makers such as Hiab and Palfinger, and steel, aluminium and motor prices that set the cost of each kit.
The mix shifts further after 2027. Lifts for vans and light trucks rise from 24.00% to 28.00% of value, lifts rated up to 1,000 kg from 34.00% to 37.00%, and Asia-Pacific from 30.64% to 33.05%. Lifts powered only from the vehicle battery lose about 21 percentage points of share, while traction-battery-fed lifts, lithium-pack lifts and fully electromechanical lifts together gain the same amount. Europe remains the largest region but its share slips from 38.01% to 36.78% as Chinese and Japanese demand grows faster.
Market Dynamics
Key Drivers
Five forces keep demand for electrically powered tail lifts growing even when truck and van registrations fall.
- Delivery work needs lifts. Home delivery, grocery and beverage distribution, parcel, furniture and white goods logistics all rely on roll cages and pallets moved at the kerb without a loading dock, and a tail lift is the standard way to do it.
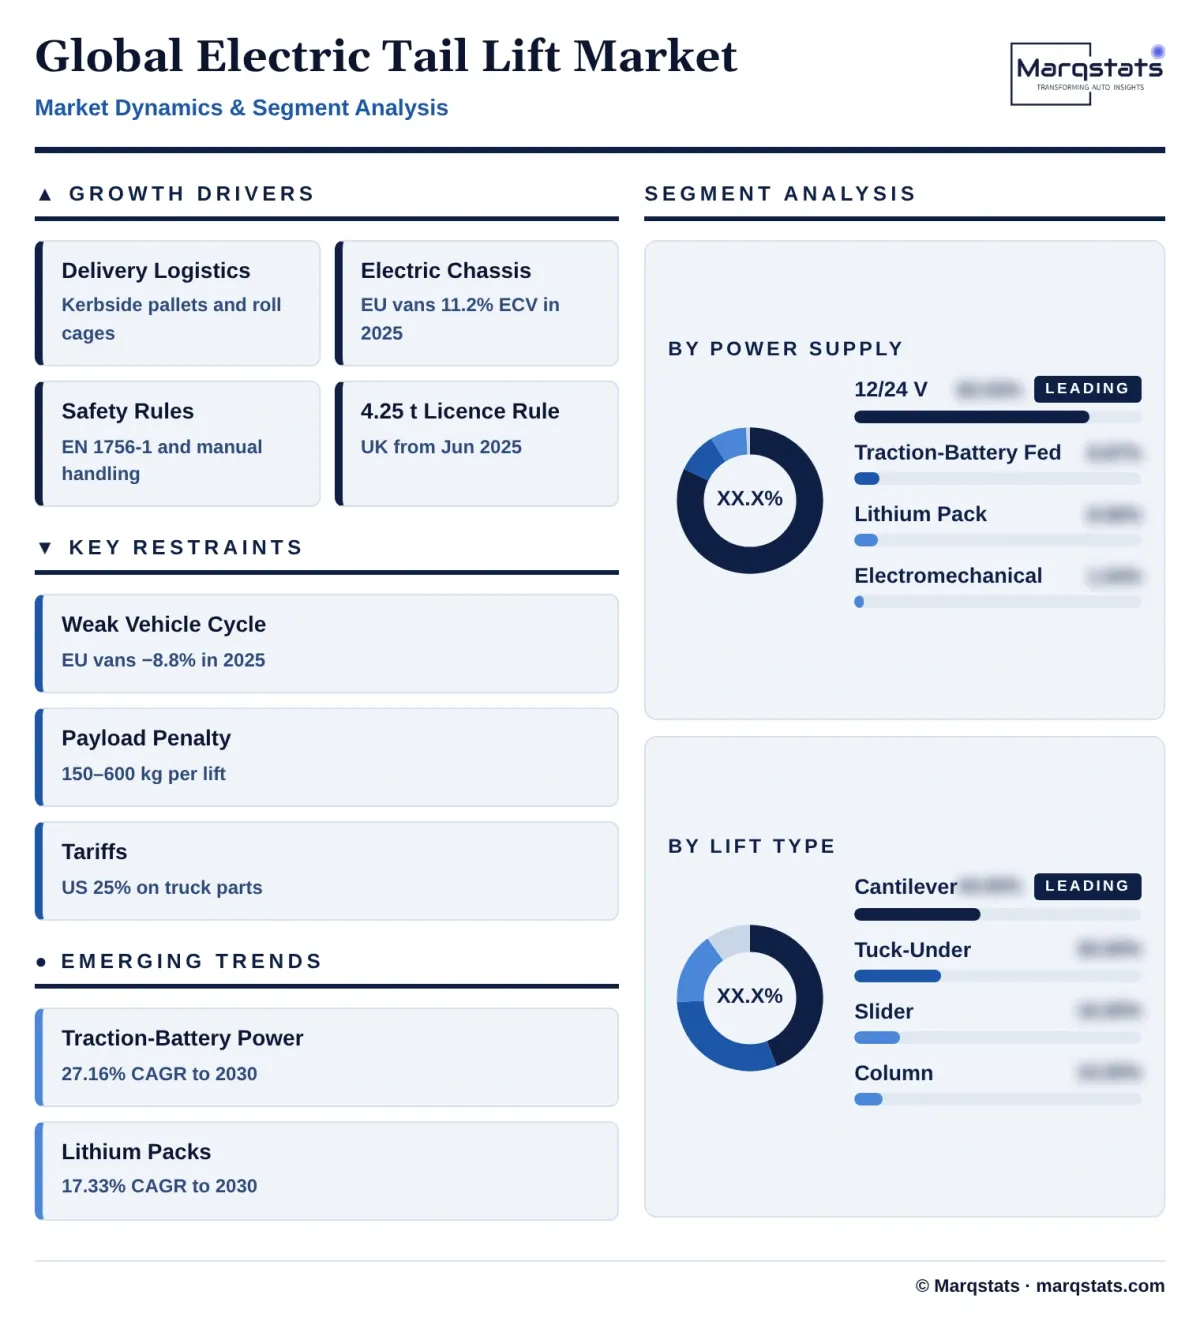
- Electric vans and trucks need new power solutions. EU van registrations reached an 11.2% electrically chargeable share in 2025, up from 6.1%, and UK battery-electric van registrations rose 36.2% to 30,169, so lift makers are adding DC-DC power units and lithium packs that protect the vehicle's 12 volt system.
- Driver safety and manual handling rules. Health and safety rules on manual handling, together with the European tail lift safety standard EN 1756-1, push fleets to fit powered lifts with two-hand controls, toe guards and overload protection rather than rely on ramps or manual unloading.
- Heavier vans allowed on car licences. The UK allowed category B licence holders to drive zero-emission vans up to 4.25 tonnes from June 2025 without extra training, and the revised EU driving licence rules make a similar allowance, giving electric vans the payload margin to carry a lift.
- Fleet uptime and lifecycle cost. Large operators buy on cost per cycle, so durability tested lifts such as Hiab's galvanised ZEPRO-G, backed by 30,000-cycle testing, and remote diagnostics win fleet contracts.
Key Restraints
Four constraints limit how fast tail lift volumes and prices can rise.
- Weak truck and van cycles. EU van registrations fell 8.8% and truck registrations 6.2% in 2025, UK van registrations fell 10.3%, and Hiab's Americas orders fell 14% in 2025, so lift shipments follow vehicle registrations down in a weak year.
- Payload penalties. A tail lift adds roughly 150 to 600 kg to the vehicle, a serious cost on a 3.5 tonne electric van that already carries a heavy battery, which limits fitment on the smallest vehicles.
- Tariffs and input costs. US Section 232 tariffs of 25% on medium and heavy truck parts from November 2025 raise the cost of imported lifts and components, and steel and aluminium price swings squeeze margins for body builders.
- Installation complexity on electric vehicles. Connecting a lift to a high-voltage system needs trained installers, vehicle maker approval and extra validation, which adds cost and time for body builders.
Key Trends
Four shifts are changing how tail lifts are powered, built and sold.
- Power from the traction battery. Electric van and truck makers increasingly provide an approved power take-off point on the high-voltage system, so the lift can run from the traction battery through a DC-DC converter rather than a separate heavy battery.
- Lithium packs replace extra lead-acid batteries. Dedicated lithium battery packs, charged from the vehicle or from solar panels, give lifts many more cycles a day with less weight than lead-acid batteries.
- Brushless motors and programmable control. Dhollandia showed a lift with brushless motors, proportional valves and programmable speed at IAA Transportation 2024, and brushless designs draw less current per cycle and cope better with low voltage.
- Lighter platforms and stronger steels. Aluminium platforms, high-strength steel and composite parts cut lift weight so vans keep their payload.
Strategic Implications
- For tail lift makers, power electronics is now part of the product. Makers that offer approved DC-DC kits for each major electric van and truck platform, plus lithium pack options, will win the growing electric chassis segment rather than leaving it to third-party installers.
- For body builders, electric chassis need new skills. Installers that are trained and certified to connect lifts to high-voltage systems can charge more and win fleet conversion contracts.
- For vehicle makers, an approved power take-off point helps sell electric vans and trucks. Providing a documented connection and software support for lifts and other bodies removes a barrier for fleet buyers.
- For fleet operators, choose the power architecture with the vehicle. Specifying the lift, its power source and its duty cycle at the time of ordering an electric vehicle avoids drained batteries, downtime and expensive retrofits.
- For investors, the market is mature in volume but rising in content. Growth comes from price mix, electric chassis and service rather than strong unit growth, which favours makers with broad electric vehicle approvals and large service networks.
- For component suppliers, the opportunity is in compact power units, brushless motors, lithium packs and DC-DC converters sized for lift duty cycles, which raise content per lift as the electric chassis share grows.
Market Segmentation
Electro-hydraulic lifts powered from the vehicle's own 12 or 24 volt battery, sometimes with an extra lead-acid battery, account for 82.03% of 2025 value, USD 1,029.60 million and about 286,000 kits at about USD 3,600 each. Their value falls to USD 982.50 million by 2030, a 0.93% annual decline, and their share drops to 60.72% as electric chassis and lithium packs take over.
Lifts powered from the high-voltage traction battery of an electric van or truck through a DC-DC converter account for 8.87% of 2025 value, USD 111.30 million and about 21,000 kits at about USD 5,300 each, and grow fastest, at 27.16% a year, to USD 370.00 million and 22.87% of the market by 2030.
Lifts with their own lithium battery pack, charged from the vehicle or from solar panels, account for 8.06% of 2025 value, USD 101.20 million and about 22,000 kits, and grow at 17.33% a year to USD 225.00 million by 2030 on high-cycle delivery work.
Lifts that use electric actuators instead of hydraulic cylinders and need no hydraulic oil account for 1.04% of 2025 value, USD 13.00 million and about 2,000 kits, and grow at 25.58% a year to USD 40.60 million by 2030, used where oil leaks are not acceptable, such as food and pharmaceutical delivery.
Cantilever lifts account for 44.00% of 2025 value, USD 552.24 million, and grow at 4.73% a year to USD 695.78 million by 2030. They dominate European distribution trucks because the platform also closes the rear of the body.
Tuck-under and fold-away lifts account for 30.00% of 2025 value, USD 376.53 million, and grow at 5.90% a year to USD 501.61 million, led by North American box trucks and trailers and by vans in Europe.
Slider lifts that retract under the floor account for 16.00% of 2025 value, USD 200.82 million, and grow at 6.50% a year to USD 275.08 million, used where trucks also load at docks and where Japanese power gates retract under the body.
Column lifts account for 10.00% of 2025 value, USD 125.51 million, and grow at 3.02% a year to USD 145.63 million, mostly on vans and specialist gas cylinder and beverage trucks.
Lifts rated up to 1,000 kg account for 34.00% of 2025 value, USD 426.73 million, and grow fastest at 7.01% a year to USD 598.70 million as electric vans add lifts for parcel and grocery work.
Lifts rated from 1,001 to 2,000 kg account for 44.00% of 2025 value, USD 552.24 million, and grow at 4.24% a year to USD 679.60 million, the standard choice for medium distribution trucks.
Lifts rated above 2,000 kg account for 22.00% of 2025 value, USD 276.13 million, and grow at 4.24% a year to USD 339.80 million on heavy rigid trucks and trailers carrying full pallets of drinks and building materials.
Vans and light trucks up to 4.25 tonnes account for 24.00% of 2025 value, USD 301.22 million, and grow fastest at 8.51% a year to USD 453.07 million by 2030, driven by electric vans and the 4.25 tonne licence allowance.
Medium rigid trucks account for 46.00% of 2025 value, USD 577.35 million, and grow at 4.75% a year to USD 728.14 million, the core of urban distribution.
Heavy rigid trucks account for 20.00% of 2025 value, USD 251.02 million, and grow at 3.02% a year to USD 291.26 million.
Trailers and semi-trailers account for 10.00% of 2025 value, USD 125.51 million, and grow at 3.02% a year to USD 145.63 million, mostly city semi-trailers in Europe and dry van and refrigerated trailers in North America.
By Geography
Europe
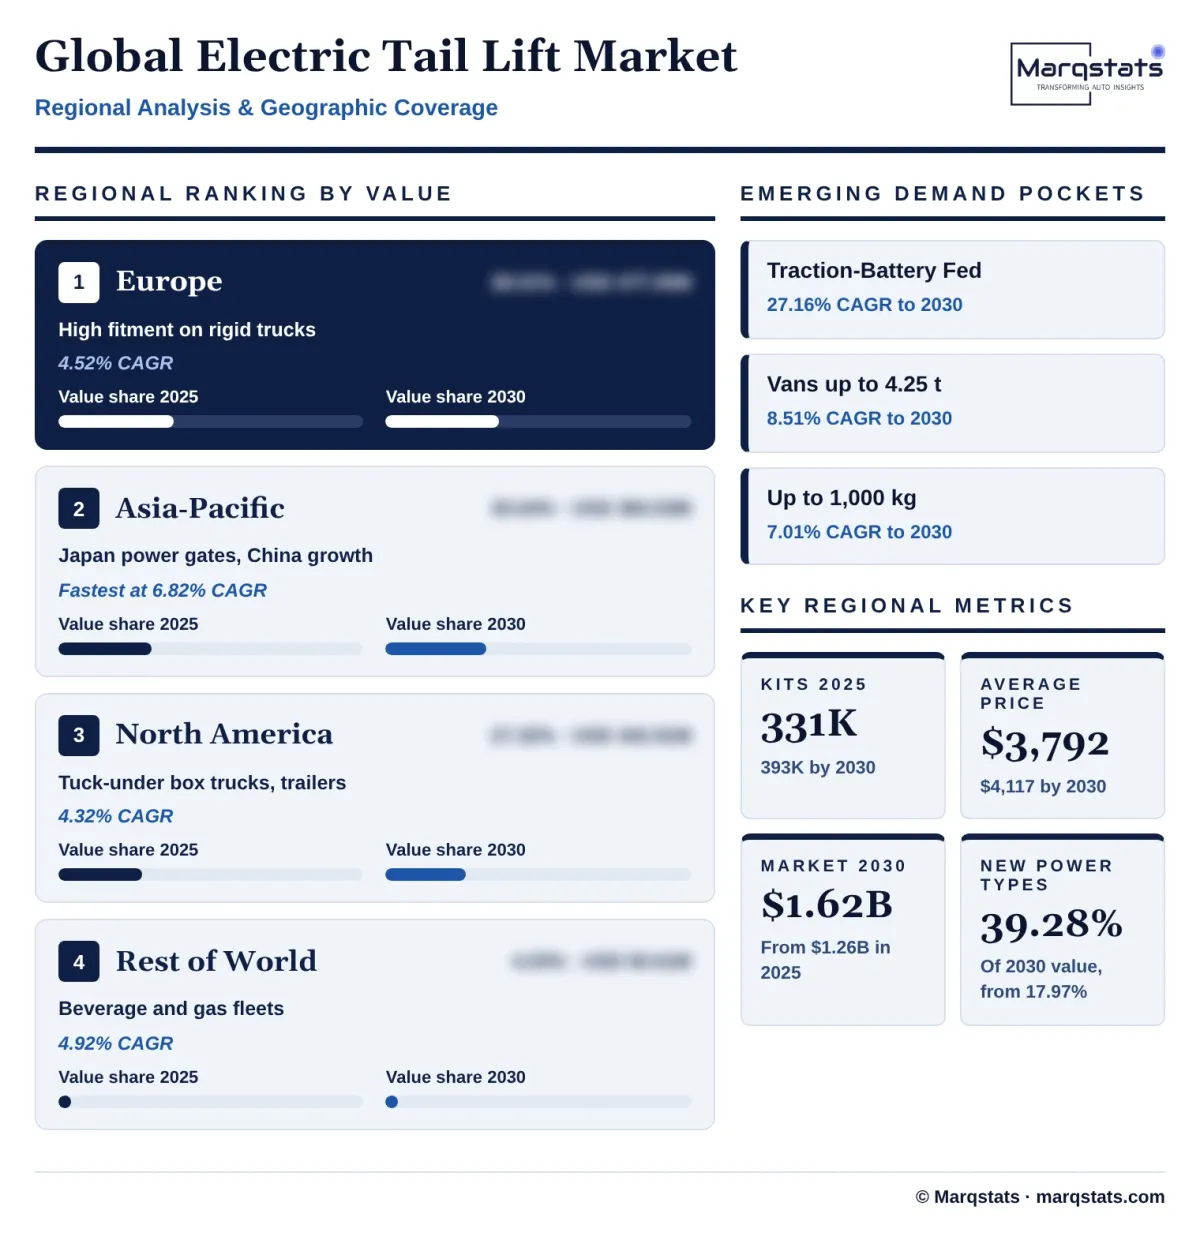
Europe is the largest market, with 38.01% of 2025 value, USD 477.05 million and about 108,500 kits, rising to USD 595.16 million by 2030, a 4.52% CAGR. Germany, France, the UK, the Benelux and the Nordics have high fitment on distribution trucks, and Hiab (ZEPRO and DEL), Dhollandia, Palfinger (MBB), Bär Cargolift, Sörensen, Dautel and Anteo build most lifts in the region. EU van registrations fell 8.8% in 2025 while the electrically chargeable share rose to 11.2%, and truck registrations fell 6.2% to 307,460 with a 4.2% electrically chargeable share, so the value mix is shifting toward lifts for electric chassis faster than in any other region.
Asia-Pacific
Asia-Pacific accounts for 30.64% of 2025 value, USD 384.53 million and about 121,500 kits, and grows fastest, at 6.82% a year, to USD 534.84 million and 33.05% of the market by 2030. Japan is the largest single market in the region, with about 54,000 power gates a year worth an estimated USD 199.80 million fitted mainly to small and medium trucks by makers such as Kyokuto Kaihatsu Kogyo and ShinMaywa. China, with about 44,000 kits worth USD 95.20 million, grows fastest as city logistics fleets of electric light trucks add lifts, and Australia and New Zealand, Korea and South-East Asia make up the remaining USD 89.53 million.
North America
North America accounts for 27.32% of 2025 value, USD 342.91 million and about 86,000 kits, and grows at 4.32% a year to USD 423.74 million by 2030. Tuck-under liftgates on Class 4 to 7 box trucks and dry van and refrigerated trailers dominate, supplied by Maxon, Waltco (Hiab), Anthony, Thieman and Tommy Gate. Hiab's Americas orders fell 14% in 2025 as the US delivery equipment market went into a trough, and 25% Section 232 tariffs on medium and heavy truck parts from November 2025 favour liftgates built in the region.
Rest of the World
The rest of the world accounts for 4.03% of 2025 value, USD 50.61 million and about 15,000 kits, and grows at 4.92% a year to USD 64.36 million by 2030, led by beverage and gas distribution fleets in Latin America, the Gulf and South Africa.
How Competition Is Evolving
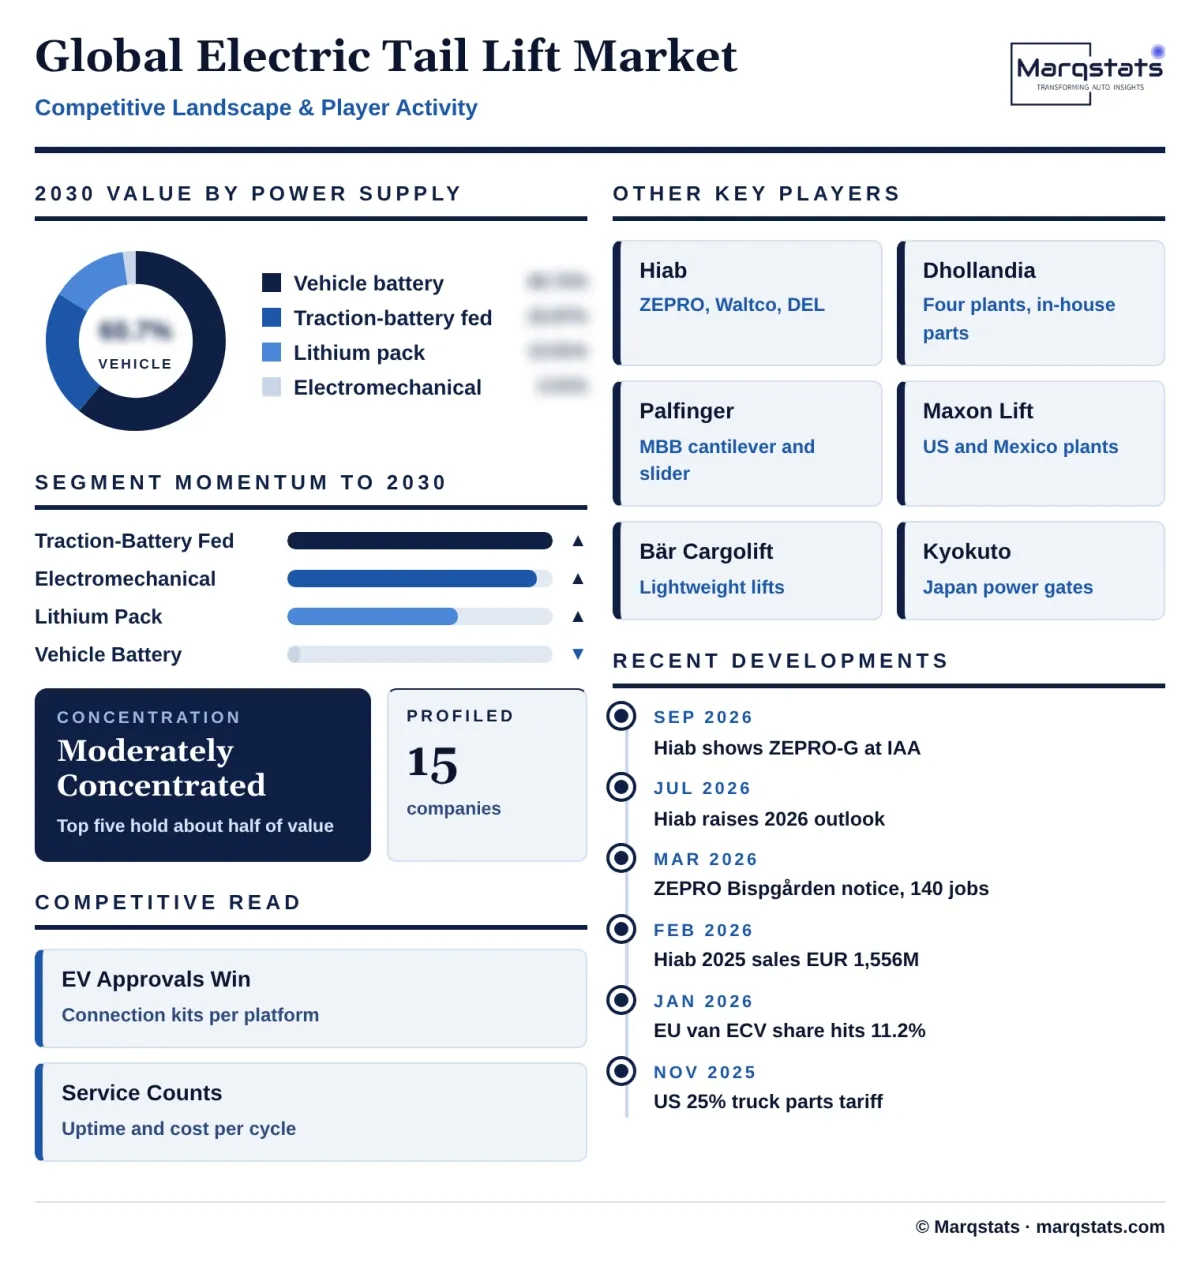
The electric tail lift market is moderately concentrated. Marqstats estimates that the five largest groups, Hiab with ZEPRO, Waltco and DEL, Dhollandia, Palfinger with MBB, Maxon Lift and Gerd Bär with Bär Cargolift, account for a little over half of global value, with a long tail of regional makers in Europe, North America, Japan and China.
Hiab is the largest listed player. Its 2025 sales were EUR 1,556 million, down 6%, with a record comparable operating profit margin of 13.7%, and its tail lifts sit in the Equipment segment alongside demountables. In the first half of 2026 orders rose 11% to EUR 839 million and the company raised its 2026 margin outlook to above 14.5%.
Europe's independent specialists compete on range and service. Dhollandia builds lifts in Belgium, France, Slovakia and Ireland and makes most hydraulic, electrical and mechanical components in-house, Bär Cargolift specialises in lightweight lifts, and Palfinger offers cantilever, slider, column and electromechanical designs.
In North America, Maxon Lift operates large plants in California and near Monterrey, Mexico, competing with Waltco, Anthony Liftgates, Thieman and Tommy Gate. In Japan, Kyokuto Kaihatsu Kogyo has long been the leading power gate supplier.
Competition is moving toward electric vehicle approvals, power electronics and service. Makers that have approved connection kits for the main electric vans and trucks, lithium pack options and dense service networks will gain share as the chassis mix changes.
Manufacturing footprints are being reshaped. Hiab is consolidating ZEPRO production from Bispgården into its Stargard plant in Poland by the end of 2026, Palfinger has pointed to US tariffs weighing on North American demand, and North American liftgate makers with plants in the United States and Mexico are better placed under the November 2025 Section 232 tariffs and the USMCA rules than importers.
Companies Covered
Companies covered in the report include:
Recent Market Activity
Table of Contents
Coverage & Segmentation
The study covers the global electric tail lift market, with 2025 as the base year, 2021 – 2025 as the historical period and 2026 – 2030 as the forecast period. Values are in US dollars at manufacturer selling prices for complete lift kits, and volumes are annual shipments of lift kits. The market is segmented by power supply, lift type, lifting capacity, vehicle class and region.
Electric tail lifts are lifts whose lifting and tilting is driven electrically, through battery-powered electro-hydraulic power packs or electromechanical actuators. Manual and spring-assisted gates, lifts driven by engine power take-off, wheelchair lifts in passenger vehicles, stationary dock levellers, body-builder installation labour, spare parts and service are excluded. Tail lifts are part of the van body conversion and upfitting markets covered in other Marqstats reports; the values here should not be added to those markets. Segment and regional splits are Marqstats estimates.