Market Snapshot
Middle bar: base-year value × (1 + CAGR), rounded to two decimals. This is a calculated illustration, not a separately researched annual estimate.
The global electric passenger ferry market size is estimated at USD 384.50 million in 2025 and is projected to reach USD 1,071.20 million by 2030, growing at a CAGR of 22.74% over 2026 – 2030. Annual deliveries rise from about 175 vessels to 462, a 21.43% annual rate, as transit agencies, island operators and tour companies replace diesel boats on short, fixed routes.
Marqstats defines the market as the delivered shipyard value of new passenger-only ferries and water taxis that use battery-electric, plug-in hybrid or hydrogen fuel cell propulsion, including hull, outfitting, drivetrain and batteries. Ferries that carry cars or trucks, cruise ships, recreational boats, workboats, shore charging stations, terminals and operating contracts are excluded.
Battery-electric vessels account for an estimated 72.00% of 2025 value and catamarans for 50.00%. Europe accounts for 44.00% of 2025 value and Asia-Pacific for 42.00%. The study segments the market by passenger capacity, propulsion, hull type, operating model and region.
Key Takeaways
Market Overview & Analysis
Report Summary
Marqstats sizes the electric passenger ferry market as the delivered shipyard value of new passenger-only ferries and water taxis with battery-electric, plug-in hybrid or hydrogen fuel cell propulsion. In 2025 about 175 such vessels were delivered worldwide, worth an estimated USD 384.50 million at an average of about USD 2.20 million per vessel.
Passenger ferries suit electric propulsion better than almost any other ship type. They run short, repeated routes on fixed timetables, return to the same piers many times a day and can charge while passengers board. Fuel and maintenance make up a large part of their cost, and their engines run close to homes, beaches and city centres, so noise and exhaust matter to residents and regulators.
The market includes three types of vessel. Water taxis and small launches carry up to 20 passengers on on-demand, resort and short harbour trips. Commuter ferries for 21 to 100 passengers run scheduled urban and island routes. Larger passenger ferries for more than 100 passengers serve busy harbour crossings and island links, such as the 150-passenger E-Kat delivered by Damen to Reederei Norden-Frisia in Germany in January 2025 and the 400-passenger New Pearl 39 that Sun Ferry put into service in Hong Kong in 2025.
Electric passenger vessels are now a large part of the battery-powered fleet. The Maritime Battery Forum ship register passed 2,000 battery-powered ships in operation or on order in October 2026, with 2.4 GWh of installed capacity. Passenger vessels, including car ferries, were the largest group at 570 ships, ahead of offshore vessels at 313 and cargo ships at 265.
The market grew from about 88 vessels worth USD 168.00 million in 2021 to 104 worth USD 205.50 million in 2022, 128 worth USD 262.00 million in 2023 and 150 worth USD 318.40 million in 2024. Growth came from canal and fjord tour boats in Europe, Chinese river and lake ferries, the first Kochi Water Metro boats and the first series-built electric hydrofoils.
Regulation shapes demand in each region. Norway has made zero emission mandatory for smaller passenger ships in its World Heritage fjords from 2026, and for larger cruise ships from 2032. Singapore requires new harbour craft to be fully electric, able to run on B100 biofuel or compatible with net-zero fuels from 2030. In the United States, federal grants rather than mandates drive orders, because California is not enforcing the zero-emission standards for in-use short-run ferries that the EPA did not authorise. Classification societies such as DNV set battery safety rules that every commercial vessel must meet.
Hydrofoils have opened a new class of route. Conventional electric boats are efficient at low speed but need very large batteries to go fast, because the power a displacement hull needs rises steeply with speed. A hydrofoil lifts the hull clear of the water above about 18 knots and uses about 80% less energy, so it can run 20- to 40-nautical-mile island and coastal routes at 25 knots with low wake. This lets electric vessels replace diesel speedboats and fast ferries on routes where batteries were too heavy before.
India shows how a city can build a network. The Kochi Water Metro opened in April 2023 with hybrid-electric 100-passenger catamarans built by Cochin Shipyard, using lithium titanate batteries that recharge in 10 to 15 minutes. It had served more than 5 million passengers by September 2025 and ran 20 boats in January 2026, and the operator has proposed similar systems for 18 Indian cities. Mumbai has ordered 11 Candela hydrofoils for commuter routes across the harbour.
Global Electric Passenger Ferry Market Size and Forecast
The global electric passenger ferry market grows from USD 384.50 million in 2025 to USD 1,071.20 million in 2030, a CAGR of 22.74%. Marqstats expects about 205 deliveries worth USD 455.00 million in 2026, 250 worth USD 560.00 million in 2027, 310 worth USD 690.00 million in 2028, 380 worth USD 860.00 million in 2029 and 462 worth USD 1,071.20 million in 2030.
The average delivered price changes little. It moves from about USD 1.91 million in 2021 to USD 2.20 million in 2025 and USD 2.32 million in 2030. Larger ferries for more than 100 passengers cost about USD 7 million to USD 8 million each, commuter ferries about USD 2 million and water taxis from USD 0.3 million for a small launch to about USD 3 million for a hydrofoil. Battery systems certified for marine use cost several times more per kWh than automotive packs because of fire protection, ventilation and class approval.
Order books support the forecast. Candela reported more than 65 P-12 orders worth about EUR 185 million in March 2026, including 20 for Boreal in Norway, 11 for JalVimana in Mumbai, 10 for Seudamgo in Thailand and 10 for Ego Shuttle in the Maldives. All American Marine is building three 150-passenger battery-electric ferries for San Francisco Bay Ferry under a USD 46 million contract, with the first due in early 2027. Kochi Water Metro had 20 boats in service in January 2026 with three more under construction and a tender for 15 more.
Public money decides the timing of large orders. The Federal Transit Administration published its FY 2026 ferry funding notice on 6 April 2026 and selected 23 projects worth USD 664.76 million in August 2026, of which five Electric or Low-Emitting Ferry projects received USD 107.31 million. Hong Kong funded four electric ferries with HK$350 million under its pilot scheme, and India is studying water metro systems in 18 cities.
Marqstats tracks four indicators to monitor the forecast: shipyard and hydrofoil maker delivery schedules, public ferry grant awards in the United States and Europe, zero-emission rules for passenger vessels in Norway, Singapore and other ports, and grid connection times for high-power charging at ferry piers.
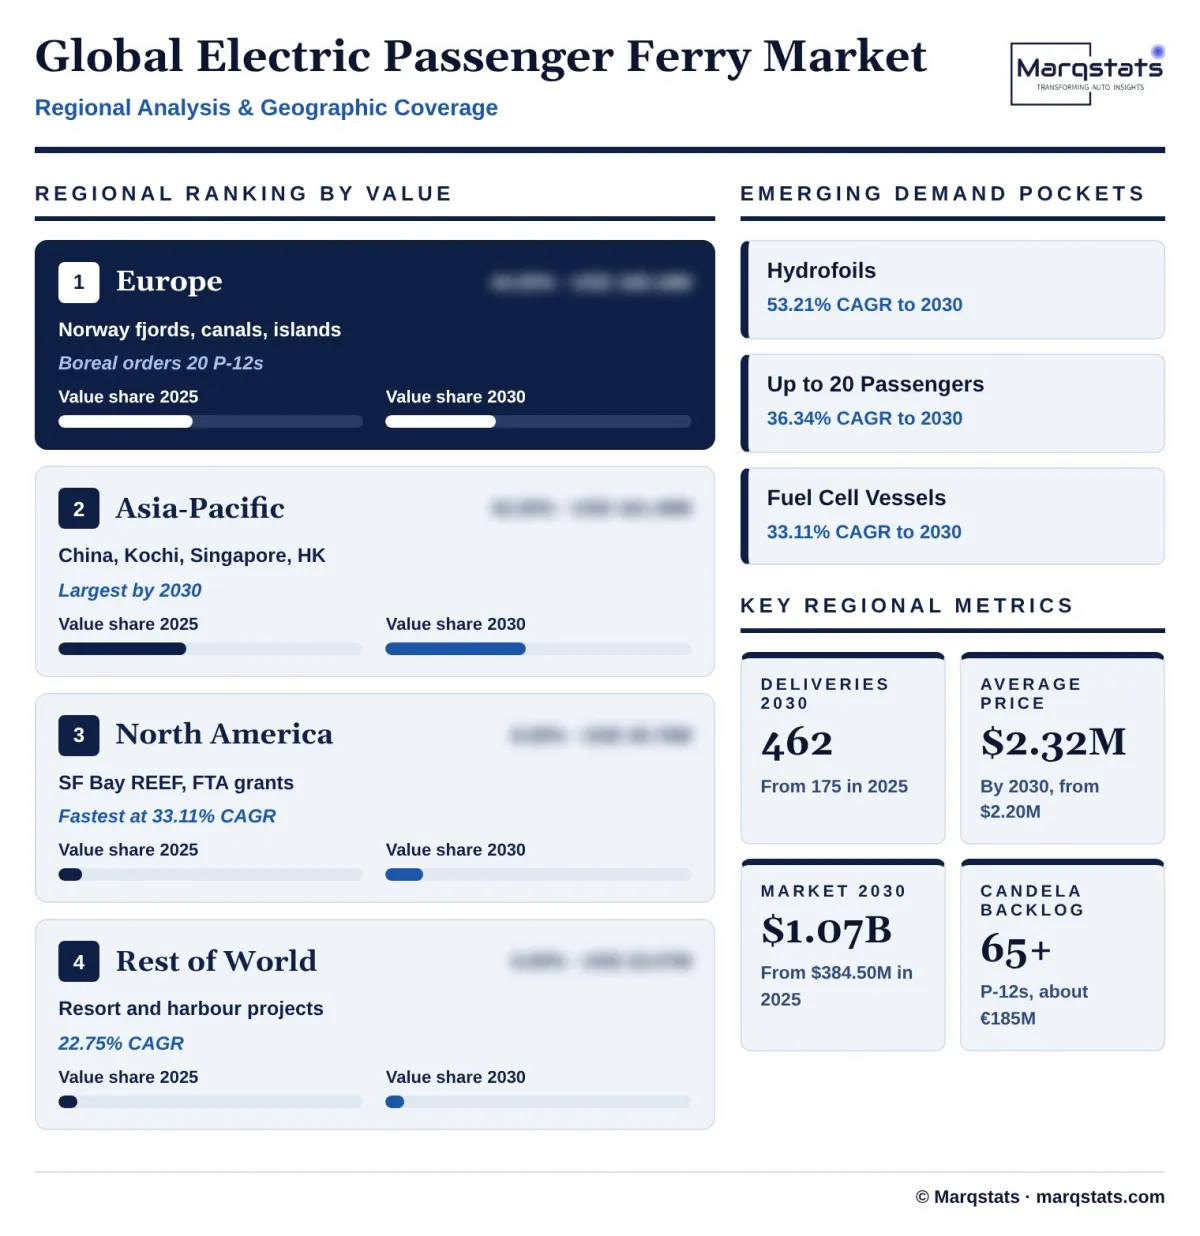
The mix of vessels changes over the forecast. Hydrofoils rise from 8.84% to 26.79% of value, water taxis and small launches from 13.52% to 22.87%, battery-electric vessels from 72.00% to 80.00% and public transit buyers from 58.00% to 62.00%. Conventional monohulls fall from 41.16% to 23.21% as canal and lake fleets near full electrification and growth moves to faster vessels. Asia-Pacific rises from 42.00% to 46.00% and North America from 8.00% to 12.00%, while Europe falls from 44.00% to 36.00% but still grows at 17.91% a year.
Running cost explains why operators switch. A diesel fast catamaran for 30 to 50 passengers uses about 80 to 110 litres of fuel an hour, while an electric hydrofoil of similar capacity uses about 80 to 110 kWh an hour. Over a ten-year life, lower energy and maintenance costs offset much of the higher purchase price, and grants of up to 80% of capital cost in US federal programmes close the remaining gap for public operators.
Market Dynamics
Key Drivers
Five forces are moving passenger ferry and water taxi operators from diesel to electric vessels.
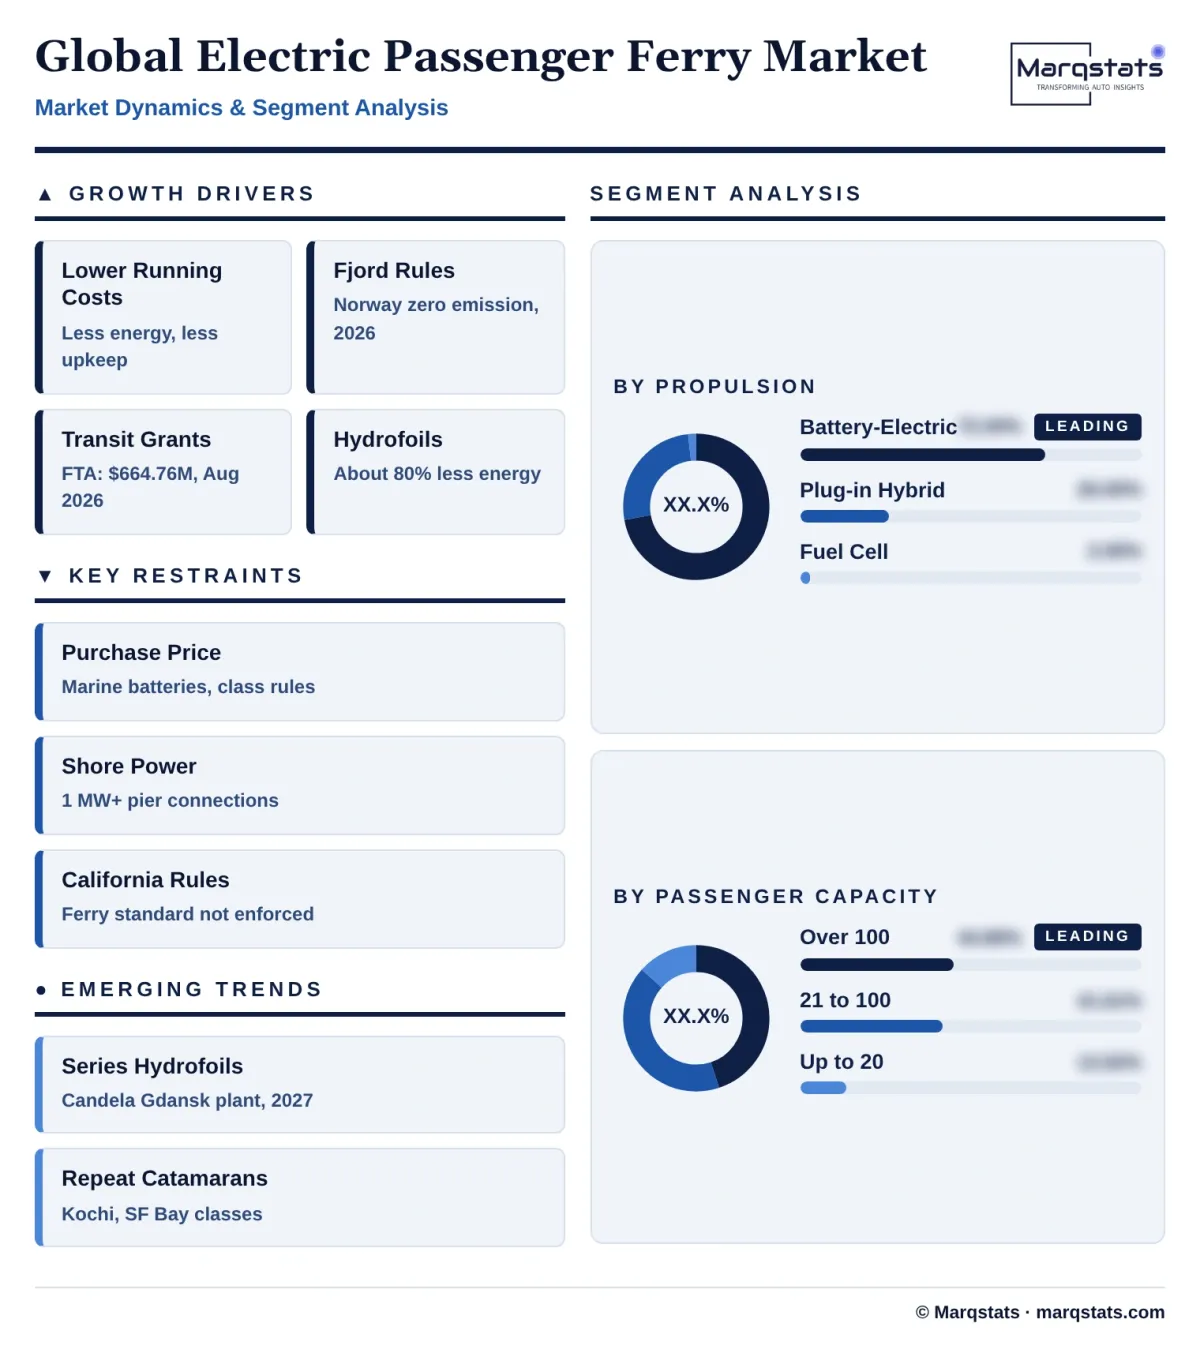
- Lower running costs. Electric ferries use far less energy than diesel boats on short routes and need less maintenance, because there are no engine overhauls, oil changes or exhaust systems to service.
- Zero-emission rules in sensitive waters. Norway requires passenger ships below 10,000 gross tonnage to operate without emissions in its World Heritage fjords from January 2026, and Singapore requires new harbour craft to be fully electric, able to run on B100 biofuel or compatible with net-zero fuels from 2030.
- Public transit funding. The US Federal Transit Administration funds new ferries through its Passenger Ferry and Electric or Low-Emitting Ferry programmes, and Hong Kong, India and several European cities pay for electric vessels as part of public transport budgets.
- Hydrofoil technology. Computer-controlled foils lift the hull out of the water at speed, cutting energy use by about 80% and making long, fast routes possible on small batteries.
- Demand for quiet, clean tourism. Tour operators in fjords, canals and island resorts use electric boats to cut noise and exhaust, and some charge higher fares for silent trips.
- Port and city air quality. Ferries run close to homes, beaches and city centres, so cutting exhaust and noise is a visible benefit that cities and tourism boards are willing to pay for.
Key Restraints
Four constraints limit how fast electric passenger ferries are ordered, built and put into service.
- High purchase price. Marine-certified batteries, fire protection and class approval make an electric ferry more expensive to build than a diesel equivalent, so most public orders depend on grants.
- Shore power at piers. Fast turnaround charging needs connections of 1 MW or more, and utility upgrades at harbours can take several years, delaying new routes.
- Uncertain rules in California. The US EPA took no action on the zero-emission standards for in-use short-run ferries when it authorised most of the Commercial Harbor Craft Regulation in January 2025, and CARB withdrew its request for those elements and is not enforcing them.
- Range and weather limits. Battery weight limits speed and range for conventional hulls, and cold weather and rough seas reduce usable range, so longer coastal routes still need hybrid backup.
Key Trends
Four shifts are changing how electric passenger ferries are designed, built and bought.
- Series production of hydrofoils. Candela plans a second factory in Gdansk with capacity for 70 boats a year from 2027, which with its Stockholm plant would allow about 100 vessels a year.
- Standard catamaran designs. Transit agencies are ordering repeat classes of aluminium catamarans, such as the Kochi Water Metro boats from Cochin Shipyard and the San Francisco Bay Ferry REEF vessels, to cut design cost and training time.
- Battery buffers on shore. Ports install battery storage at piers that charges slowly from the grid and discharges quickly into ferries during short stops, avoiding large grid upgrades.
- Chemistries chosen for fast charging. Lithium titanate packs, used on the Kochi Water Metro boats for 10- to 15-minute charging, and lithium iron phosphate packs are replacing nickel-based chemistries in high-cycle ferry service.
Strategic Implications
- For shipyards, repeat designs are the path to margin. Yards that can build the same certified catamaran or hydrofoil many times, rather than one-off vessels, will win most public tenders and keep prices down.
- For transit agencies, charging should be planned with the vessels. Ordering pier charging, grid connections and battery buffers at the same time as the ferries avoids boats waiting for shore power.
- For battery and drivetrain suppliers, marine certification is the entry ticket. Packs and motors approved by classification societies such as DNV, with proven fire containment, are a requirement for every commercial passenger vessel.
- For tour and island operators, hydrofoils change route economics. Fast electric craft can replace diesel speedboats on 20- to 40-nautical-mile island links where conventional electric boats lack range.
- For investors, order books and grants are the key signals. Hydrofoil makers with large backlogs and new factories, and shipyards with repeat public transit orders, offer the most visible growth, while project timing depends on grant awards and pier charging.
- For regulators, clear zero-emission dates bring orders forward. Norway's fjord rule and Singapore's 2030 harbour craft target show that fixed deadlines give operators and shipyards the certainty to invest.
Market Segmentation
Water taxis and small launches for up to 20 passengers account for 13.52% of 2025 value, USD 52.00 million and about 72 vessels, and grow fastest, at 36.34% a year, to USD 245.00 million and 22.87% of 2030 value. Candela P-12 hydrofoils, electric harbour launches from Pyxis in Singapore and canal water taxis in European cities lead this segment.
Commuter ferries for 21 to 100 passengers account for 41.61% of 2025 value, USD 160.00 million and about 80 vessels, rising to USD 370.50 million by 2030, an 18.29% CAGR, while their share falls to 34.59%. The Kochi Water Metro 100-passenger boats, Chinese river ferries and European canal and fjord vessels make up most of this segment.
Larger passenger ferries for more than 100 passengers account for 44.86% of 2025 value, USD 172.50 million and about 23 vessels, rising to USD 455.70 million by 2030, a 21.44% CAGR, and 42.54% of the market. The Damen E-Kat, the Sun Ferry New Pearl 39, the San Francisco Bay Ferry REEF vessels and the Artemis EF-24 Passenger represent this class.
Fully battery-electric vessels account for 72.00% of 2025 value, USD 276.84 million, rising to USD 856.96 million by 2030, a 25.36% CAGR, and 80.00% of the market, because most passenger routes are short enough to charge at the pier.
Vessels with batteries and a backup generator account for 26.00% of 2025 value, USD 99.97 million, rising to USD 182.10 million by 2030, a 12.74% CAGR, while their share falls to 17.00%. They serve longer coastal routes and networks where charging is not yet available at every pier, as on the Kochi Water Metro.
Fuel cell passenger vessels account for 2.00% of 2025 value, USD 7.69 million, and grow at 33.11% a year to USD 32.14 million and 3.00% of 2030 value. Projects remain few because hydrogen supply at ports is limited.
Catamarans account for 50.00% of 2025 value, USD 192.25 million, rising to USD 535.60 million by 2030, a 22.74% CAGR, and keep a 50.00% share. Two narrow hulls have low resistance and wide decks for boarding, which suits busy commuter routes.
Conventional monohulls account for 41.16% of 2025 value, USD 158.25 million, rising to USD 248.60 million by 2030, a 9.45% CAGR, while their share falls to 23.21%. They serve slow canal, river and lake routes where speed limits apply.
Hydrofoil vessels account for 8.84% of 2025 value, USD 34.00 million, and grow fastest, at 53.21% a year, to USD 287.00 million and 26.79% of 2030 value, led by the Candela P-12 and the Artemis EF-12 and EF-24.
Municipal and regional transit operators account for 58.00% of 2025 value, USD 223.01 million, rising to USD 664.14 million by 2030, a 24.39% CAGR, and 62.00% of the market.
Tour, excursion and island operators account for 30.00% of 2025 value, USD 115.35 million, rising to USD 278.51 million by 2030, a 19.28% CAGR, while their share falls to 26.00%.
Resort transfers, private charters and corporate shuttles account for 12.00% of 2025 value, USD 46.14 million, rising to USD 128.55 million by 2030, a 22.74% CAGR, and keep a 12.00% share.
By Geography
Europe
Europe is the largest market, with 44.00% of 2025 value, USD 169.18 million, rising to USD 385.63 million by 2030, a 17.91% CAGR, while its share falls to 36.00%. Norway leads, with zero-emission rules in its World Heritage fjords from January 2026 and the Boreal order for 20 Candela P-12 hydrofoils, the first two due in 2027. Amsterdam, Paris, Stockholm and the German Wadden Sea islands add canal, river and island ferries, and the United Kingdom has the Artemis EF-24 Passenger for Red Funnel.
Asia-Pacific
Asia-Pacific accounts for 42.00% of 2025 value, USD 161.49 million, and grows at 25.00% a year to USD 492.75 million, becoming the largest region with 46.00% of the market by 2030. Chinese shipyards build most of the region's electric river and lake ferries, the Kochi Water Metro runs 20 hybrid-electric boats and plans 78, Singapore requires electric-capable harbour craft from 2030, Hong Kong funds four electric ferries, and Candela has orders from Mumbai, Thailand and the Maldives.
North America
North America accounts for 8.00% of 2025 value, USD 30.76 million, and grows fastest, at 33.11% a year, to USD 128.54 million and 12.00% of 2030 value. San Francisco Bay Ferry has three 150-passenger battery-electric ferries under construction at All American Marine, the first due in early 2027, and the Federal Transit Administration funds new low- and no-emission ferries every year.
Rest of World
The rest of the world accounts for 6.00% of 2025 value, USD 23.07 million, rising to USD 64.28 million by 2030, a 22.75% CAGR, with resort, coastal and harbour projects in the Middle East, Latin America and Africa.
How Competition Is Evolving
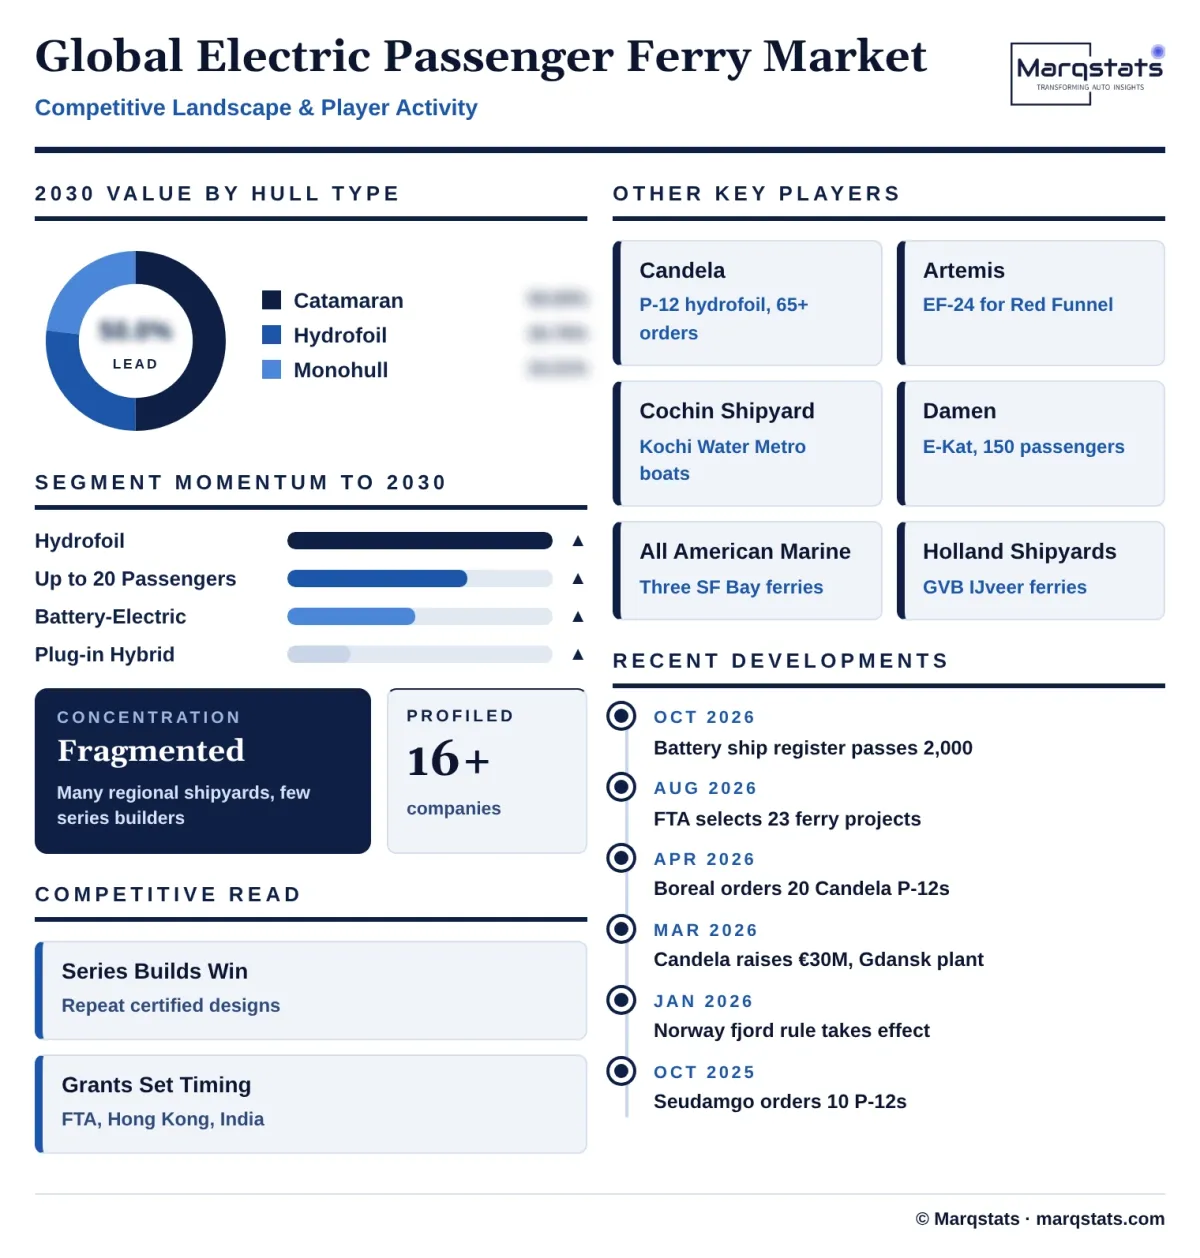
The electric passenger ferry market is fragmented. Many regional shipyards build small numbers of vessels for local operators, while a few specialists, including Candela in hydrofoils, Damen and Holland Shipyards in Europe, Cochin Shipyard in India, All American Marine in the United States and Chinese inland shipyards, deliver repeat designs.
Builders depend on a small group of drivetrain and battery suppliers. Corvus Energy, Echandia and EST-Floattech supply marine battery systems, and Wartsila, ABB and Siemens Energy supply electric propulsion and power systems, while naval architects such as Incat Crowther design many of the hulls.
Two business models compete. Most shipyards build vessels to an operator design under public tenders. Hydrofoil makers such as Candela and Artemis sell standard products with their own drivetrains and software, compete on speed and energy use, and build series production lines.
Competition will be decided by delivered cost, certification and charging. Builders that can offer class-approved repeat designs, shorter build times and a charging package with each vessel will win the growing number of public transit orders.
Order books show who is scaling. Candela had more than 65 P-12 orders worth about EUR 185 million in March 2026 and is adding a second factory in Poland, Artemis is building the 150-passenger EF-24 Passenger for Red Funnel on the Southampton to Cowes route, All American Marine holds a USD 46 million contract for three San Francisco Bay Ferry vessels with Wartsila electric propulsion, and Cochin Shipyard is building three more boats for Kochi Water Metro.
Asian builders compete on price and volume. Chinese inland shipyards build electric river and lake ferries at lower prices than European yards, Penguin International in Singapore has built 200-passenger electric ferries for Shell, and Pyxis is building electric launches and plans more than 100 vessels by 2030.
Companies Covered
Companies covered in the report include:
Recent Market Activity
Table of Contents
Coverage & Segmentation
The study covers the global electric passenger ferry market, with 2025 as the base year, 2021 – 2025 as the historical period and 2026 – 2030 as the forecast period. Values are in US dollars at delivered shipyard prices, and volumes are annual vessel deliveries. The market includes new passenger-only ferries and water taxis with battery-electric, plug-in hybrid or hydrogen fuel cell propulsion, covering hull, outfitting, drivetrain and batteries. Euro figures are converted at a 2025 average of USD 1.13 per euro.
Ferries that carry cars or trucks, such as the 2,100-passenger, 225-car China Zorrilla built by Incat, cruise ships, recreational boats, workboats, retrofits of existing vessels, shore charging stations, terminals and operating contracts are excluded. This market is a subset of the Marqstats Global Electric and Hybrid Boat and Ship report, and the figures should not be added together. Segment and regional splits are Marqstats estimates built on shipyard and operator disclosures, public grant awards, order announcements and vessel price benchmarks.